Most fleets know their total fuel bill. Far fewer can say how much of it was avoidable. Diesel hit a record national average of $6.53 a gallon in the week of 21 September 2026, according to the U.S. Energy Information Administration, up 89% from its January low. At that price, the fuel line on a truck’s cost per mile can be larger than the payment on the truck itself. This guide skips the list of generic tips and shows where fuel money actually leaks: six leaks you can measure, the cost-per-mile maths behind them, a worked example for a 25-truck fleet, and how fuel fits into total cost of ownership. To see the numbers on your own fleet, schedule a short demo with our team.
Fuel was one-fifth of a truck’s cost per mile in 2025, and the share is rising
The American Transportation Research Institute’s 2025 operating cost study put the average cost of running a truck at $2.336 per mile, a record. Fuel accounted for about 48 cents of it, roughly a fifth, second only to driver pay. Those figures were gathered before diesel climbed through 2026, so for most fleets fuel’s share is larger today.
That breakdown also explains why fuel savings are easy to overstate and hard to prove. A 5% cut in fuel spend is about 2.4 cents a mile at 2025 prices. That is real money across a fleet, but it disappears inside a monthly fuel bill that moves 20% with the price of diesel. The only way to see it is to measure fuel per mile and per truck, not fuel spend in total.
The cost-per-mile maths: diesel price divided by miles per gallon
Fuel cost per mile is simply the price per gallon divided by miles per gallon. The grid below shows what that means at this year’s prices for trucks at three levels of fuel economy. The gap between columns is the value of better fuel economy; the gap between rows is the price you don’t control.
At $6.38 a gallon, moving a truck from 6.5 to 7.0 mpg saves about 7 cents a mile. Over 100,000 miles that is around 1,100 gallons and roughly $7,000 a year, for one truck. Fuel economy hasn’t become more important because trucks got worse; it is worth more because every gallon costs more.
Separate the price you pay from the fuel you use
When diesel moves 89% in a year, the monthly fuel bill tells you almost nothing about performance. A fleet can cut its fuel use and still watch spend climb. Report two numbers separately. The first is gallons per 100 miles, per truck and for the fleet: it only moves when trucks, drivers or routes change. The second is average price paid per gallon against the EIA regional average for the same week: it shows whether your buying is better or worse than the market. Multiply the two and you get fuel cost per mile, but keeping them apart lets you see which part moved and who can do something about it.
The same split makes savings honest. If a fleet’s gallons per 100 miles fall by 4% in a quarter when diesel rose 30%, the fuel programme worked, even though the bill went up. Reporting only spend would hide the result and could end the programme that produced it.
Six places fuel money leaks, and how to find each one in your data
Each leak has its own signal. Some show up in fuel card data, some in engine data, some only when you compare the two. Work through them in order: the first two are often the quickest to fix, because they need no change to how anyone drives.
Price leak
Volume leak
Idle leak
MPG drift
Distance leak
Attribution leak
A worked example: what one percent is worth for a 25-truck fleet
Take a fleet of 25 tractors, each running 100,000 miles a year at an average of 6.5 mpg, paying the late-September 2026 national average of $6.38. The numbers below are illustrative, but the method works for any fleet: replace each input with your own.
The idle figure uses Argonne National Laboratory’s estimate of about 0.8 gallons an hour for a heavy-duty truck idling. None of these numbers should be added together; idle and MPG improvements overlap, because less idling also raises measured fuel economy. Use each one to rank where to start, then measure the real result against your own baseline.
Fuel in total cost of ownership: why the cheapest gallon isn’t always the cheapest mile
Fuel decisions rarely stand alone. A cheaper fuel stop that adds miles costs more per trip. Low rolling resistance tires save fuel but may wear differently. A truck kept a year longer saves on payments but may burn more fuel and spend more days in the shop. Total cost of ownership puts these on one scale: everything a truck costs to buy, run, maintain and dispose of, divided by the miles it covers.
For fuel, the TCO view adds two questions. Is this truck’s fuel economy falling as it ages, and does that change when to replace it? And does a maintenance shortcut, such as a skipped tire check or a delayed brake job, show up later as higher fuel cost per mile? Both can only be answered when fuel and maintenance costs sit on the same unit record, side by side, by month. That is also where preventive maintenance earns its place in a fuel programme: the service that keeps a truck safe is often the same one that keeps its fuel economy where it should be.
The data you need, where it comes from, and what to measure
| Leak | Data source | Measure per truck | Review cadence |
|---|---|---|---|
| Price | Fuel card transactions | Price paid per gallon by station | Weekly while prices are volatile |
| Volume | Card transactions and tank capacity | Gallons per fill; exceptions flagged | Weekly exception list |
| Idle | Engine or telematics data | Idle hours per day | Weekly by truck and driver |
| MPG drift | Card gallons and odometer | MPG against own baseline | Monthly, with repairs alongside |
| Distance | Trip records and GPS | Planned, odometer and GPS miles | Per trip, reviewed weekly |
| Attribution | Card data matched to units | Share of fuel unassigned | Monthly; target near zero |
If you only have time for one measure, make it MPG per truck against its own baseline. It catches mechanical problems, driving changes and fuel card problems at once, because all three show up as a truck that suddenly needs more gallons for the same miles.
A fuel audit in four weeks, without buying anything new
Keep the audit honest by reviewing exceptions with the people closest to them. A fill above tank size can be a data entry error, a reefer fill on the wrong card, or theft, and only the driver or dispatcher can usually say which. Treat each exception as a question first, and only as a problem once it is confirmed.
The audit usually finds that the fleet’s fuel problem is narrower than it looked: a handful of trucks, drivers, stations or routes account for much of the avoidable spend. That makes the fix cheaper too. A truck with dragging brakes needs a repair, not a fleet-wide coaching programme.
Fuel, maintenance and inspections on one record, so cost per mile is a number you can trust
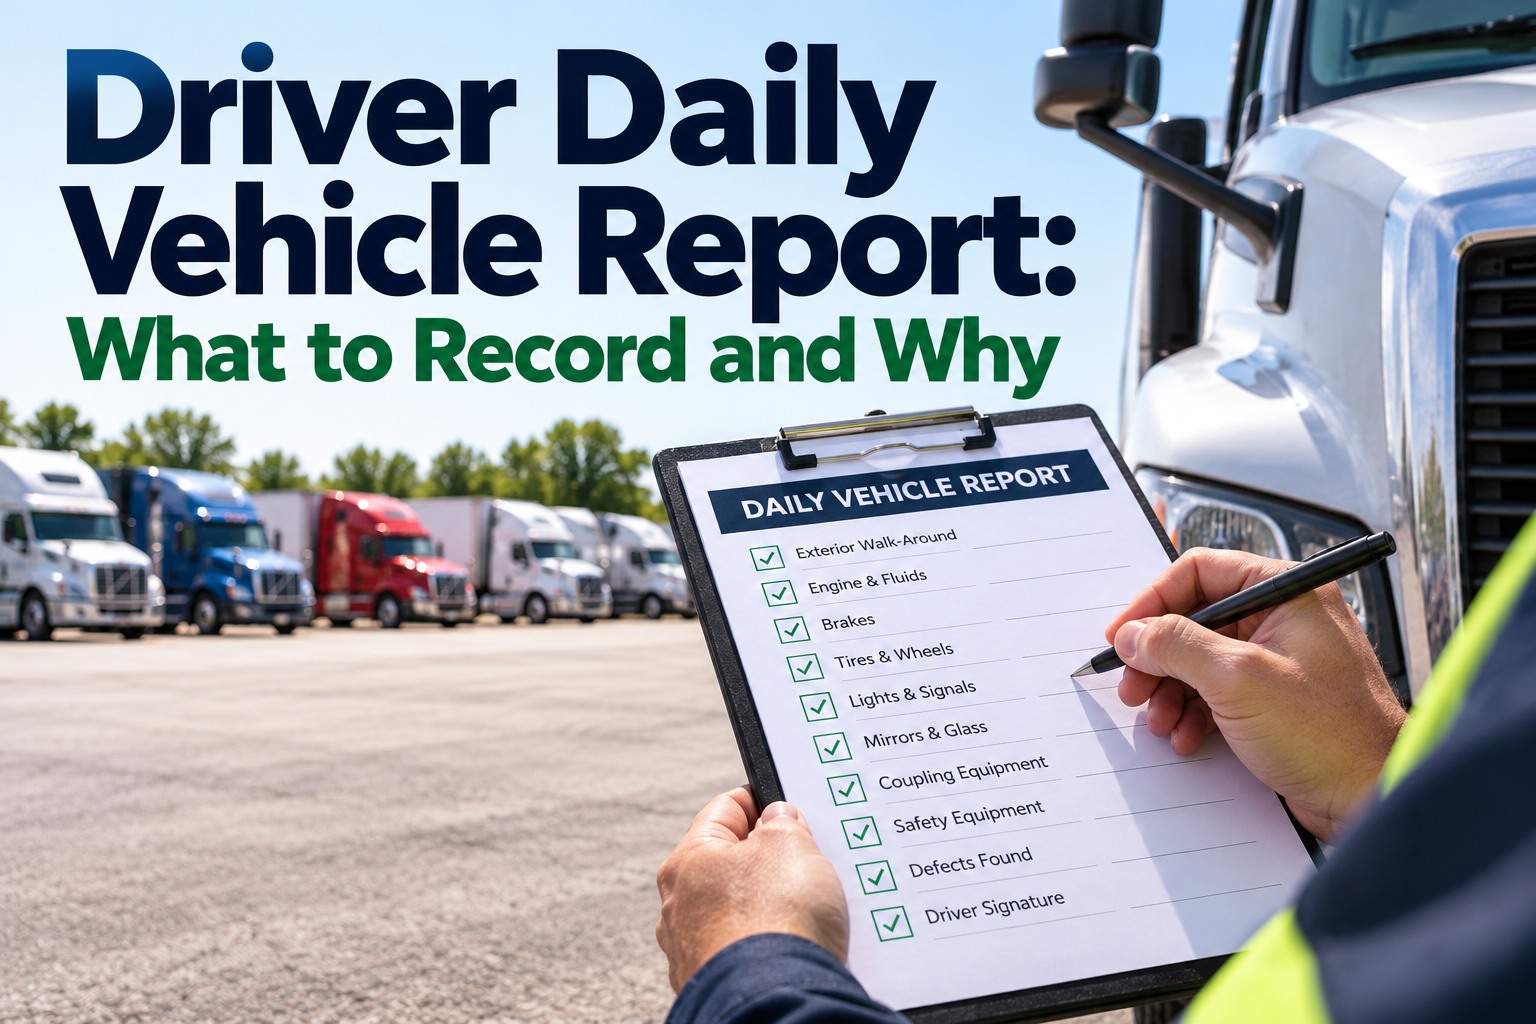
Fuel economy problems often start as inspection findings. Low tire pressure, air leaks and dragging brakes are all things a driver can report on a digital DVIR, and the repair that follows belongs in fleet maintenance records alongside the fuel it saves.