Right now, across your fleet, engines are running. Not moving — just running. Parked outside customer sites, warming up in the depot yard, sitting in traffic with the AC on full blast. Every one of those minutes costs you roughly $0.013 in diesel for a light commercial vehicle, $0.019 for a medium truck. Doesn't sound like much. Multiply it by 15 drivers, 45 minutes of idle each, 250 working days a year — and you have just burned $26,000 in fuel that moved nothing, delivered nothing, and helped nobody. That money is already gone. The only question is whether next year looks the same. Book a free demo to see your fleet's idle cost broken down live.
Idle time is the single fastest-payback problem in fleet management — because it costs real money, it is 100% preventable, and fixing it requires zero new vehicles or routes. FleetRabbit's idle monitoring shows you exactly which vehicle, which driver, and which location is burning your fuel budget, then gives you the alerts and reports to stop it.
How Much Is Your Fleet Burning Right Now? — The Idle Cost Calculator
Most fleet managers guess at their idle cost. Here is the actual math, broken down so you can calculate your fleet's exact annual loss in under a minute. Start free and see your real numbers within 24 hours.
Where Is Your Engine Actually Running? — Idle by Location Type
Not all idle time looks the same. The first thing FleetRabbit's idle monitoring reveals is not just how long vehicles idle — it is where. That distinction changes everything about how you fix it. Schedule a demo to see your fleet's idle breakdown by location.
Drivers waiting for loading/unloading with engine on. Often fixable with arrival coordination and engine-off policies. Highest single source in most fleets.
Warming up before departure or end-of-shift engine left running. Modern engines need under 30 seconds warm-up. Most of this is entirely avoidable.
Stop-start traffic and level crossings. Partially unavoidable but driver coaching on unnecessary AC and elevated idle can cut this by 30%.
Drivers keeping cab climate control running during breaks. Policies with enforcement and APU consideration can reduce this significantly at low cost.
A logistics operator running 18 vehicles plugged in FleetRabbit and ran their first seven-day idle report. Three drivers accounted for 61% of all idle time. Two were consistently idling at a single customer site for an average of 52 minutes per visit. One was leaving the engine running through every break. Before monitoring, the manager assumed idle was spread evenly across the fleet. The data showed three targeted conversations would solve most of the problem. Total savings identified in week one: $9,200 per year.
The Real Cost Stack — It Is Not Just Fuel
Fleet managers who calculate idle cost only in fuel are underestimating the total damage by roughly 40%. Idle time creates a layered cost that compounds across maintenance, emissions compliance, and engine life. Sign up free and start tracking your full idle cost today.
See Your Fleet's Idle Cost in Real Time
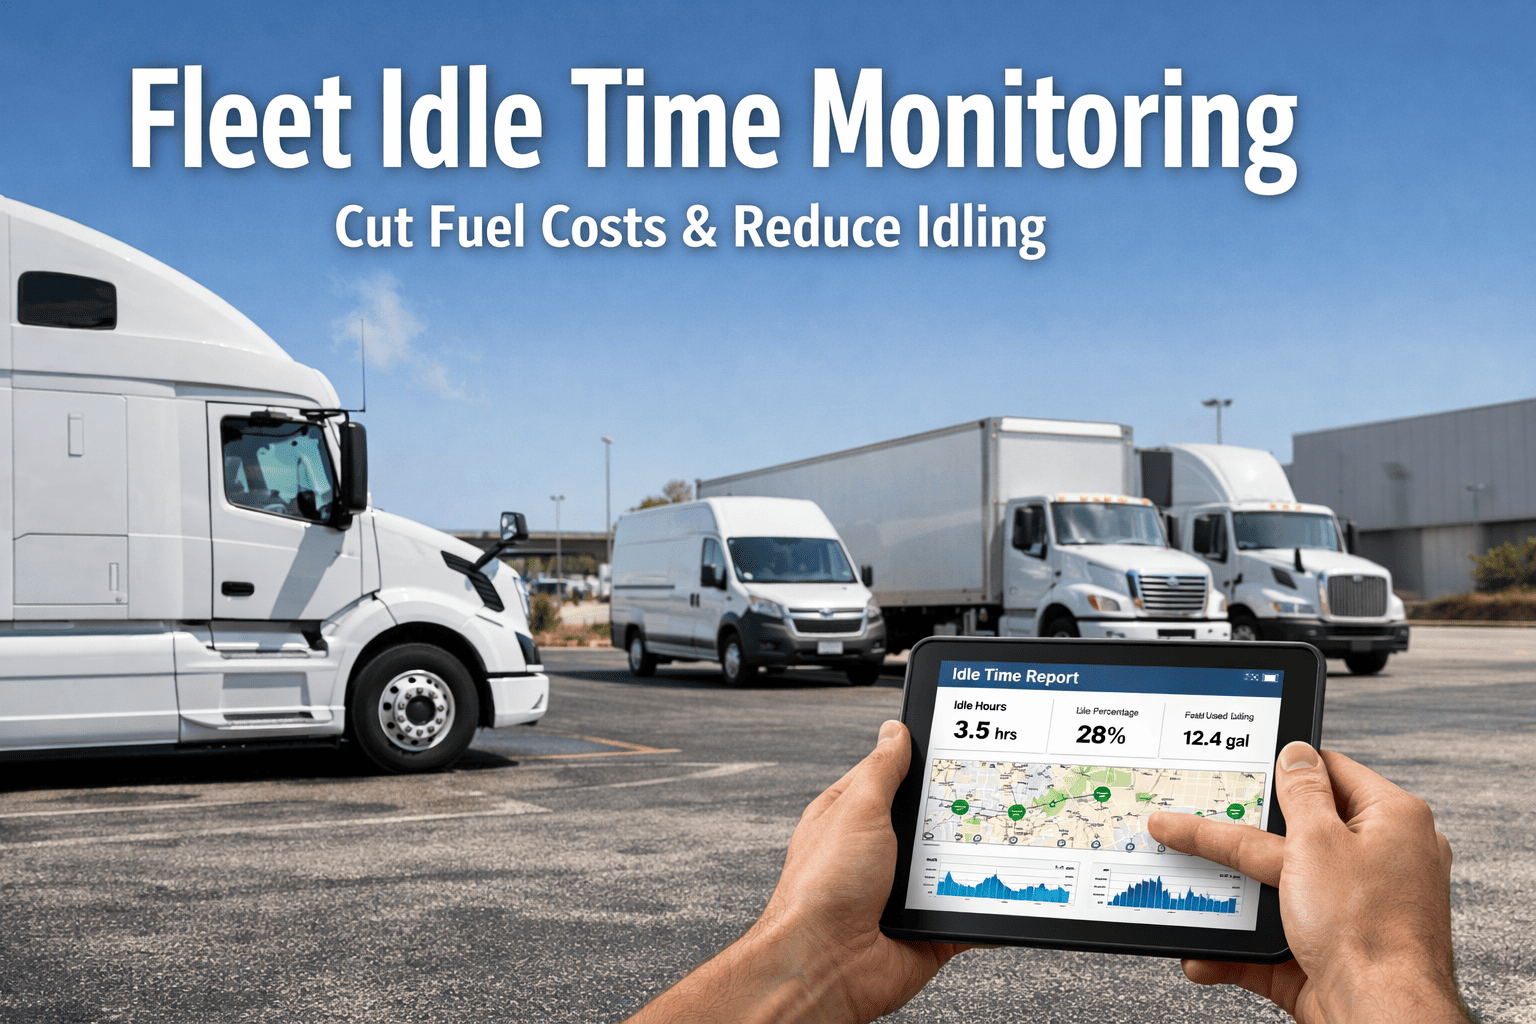
FleetRabbit's idle monitoring dashboard shows every vehicle's idle time live — broken down by driver, location, time of day, and shift. Fleet managers typically identify $8,000 to $22,000 in recoverable annual costs within the first week of monitoring. Our 30-minute demo is customised to your fleet size and vehicle mix, so you see exactly what your idle report would look like before you commit to anything. No credit card, no setup fees, no contracts — just real data from your real fleet.
How FleetRabbit Idle Monitoring Actually Works
The system does not just log idle events — it contextualises them, alerts in real time, and generates the reports that turn awareness into action. Here is the complete feature breakdown. Book a demo to see the idle alert dashboard live.
The moment a vehicle exceeds your configured idle threshold — whether that is 5 minutes, 10 minutes, or a custom rule for specific locations — FleetRabbit fires an alert to your dashboard, your phone, and optionally the driver. You choose who gets notified, at what threshold, and through which channel. The alert includes the vehicle ID, current location on a map, duration of idle so far, and estimated fuel cost at that moment. No waiting for end-of-day reports. No discovering yesterday's problem this morning.
Every Monday morning, FleetRabbit auto-generates your fleet's idle report — ranking drivers by total idle time, flagging the top five locations where idle consistently happens, and calculating the exact fuel cost per vehicle over the past seven days. The report is one page. You can read it in two minutes and know exactly where to coach first. Export to PDF for insurance submissions, compliance documentation, or fleet performance reviews.
Draw a geofence around your depot, a customer site, or a city-centre zone and set a different idle rule for each one. A vehicle at a loading dock gets a 15-minute grace window. A vehicle parked on a residential street gets a 3-minute alert. Compliance zones in US cities with anti-idle ordinances get a zero-tolerance rule with immediate notification. The system applies the right policy to the right location automatically — no driver guesswork, no manual enforcement.
Before and After: A Fleet Manager's First 90 Days
The idle reduction journey follows a consistent pattern across fleets of every size. Here is what typically happens — and the numbers that come with it.
Your Fleet's Idle Cost Is Calculable — Let Us Show You the Number
Most fleet managers are shocked when they see their actual annual idle cost broken down by driver and location. FleetRabbit generates that report in your first 24 hours of monitoring. Our demo takes 30 minutes — we bring your fleet size, vehicle types, and current fuel rates, and show you exactly what your idle report would look like, what alerts would have fired last week, and what the savings projection is for your specific operation. Book today and see real numbers, not generic estimates, before you make any decision.
Frequently Asked Questions
FleetRabbit lets you set custom idle thresholds per vehicle class, location type, and operational context. The default starting point is 5 minutes of stationary engine-on time for on-road vehicles — industry standard for most commercial applications. Loading dock situations typically get a 15-minute grace period. You can also set zero-tolerance rules for specific geofenced areas in cities with anti-idle ordinances. The threshold is not one-size-fits-all because idle tolerance genuinely varies by operation — a refrigerated vehicle has different needs than a dry freight van. FleetRabbit's configuration takes 10 minutes to set up correctly.
FleetRabbit's plug-and-play OBD-II adapter provides idle monitoring for any commercial vehicle built after 1996 without any existing telematics hardware. It plugs into the diagnostic port under the dashboard — no wiring, no downtime, no installer. For vehicles that already have a telematics device, FleetRabbit integrates with existing hardware from Geotab, Samsara, Motive, and others, so you do not need to replace anything. Idle data is visible in FleetRabbit's dashboard regardless of which hardware source it comes from.
Yes — and this is one of the most important distinctions in idle reporting. Vehicle-level idle data tells you a truck idled. Driver-level data tells you why and who to coach. FleetRabbit links idle events to driver profiles through shift scheduling and driver login. When the same vehicle has very different idle behaviour on different shifts, the system surfaces that immediately — you see which driver is responsible, not just which vehicle was running. This makes coaching conversations specific and fair rather than vehicle-based guesswork.
Some will initially, particularly around cab climate control during breaks. The most effective approach is transparent introduction — sharing the data with drivers, explaining the cost per event, and framing the policy around fuel savings and engine longevity rather than surveillance. Fleets that introduce idle monitoring alongside an incentive (sharing a portion of fuel savings with drivers who hit idle targets) see the fastest behaviour change and the least resistance. FleetRabbit includes a driver-facing app so each driver can see their own idle stats in real time — which typically reduces idle faster than manager-only visibility. See how the driver app works in a live demo.
Over 30 US states and dozens of municipalities have anti-idling regulations — typically limiting commercial vehicle idle to 3 to 5 minutes in urban or residential areas, with fines ranging from $250 to $25,000 per violation. FleetRabbit maps known compliance zones and automatically applies tighter alert thresholds when a vehicle enters them, so your drivers get notified before a violation occurs rather than after. The system also generates compliance documentation showing idle behaviour history by location — useful if you ever need to demonstrate good-faith compliance efforts to an enforcement agency.
Book a Demo — See Your Fleet's Idle Cost Broken Down Live
FleetRabbit's idle monitoring dashboard shows every vehicle, every driver, and every location where your fleet is burning fuel unnecessarily — updated in real time, with alerts that fire before the cost accumulates. In a 30-minute personalised demo, we calculate your fleet's actual annual idle cost using your vehicle mix and current fuel rates, show you what a live idle alert looks like on the dashboard, walk through a sample weekly idle report with driver coaching recommendations, and demonstrate the geofenced policy tool so you can set location-specific rules from day one. No commitment required. Free for up to 3 vehicles. Most fleet managers see a clear ROI case before the demo is even over.