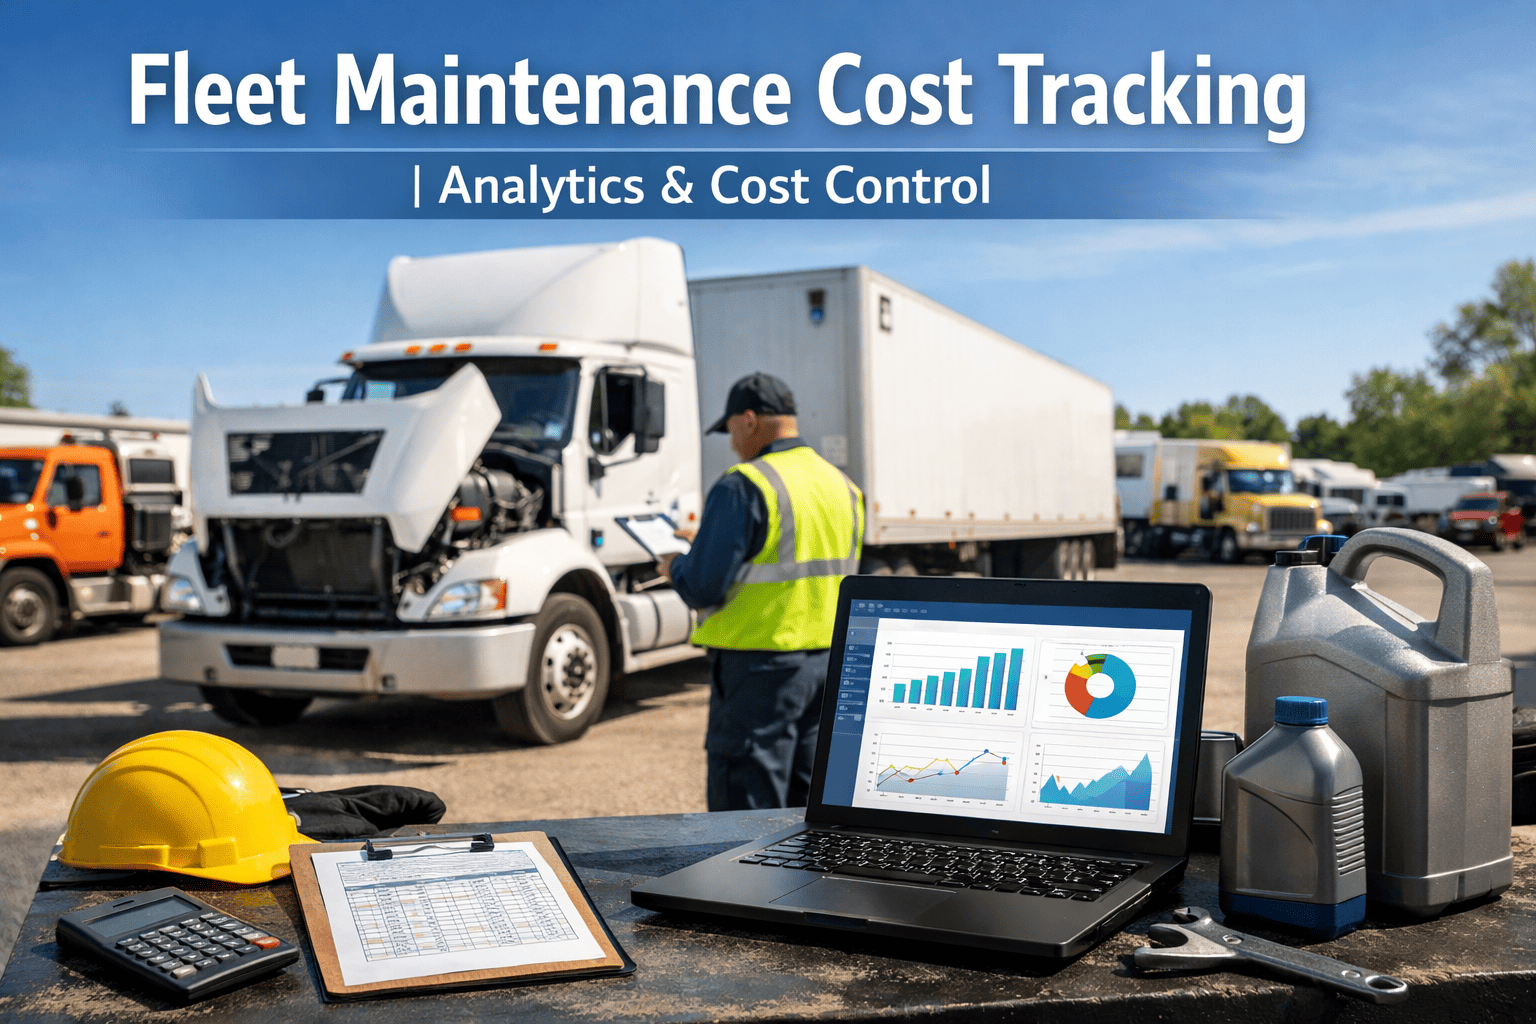
Most fleet managers know their total maintenance budget. Almost none know which specific vehicles are eating it, which repair categories are spiralling, or which vendor has been overbilling for months. That gap between what you spend and what you understand is where profit quietly disappears. FleetRabbit closes that gap completely.
You're Losing Up to 25% of Your Maintenance Budget Every Year.
You Just Can't See Where.
FleetRabbit gives you real-time cost per vehicle, per mile, and per repair type — so you can cut maintenance spend by 32% without guessing.
No credit card · Free for 3 vehicles · No contract
per heavy-duty truck (2026)
Where Your Maintenance Budget Actually Disappears
Four invisible leaks account for 80%+ of maintenance overspend in untracked fleets. Every one is preventable — once you can see it.
Reactive repairs cost 3–9× more than planned maintenance per event. Plus emergency parts at 3–5× standard pricing. Plus $448–$760/day in lost productivity per vehicle.
Fleet averages hide individual drain. The most expensive truck in a 50-vehicle fleet typically costs 4–6× the fleet average — and most managers cannot name it.
Without invoice cross-referencing, vendors charge for parts not used, labour not performed, and rates that quietly drift. Fleets with data negotiate 12–18% better rates.
CPM is the only true apples-to-apples metric across vehicles. A truck at $0.75/mile is worse than one at $0.50/mile — even if it costs less in total. Most fleets never calculate it.
What Smart Fleets Do Differently
Your Cost Dashboard — Every Vehicle, Every Dollar, Live
This is what your fleet's financial health looks like when every work order feeds a live dashboard automatically. Start free to see your dashboard today.
What 90 Days of Cost Tracking Delivers
What Would You Like to Track?
FleetRabbit tracks all of these simultaneously — automatically, from your existing work orders and telematics. No manual calculation. No spreadsheets.
Before & After — A Real Scenario
2026 Cost Benchmarks — How Does Your Fleet Compare?
Industry data shows a dramatic spread between top-performing and average fleets. Cost per mile ranges from $0.20 to $1.10 depending on vehicle age and maintenance strategy — a gap representing $18,000 to $45,000 per vehicle annually. Where does your fleet sit?
The 6 Cost Metrics Every Fleet Manager Should Be Tracking — But Most Aren't
If you can calculate all 6 of these from your current system, you have strong cost visibility. If you cannot — you are managing blind. FleetRabbit calculates all 6 automatically from your work order data. Sign up free and see your metrics today.
The single most important fleet metric. Normalises spending across vehicles with different usage patterns — the only true comparison. A vehicle at $0.75/mile is worse than one at $0.50/mile even if it costs less in total. Track monthly per vehicle. Rising CPM is the earliest warning signal of a replacement decision or PM failure.
Every 10% shift toward planned maintenance reduces costs because reactive repairs cost 3–9× more per event. The industry target is 80:20 planned-to-reactive. Average fleets run closer to 50:50. This single ratio, tracked monthly, reveals whether your PM programme is actually preventing failures or just generating paperwork.
The leading indicator of future reactive spend. A vehicle with 60% PM compliance is systematically missing service intervals — accumulating wear that will become an expensive reactive repair in 60–90 days. Fleets targeting 95%+ compliance see the largest reduction in unplanned downtime. Track per vehicle, per driver, and per shop.
The replacement timing indicator. When a vehicle's annual maintenance cost exceeds 40–45% of its current market value, replacement typically delivers better economics than continued operation — accounting for slower depreciation on older assets. Without this calculation per vehicle, you make replacement decisions based on odometer readings and gut feel rather than financial reality.
MTBF trending downward on a specific vehicle signals increasing mechanical unreliability — a leading indicator that major component failure is approaching. Comparing MTBF across identical vehicles in your fleet exposes the outliers that need investigation. If two identical trucks have wildly different MTBF, the one with lower MTBF either has a route problem, a driver behaviour issue, or a PM process failure.
Emergency parts orders carry 3–5× standard pricing due to expedited shipping, overnight delivery, and premium sourcing. A fleet with 20% of parts spend in emergency orders is systematically destroying its parts budget through poor PM compliance. Tracking this ratio per vehicle and per repair category identifies exactly where your PM programme is failing to prevent emergency sourcing scenarios.
Start Reducing Costs Today — Not Next Quarter
Import your last 3 months of maintenance records during the demo. We'll identify your highest-cost vehicles, your biggest leak categories, and your estimated annual saving — before the session ends.
No credit card · Free for 3 vehicles · No contract · Cancel anytime
Frequently Asked Questions
Most fleets identify their highest-cost vehicles in week one. By month one, vendor invoice cross-checking typically recovers overcharges. The 32% cost reduction benchmark is usually achieved within 6 months. FleetRabbit pays for itself within 30–90 days for most fleets based on avoided reactive repair costs alone. Book a demo to get a savings estimate for your fleet size.
A vehicle list, odometer readings, and 3 months of maintenance receipts or work orders. FleetRabbit imports from CSV, existing CMMS exports, or manual upload. During the onboarding session, we build your cost baseline from historical data — so your first dashboard shows trends, not a blank slate from today. Sign up free and start importing today.
FleetRabbit pulls total maintenance cost from all closed work orders — parts, labour, and vendor invoices — and divides by odometer mileage at each service. CPM updates automatically every time a work order closes. A vehicle rising 25%+ above fleet average CPM triggers an automatic alert — the earliest signal of a replacement threshold or PM failure.
FleetRabbit connects to 200+ telematics and ELD providers and integrates with accounting platforms and ERP systems via API. See how FleetRabbit AI Document Processing automatically extracts data from maintenance receipts and vendor invoices — feeding your cost dashboard with zero manual entry.
Every maintenance receipt processed by FleetRabbit updates vehicle cost history — which feeds the predictive maintenance engine. Vehicles approaching high-cost failure patterns trigger PM alerts 14–30 days in advance. See how FleetRabbit AI Predictive Maintenance uses cost and repair data together to prevent the breakdowns that drive your reactive spend ratio.







