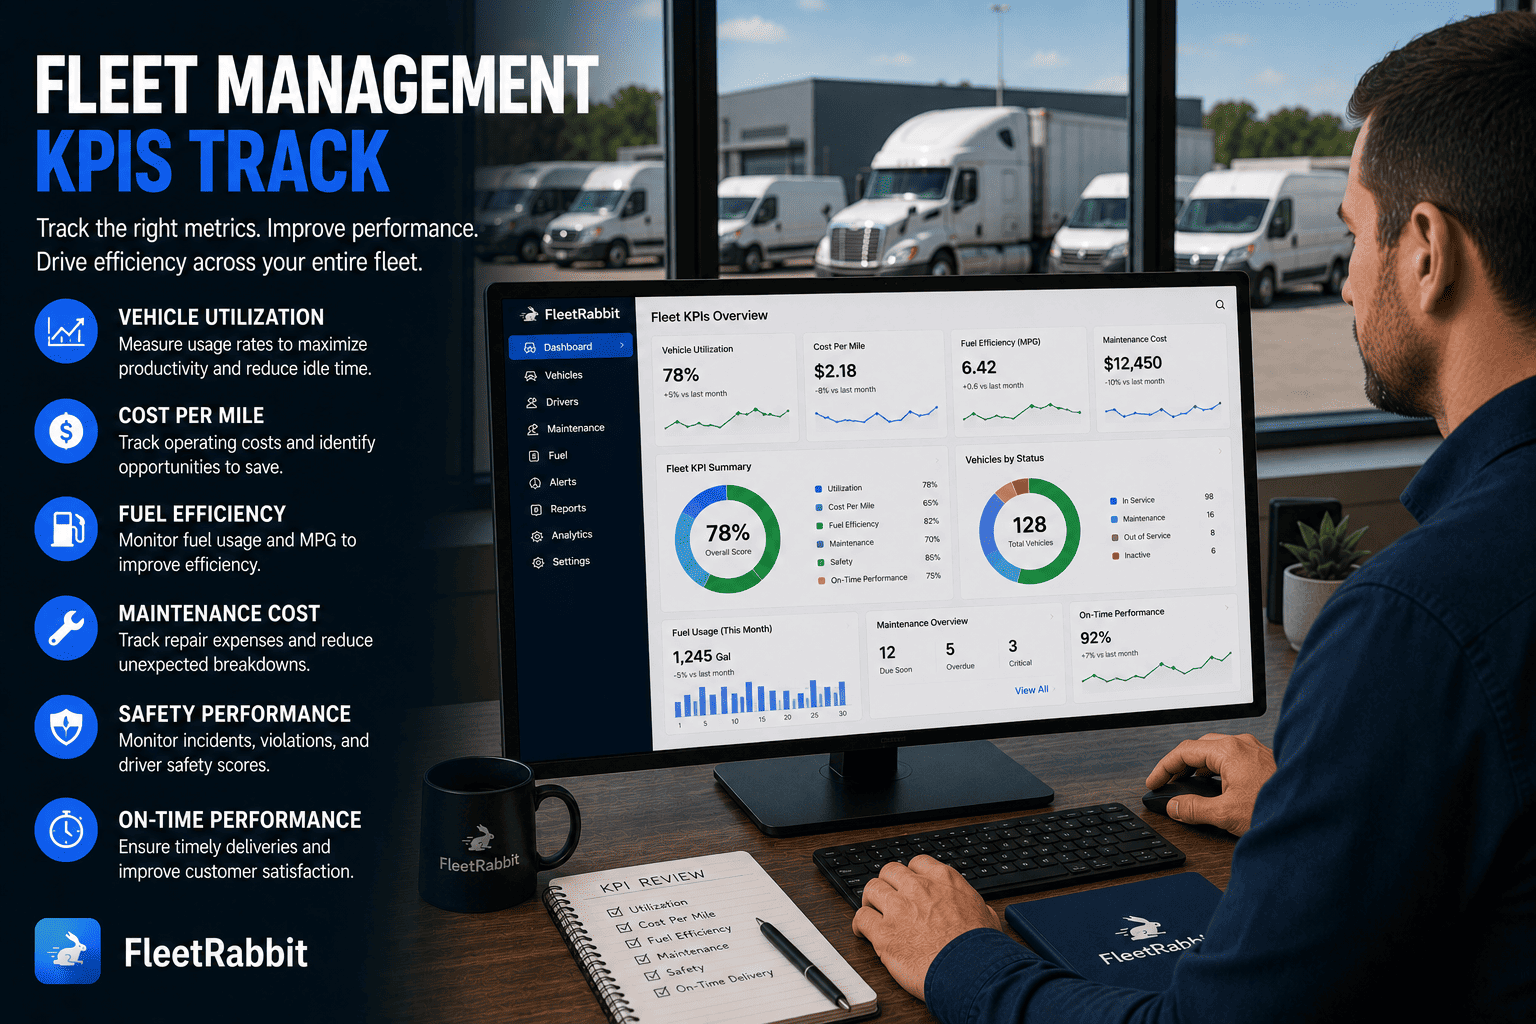
Tracking the wrong fleet metrics wastes time and obscures what actually drives profitability. Many fleets monitor dozens of KPIs but miss the few that truly impact costs, safety, and customer satisfaction. The solution is focusing on actionable metrics: cost per mile, vehicle utilization, fuel efficiency, and on-time performance. Fleet Rabbit's dashboard surfaces these critical KPIs in real-time, with benchmarking data and trend analysis to guide smarter decisions. Get clarity on your fleet's performance in just 14 days, with insights that directly improve your bottom line. Book a demo to discover which KPIs matter most for your operation.
Fleet Management KPIs Track
Measure what matters and drive operational efficiency with data that drives decisions
Fleet Rabbit KPI Tracking That Matters
Track total operating costs divided by miles driven to identify inefficient vehicles, routes, or drivers and target improvements.
Monitor asset usage patterns to right-size your fleet, reduce idle capacity, and maximize return on every vehicle investment.
Measure MPG trends across vehicles and drivers, with alerts for anomalies that signal maintenance needs or coaching opportunities.
Compare planned vs. emergency repair costs, track parts/labor expenses, and forecast future maintenance budgets with precision.
Aggregate safety, efficiency, and compliance metrics into simple scores that guide coaching and incentive programs.
Measure schedule adherence, identify recurring delay causes, and improve customer satisfaction through data-driven routing.
Common Problems and Solutions
Problem: Tracking Too Many Vanity Metrics
Fleets often monitor dozens of KPIs that look impressive but don't drive actionable decisions, creating analysis paralysis.
Fleet Rabbit SolutionWe focus on 6-8 high-impact KPIs proven to reduce costs and improve performance. Custom dashboards surface what matters most for your operation.
Book Demo to See KPIsProblem: Data Silos Preventing Insights
Fuel cards, telematics, maintenance logs, and dispatch systems store data separately, making holistic analysis impossible.
Fleet Rabbit SolutionUnified platform integrates all data sources into one dashboard, enabling cross-metric analysis like fuel cost per mile or maintenance impact on utilization.
Book Demo for Unified DataProblem: Reactive vs. Proactive Decision Making
Without trend analysis and benchmarking, managers react to problems after they occur instead of preventing them.
Fleet Rabbit SolutionReal-time dashboards with historical trends and industry benchmarks help you spot issues early and act before costs escalate.
Book Demo for Proactive InsightsProblem: Lack of Benchmarking Context
Knowing your cost per mile is $0.65 means little without knowing if that's good, average, or poor for your vehicle class and region.
Fleet Rabbit SolutionAnonymous industry benchmarking shows how your KPIs compare to similar fleets, highlighting improvement opportunities with data-backed targets.
Book Demo for BenchmarkingFleet Rabbit vs. Competitors
| Capability | Fleet Rabbit | Fleetio | Fleetx | Samsara | Verizon Connect | Geotab |
|---|---|---|---|---|---|---|
| Cost Per Mile Tracking | Yes | Yes | Partial | Yes | Partial | Partial |
| Utilization Analytics | Yes | Limited | No | Yes | Partial | Partial |
| Industry Benchmarking | Yes | No | No | No | No | No |
| Custom KPI Dashboards | Yes | Limited | Limited | Yes | Partial | Partial |
| Free Trial | Yes | Yes | Limited | No | No | No |
| Deployment Time | 14 days | Days | Weeks | Weeks | Weeks | Weeks |
| Pricing | $5/vehicle/month | $4-7/month | $8-12/month | $25-40/month | $20-35/month | $20-30/month |
Deployment Roadmap
Fleet Rabbit deploys in 14 days with no disruption to your operations. Here's how the KPI tracking rollout works:
Compliance and Regulations
Fleet Rabbit meets regulatory requirements for performance reporting and data privacy across all your operating regions:
| Region | Key Reporting Requirements | Fleet Rabbit Support |
|---|---|---|
| United States | FMCSA safety metrics, IFTA fuel reporting, ELD compliance logs, state tax documentation | Full Support |
| United Kingdom | DVSA operator licensing metrics, tachograph data, emissions reporting, GDPR data protection | Full Support |
| Canada | Transport Canada safety metrics, provincial fuel tax reporting, cross-border compliance documentation | Full Support |
| UAE | RTA fleet performance standards, commercial vehicle inspection records, regional tax compliance | Full Support |
| Australia | NHVAS performance reporting, heavy vehicle national law compliance, state-based fuel tax documentation | Full Support |
| South Africa | National Road Traffic Act reporting, commercial vehicle safety metrics, cross-border operational documentation | Full Support |
Real-World Use Cases
Case Study 1: Regional Delivery Fleet
Case Study 2: Construction Equipment Fleet
Case Study 3: Mixed-Fleet UAE Operator
Frequently Asked Questions
Start with cost per mile, vehicle utilization, and fuel efficiency—these three metrics directly impact profitability for most fleets. Fleet Rabbit's onboarding helps you prioritize based on your specific business goals. Book a demo to build your custom KPI roadmap.
Fleet Rabbit includes anonymous industry benchmarking so you can compare your cost per mile, utilization rates, and other metrics against similar fleets in your region and vehicle class. Context turns data into decisions.
Yes. Fleet Rabbit connects to fuel cards, telematics providers, maintenance systems, and dispatch platforms via REST API. We confirm integration details during onboarding and complete setup within 14 days. Book a demo to review your tech stack.
Executive dashboards update daily for strategic decisions, while operational alerts trigger in real-time for immediate action. Fleet Rabbit's mobile app lets managers monitor critical metrics anywhere. Start free trial to test alert workflows.
Fleet Rabbit supports custom KPI creation with drag-and-drop dashboard building. Define your own formulas, thresholds, and visualizations to track what matters most for your operation. Book a demo to design your custom metrics.