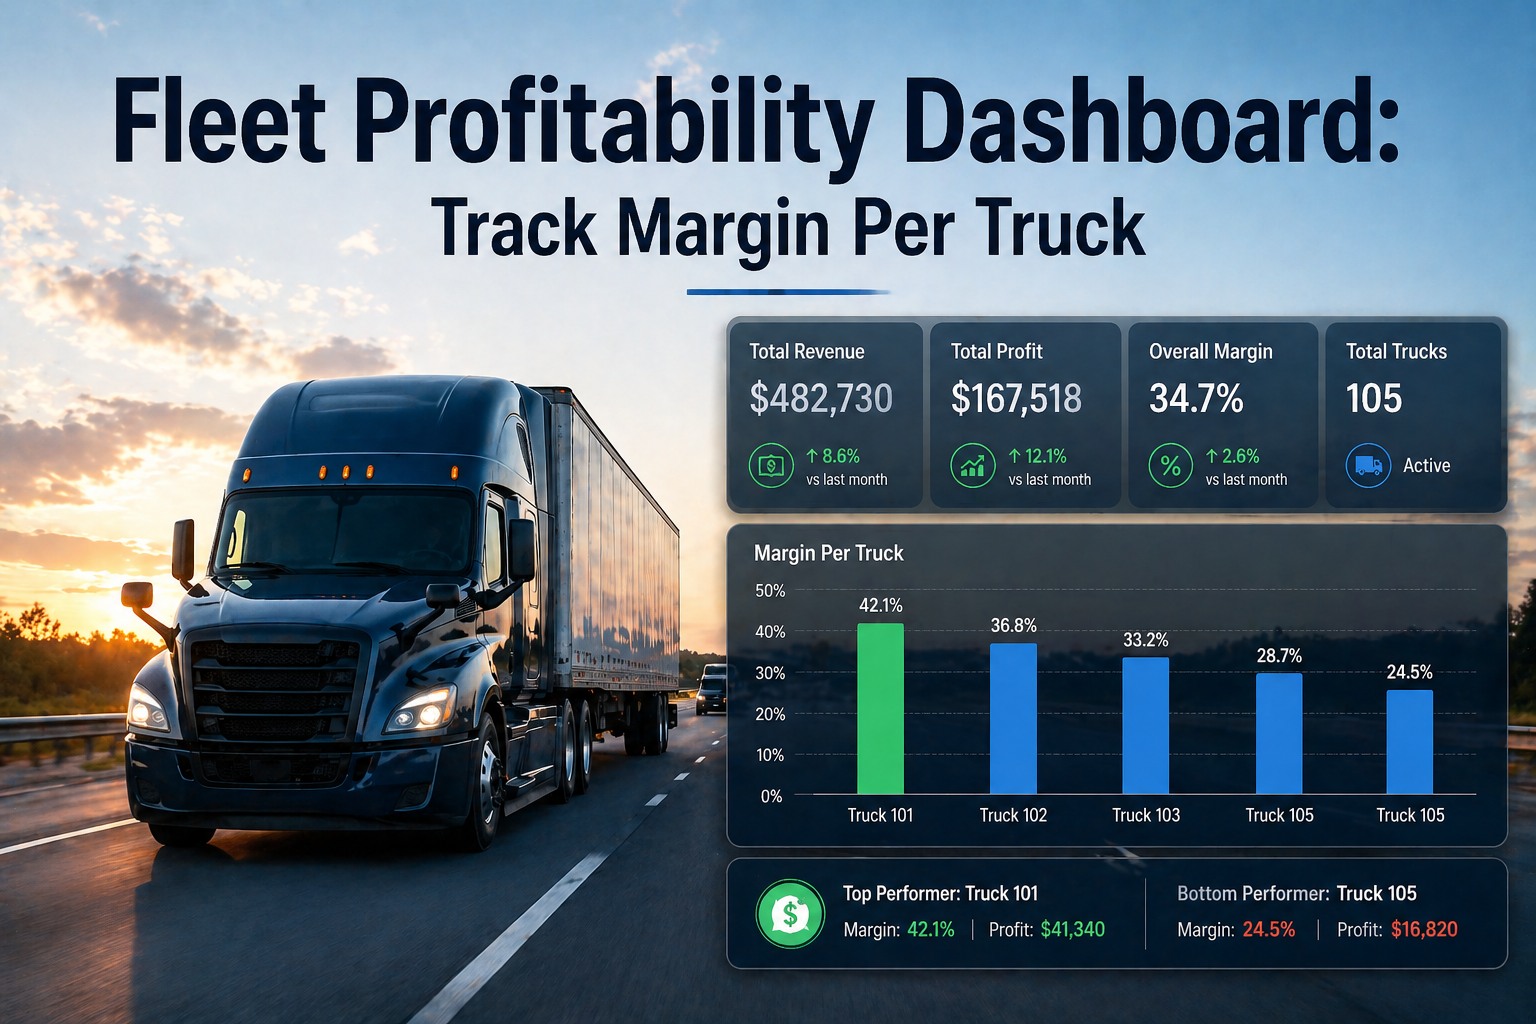
Ask any trucking owner which of their 20 trucks made money last quarter. Most can't answer. They know fleet-level revenue. They know fleet-level cost. They don't know that Truck #014 lost $2,400 last month while Truck #007 made $9,800 — because nobody breaks the numbers down per asset, per route, per driver, per load. The result: bad trucks stay in service, profitable lanes get under-allocated, unprofitable customers get the same priority as your best ones. With trucking margins at 2-8%, you can't afford that blind spot. Fleet Rabbit's Profitability Dashboard pulls revenue from your TMS, costs from fuel cards, maintenance, insurance, and driver pay, and shows you exactly which trucks, routes, drivers, and customers are making money — and which ones are quietly bleeding it.
Stop Guessing Which Trucks Make Money. Know.
Trucking margins run 2-8%. Every unprofitable truck, route, or customer eats the thin profit your good ones generate. Fleet Rabbit pulls revenue, fuel, maintenance, driver pay, and insurance into one dashboard showing margin per vehicle, per route, per driver, per customer. Real data, real-time.
Quick Overview — How Profitability Tracking Works
| What gets tracked? | Revenue, fuel, maintenance, driver pay, insurance, tolls, IFTA, depreciation — per vehicle, route, driver, customer. |
| Where does data come from? | TMS (revenue), fuel cards, maintenance records, payroll, ELD/telematics. Auto-synced — no manual entry. |
| How fresh is it? | Revenue updates daily. Fuel and maintenance update real-time. Margin recalculates within 30 minutes. |
| Who can see what? | Role-based. CFO sees full P&L. Ops managers see operational margin. Drivers see their own performance only. |
| Can I export to QuickBooks? | Yes. One-click export to QuickBooks, Xero, NetSuite, or CSV. Monthly P&L runs automatically. |
| What about the API? | REST API exposes all profitability data for custom dashboards, BI tools, or accounting integrations. |
The Profitability Formula — Where Margin Actually Comes From
Profit per truck = Revenue per truck − All cost categories per truck. The platform breaks costs into 8 categories and ties every dollar to a specific asset.
The 8 Cost Categories That Eat Your Margin
| Cost Category | Typical % of Total | Source |
|---|---|---|
| Fuel | 25-30% | Fuel card integration (TCH, EFS, Comdata, WEX) |
| Driver Pay | 25-32% | Payroll system + ELD hours |
| Maintenance & Repairs | 10-15% | Work order system + parts inventory |
| Insurance | 8-12% | Premium allocations from accounting |
| Equipment / Depreciation | 10-15% | Asset register + lease/loan schedules |
| Tolls & Permits | 3-6% | GPS-based toll capture + IRP/IFTA |
| IFTA Fuel Tax | 2-4% | Quarterly returns auto-calculated |
| Other (devices, dispatch, admin) | 2-5% | GL entries tagged to vehicles |
Per-Vehicle Profitability — What the Dashboard Shows
Sample 30-day output for a 10-truck fleet. The dashboard ranks every asset, flags loss-makers in red, highlights top performers in green, and surfaces the patterns hiding in fleet-level averages.
| Truck | Revenue | Cost | Profit | Margin | Status |
|---|---|---|---|---|---|
| #007 | $28,400 | $18,600 | +$9,800 | 34.5% | TOP |
| #011 | $26,200 | $18,900 | +$7,300 | 27.9% | PROFIT |
| #003 | $24,800 | $19,400 | +$5,400 | 21.8% | PROFIT |
| #001 | $23,100 | $18,700 | +$4,400 | 19.0% | PROFIT |
| #019 | $22,400 | $19,100 | +$3,300 | 14.7% | PROFIT |
| #005 | $21,800 | $20,200 | +$1,600 | 7.3% | THIN |
| #022 | $19,400 | $19,100 | +$300 | 1.5% | BREAK-EVEN |
| #015 | $20,100 | $20,800 | −$700 | −3.5% | LOSS |
| #014 | $18,300 | $20,700 | −$2,400 | −13.1% | LOSS |
| #008 | $15,200 | $19,400 | −$4,200 | −27.6% | REVIEW |
| FLEET TOTAL | $219,700 | $194,900 | +$24,800 | 11.3% | — |
The fleet looks healthy at 11.3% margin. But 3 trucks are losing money — together costing $7,300/month. Without per-asset visibility, that's invisible. See Your Fleet's Per-Truck P&L Live →
Per-Route Profitability — Which Lanes Actually Pay
Same logic, different cut. Routes that look great on revenue often lose money once deadhead miles, fuel cost spikes, and tolls are factored in.
| Route | Revenue / Mile | Cost / Mile | Profit / Mile | Margin |
|---|---|---|---|---|
| Dallas → Atlanta | $2.85 | $1.92 | +$0.93 | 32.6% |
| Houston → Phoenix | $2.40 | $1.88 | +$0.52 | 21.7% |
| Chicago → Memphis | $2.10 | $1.95 | +$0.15 | 7.1% |
| Denver → Salt Lake | $1.85 | $1.94 | −$0.09 | −4.9% |
| Seattle → Boise (deadhead heavy) | $1.65 | $1.98 | −$0.33 | −20.0% |
The 5 Hidden Margin Killers Most Fleets Miss
Empty backhauls cost full operating expense without revenue. A 30% deadhead ratio drops effective margin by 4-6 points instantly.
Idling burns ~0.8 gal/hr. A truck idling 4 hrs/day at $4.10/gal = $3,200/year per truck — pure margin loss.
Driver waits 3 hours at a dock. Without detention billing, that's $90 in driver pay and $50 in equipment time gone.
Emergency repairs cost 4-5× planned PM. One missed PM cascades into roadside breakdown, towing, lost revenue day.
A truck with rising maintenance + lower utilization can quietly lose more than it earns. Per-asset margin reveals exactly when to replace.
What to Do With the Data — 4 Actions That Move Margin
Shift trucks from low-margin routes to high-margin ones. A 10% reallocation toward your top-margin lanes typically lifts fleet profit 8-12%.
Customers below margin threshold get rate increases or get dropped. Most carriers find 15-25% of their customer book runs at a loss.
When per-truck margin trends negative for 3+ months and maintenance trends up, the math says replace. Profitability dashboard makes that math automatic.
Same lane, two drivers. One generates 18% margin, the other 6%. Idle time, fuel economy, and detention behavior explain most of the gap. Coachable.
Frequently Asked Questions
How long until I see accurate per-truck margins?
Initial margins appear within the first week of data sync. Reliable per-truck and per-route accuracy typically reaches confidence after 30 days as the system normalizes seasonal variance, customer mix, and route patterns. Historical data import (12 months back) accelerates this — most fleets have meaningful insight on day one.
What if my TMS doesn't have an API?
Fleet Rabbit imports revenue from CSV, Excel, or direct integrations with major TMS platforms (McLeod, TMW, Aurora, Axon, ProTransport, Q7). For non-integrated TMS, scheduled CSV import runs daily. The API direction also works — Fleet Rabbit's REST API exposes all profitability data for custom dashboards or BI tools. See TMS Integration Options →
Can I see profitability per customer?
Yes. Same logic applies: revenue per customer minus allocated costs (fuel, driver pay, equipment, maintenance proportional to load count) = profit per customer. Most carriers find 15-25% of their customer book is unprofitable and don't realize it without per-customer breakdown.
How are shared costs allocated to specific trucks?
Direct costs (fuel for that truck, driver assigned to it, maintenance work orders) tie directly. Shared costs (insurance premium, dispatch overhead, admin) allocate by mileage, revenue share, or even split — configurable per fleet. The allocation method shows in the dashboard so the math is transparent and adjustable.
Does this replace my accounting software?
No — it complements it. QuickBooks, Xero, and NetSuite remain your books of record. Fleet Rabbit's Profitability Dashboard pulls real-time operational data those systems don't capture (fuel-card transactions, maintenance work orders, ELD-driven driver hours) and pushes summary P&L back. Auditors get clean books; you get live operating margin. See QuickBooks Integration →
How is Profitability Dashboard priced?
Included in the standard $3/vehicle/month subscription — no per-user fee, no premium tier, no API surcharge. Free tier (up to 3 vehicles) includes the full Profitability Dashboard with all integrations for testing. Book a Demo to See Pricing →
If 3 of your 20 trucks are losing money, you should know which ones.
Fleet Rabbit's Profitability Dashboard pulls revenue, fuel, maintenance, driver pay, and insurance into one view. Per-truck. Per-route. Per-driver. Per-customer. Real-time. With the API for custom integrations and one-click QuickBooks export. Free for up to 3 vehicles indefinitely.







