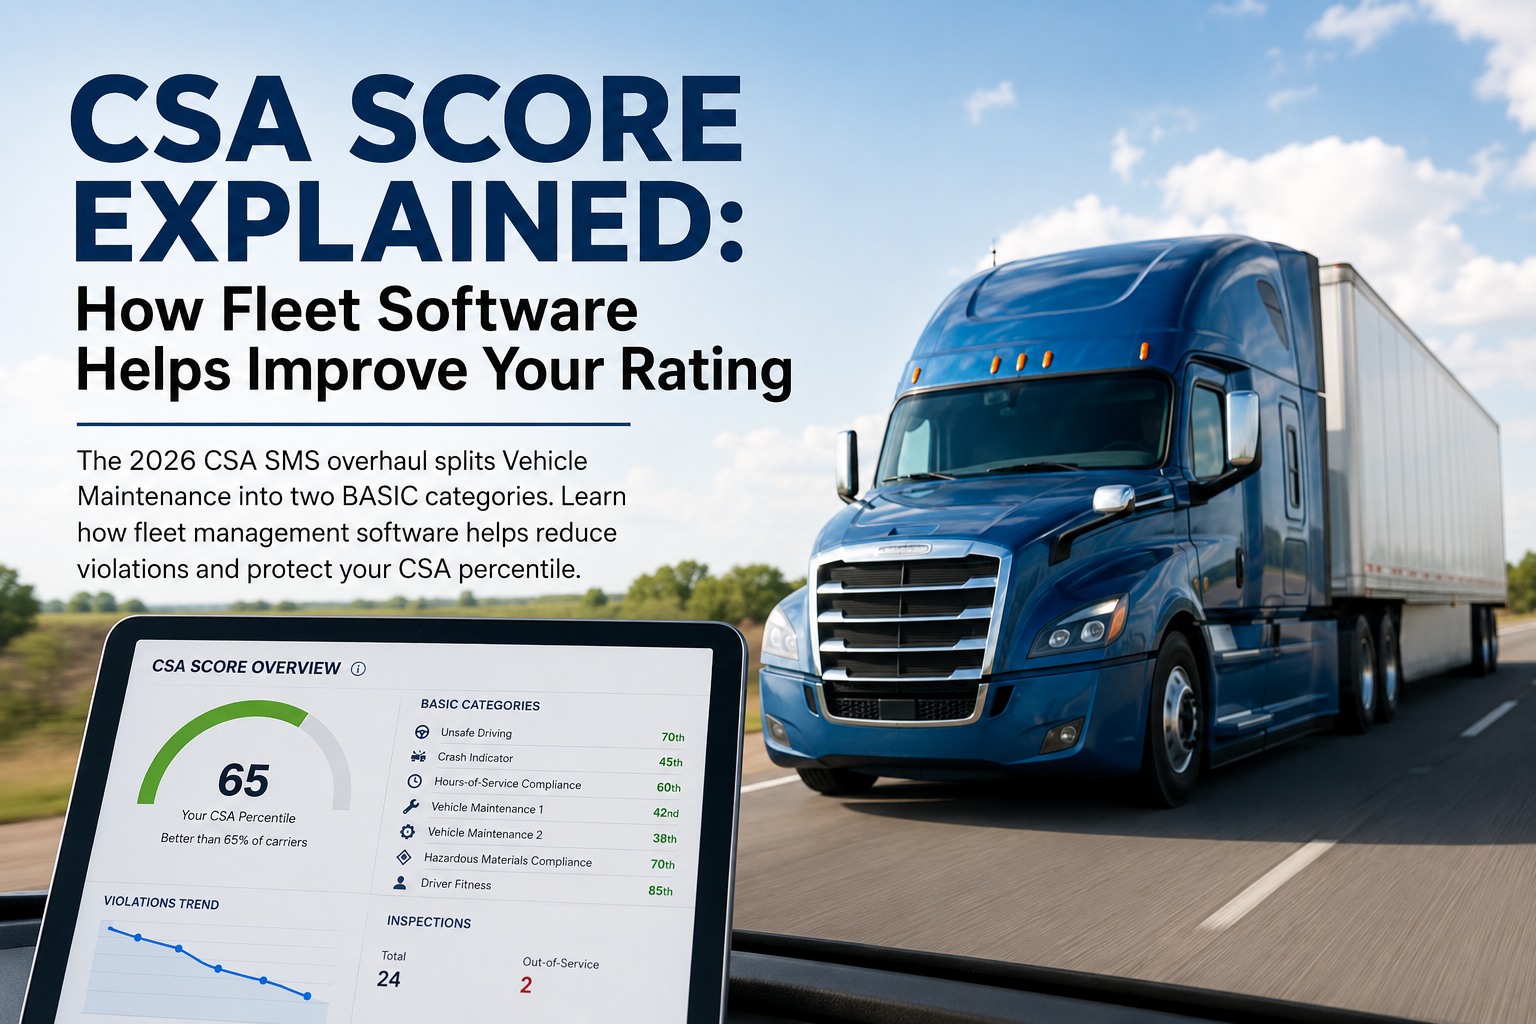
Your CSA score is the closest thing trucking has to a public credit rating — and in 2026 the rules that calculate it changed more than they have in over a decade. The FMCSA's Safety Measurement System overhaul consolidated hundreds of violation codes, simplified severity weighting, and split the Vehicle Maintenance category into two separate scored compliance categories, including a brand-new "Vehicle Maintenance: Driver Observed" category that grades the quality of your drivers' pre-trip inspections. With brokers screening scores before awarding loads and insurers raising premiums 25–50% on carriers above threshold, a rising percentile now costs real money long before FMCSA ever knocks. This guide explains exactly how the new scoring works, what the thresholds mean, and how fleet management software helps you drive violations down and keep your percentile in the safe zone. Start free trial or book a demo to see your fleet's compliance picture in one dashboard.
2026 SMS Overhaul Is Live — And Vehicle Maintenance Now Counts Twice
The FMCSA consolidated roughly 950+ violation codes into about 116 groups, replaced the old 1–10 severity scale with a simple two-tier system, and divided Vehicle Maintenance into two independently scored categories. If you haven't reviewed your score since the changes took effect, your percentile may have moved without a single new violation.
6
Compliance categories now scored, renamed from the old seven BASICs
25–50%
Insurance premium increase carriers can face above intervention threshold
85%
Of brokers check CSA scores before awarding a load to a carrier
60%+
Of out-of-service violations come from brakes, tires, and lights alone
Every clean inspection lowers your percentile. Every missed defect raises it.
Fleet Rabbit turns pre-trip inspections, DVIRs, and preventive maintenance into a documented compliance record that scores clean on all four inspection-driven categories.
What a CSA Score Actually Is
CSA stands for Compliance, Safety, Accountability — the FMCSA program that replaced the old SafeStat system in 2010. It uses the Safety Measurement System to convert roadside inspection results and crash data into percentile rankings from 0 to 100, where lower is better. A score of 15 means you are safer than 85% of comparable carriers; a high score draws FMCSA attention, broker rejection, and insurance scrutiny. Scores update monthly, typically on the first Friday, and are calculated against carriers with a similar number of inspections and vehicle type — so it is always a ranking against your peers, not an absolute grade. Book a demo to see how your inspection data maps to each category.
0–100
Percentile, Not a Grade
Your number is a ranking against similar carriers. Lower is safer. It moves every month as new inspections come in and old violations age out.
OOS ×2
Two-Tier Severity
The 2026 system replaced the 1–10 severity scale. Out-of-service violations carry a weight of 2; every other violation carries a weight of 1.
Recency
Recent Counts More
Violations weigh heaviest in the first months and lose weight over time before dropping off the calculation window entirely.
Monthly
Updated Every Month
SMS results refresh monthly. A clean stretch of inspections pushes your percentile down steadily; a bad month lingers in the window.
The Six Compliance Categories and Their Thresholds
The 2026 overhaul renamed the BASICs "compliance categories" and reorganized which violations feed each one. Each category is scored separately with its own intervention threshold. Cross a threshold and FMCSA prioritizes you for intervention — starting with a warning letter and escalating from there. The table below shows every category, its 2026 threshold, and what drives it. Scroll horizontally on mobile to see the full breakdown.
← Scroll to see all columns →
!
The category that changed everything: "Vehicle Maintenance: Driver Observed" is entirely new for 2026. It scores the defects your drivers should have caught during a pre-trip walk-around — a flat tire, an inoperative light, a visibly worn brake. That means the quality and documentation of every driver inspection now feeds a CSA category that did not exist a year ago. Fleets still running paper DVIRs are exposed here.
See how a digital DVIR scores clean on this category.
What Happens When You Cross a Threshold
Exceeding an intervention threshold does not mean an automatic fine — but it starts a process that escalates quickly if you do not act. Each stage feeds the next, and the roadside targeting stage is a self-reinforcing loop: more inspections mean more chances for violations, which push your percentile higher still.
Stage 1
Warning Letter
FMCSA identifies your fleet as high-risk and sends a written notice. This is your window to correct course before formal action begins.
→
Stage 2
Roadside Targeting
Your vehicles get flagged for priority selection at weigh stations. More inspections mean more opportunities for violations — a compounding cycle.
→
Stage 3
Compliance Review
A safety investigator reviews your DVIRs, maintenance records, driver files, and ELD data. Gaps mean additional violations and penalties.
→
Stage 4
Fines or OOS Order
Civil penalties are issued — or an out-of-service order halts operations entirely. Reported average is $6,763+ per case.
Stop the cycle before Stage 1. Build a clean inspection record starting today.
Fleet Rabbit documents every inspection, tracks every defect to a repair, and gives you a monthly view of exactly where your fleet sits against each threshold.
Where the Violations Actually Come From
The most important insight for improving your score: the two Vehicle Maintenance categories are the most directly controllable by an inspection program, and a handful of defect types drive the overwhelming majority of out-of-service orders. The 2025 CVSA International Roadcheck inspected 56,178 commercial vehicles across North America and placed 18.1% out of service — and the breakdown shows exactly where to focus. These are the violations a disciplined pre-trip catches. Scroll the table horizontally on mobile.
← Scroll to see all columns →
The takeaway is stark: more than 60% of every out-of-service order traces to brakes, tires, and lights — and every one is catchable in a walk-around that takes a few minutes. A structured, documented pre-trip inspection program is the single highest-leverage move a fleet can make on its CSA percentile. Book a demo to see the guided inspection flow that catches these before roadside.
How Fleet Management Software Moves Your Score
CSA scores can only be lowered one way: accumulate recent, violation-free inspections and eliminate the behaviors that generate violations. Software does not change your score by magic — it changes the operational habits that produce violations, and it documents everything so a clean record actually gets credit. Here is where Fleet Rabbit acts on each inspection-driven category.
01
Guided Pre-Trip Inspections That Catch Defects First
Drivers work through a structured digital checklist covering brakes, tires, lights, and securement — the exact items that drive 60%+ of OOS orders. Defects get caught in the yard, not at the weigh station, keeping violations off both Vehicle Maintenance categories.
02
DVIRs That Score Clean on the New Driver-Observed Category
Every driver inspection is timestamped, photo-verified, and complete — the documentation the 2026 "Vehicle Maintenance: Driver Observed" category rewards. Paper DVIRs that miss a signature or a defect note leave you exposed on a category that did not exist last year.
03
Defect-to-Repair Tracking for Compliance Reviews
Every defect noted links straight to a work order with parts, labor, and mechanic sign-off. When a safety investigator reviews your records, the repair certification is already attached — closing the gaps that turn a review into additional violations.
04
Usage-Based Preventive Maintenance
Mileage- and engine-hour-based PM scheduling keeps brakes, tires, and lights ahead of failure instead of behind it — attacking the root cause of the violations that drive your Vehicle Maintenance percentile.
05
A Clean 24-Month Documentation Trail
Every timestamped inspection builds the recent, violation-free history that steadily pushes old violations down the timeline. Consistency is exactly what the percentile math rewards, and the record is audit-ready by default.
06
Monthly Compliance Visibility by Category
A single dashboard shows where your fleet trends against each threshold, and flags the repeat defects driving your worst category — so you fix the pattern before it crosses a line and triggers a warning letter.
The Improvement Path: Reactive vs. Managed
Two fleets with the same trucks and the same lanes can sit on opposite sides of every threshold. The difference is whether inspection and maintenance are reactive or managed. Here is the contrast at a glance.
Reactive Fleet — Score Drifts Up
Paper DVIRs, often incomplete or unsigned
Defects found at roadside, not in the yard
Maintenance run to failure, not to schedule
No record link between defect and repair
Score checked only after a warning letter arrives
Exposed on the new Driver-Observed category
Managed Fleet — Score Trends Down
Digital, photo-verified, timestamped DVIRs
Defects caught in guided pre-trip inspections
Preventive maintenance by mileage and hours
Every defect linked to a documented repair
Category trends reviewed monthly on a dashboard
Clean documentation scores the new category well
See Where Your Fleet Sits Against Every Threshold
Fleet Rabbit gives commercial fleets guided inspections, photo-verified DVIRs, defect-to-repair tracking, preventive maintenance scheduling, and monthly category visibility — the exact toolkit that moves inspection-driven CSA categories down. Deploy at $5/vehicle/month, no hardware, live within 72 hours.
Guided pre-trip inspections
Photo-verified digital DVIRs
Defect-to-repair tracking
Monthly category dashboards
Frequently Asked Questions
How long do violations stay on my CSA score?
Violations remain in the calculation window for 24 months from the inspection date for carriers, then drop off completely. They carry the most weight when recent and lose weight over time, which is why a steady run of clean inspections improves your percentile gradually but durably. The 2026 methodology places extra emphasis on the most recent 12 months.
Book a demo.
What is the new "Vehicle Maintenance: Driver Observed" category?
It is a compliance category created in the 2026 SMS overhaul that scores violations a driver could reasonably have caught in a walk-around or a Level 2 roadside inspection — a flat tire, an inoperative light, a visibly defective brake. It means the quality and documentation of your drivers' pre-trip inspections now feed a CSA score directly. Digital, photo-verified DVIRs are the strongest defense here.
Book a demo.
What are the intervention thresholds in 2026?
Generally 65% for the high-crash-risk categories — Unsafe Driving, HOS Compliance, and Crash Indicator — and 80% for Driver Fitness, Controlled Substances/Alcohol, and both Vehicle Maintenance categories. Thresholds vary by carrier type (general freight, passenger, hazmat) and are subject to periodic FMCSA revision. Cross one and FMCSA prioritizes you for intervention.
Book a demo.
Can software really lower my CSA score?
Software cannot edit your score directly — only accumulating recent clean inspections and eliminating violation-generating behavior does that. What software does is change the operational habits that produce violations and document the clean record so it gets credit. Guided inspections catch defects before roadside, and a complete documentation trail keeps a compliance review from turning into new violations.
Book a demo.
How do I check my current CSA score?
Log into the CSA portal at csa.fmcsa.dot.gov with your DOT number and PIN. Review your percentile in each category monthly and watch for movement toward thresholds. You can also preview your score under the new methodology using the FMCSA Prioritization Preview tool before the system is fully in effect, and challenge incorrect data through DataQs.
Book a demo.
Why should I care if I'm below every threshold?
Because your score is visible far beyond FMCSA. Roughly 85% of brokers check CSA scores before awarding loads, many large shippers have internal cutoffs, and carriers above threshold can face insurance premium increases of 25–50% or non-renewal. A clean percentile is a competitive advantage that wins premium freight and lowers your cost of capital — not just a compliance checkbox.
Book a demo.
Your CSA Score Doesn't Have to Happen to You.
Fleet Rabbit gives you guided inspections, photo-verified DVIRs, defect-to-repair tracking, and monthly category visibility — the toolkit that moves inspection-driven CSA categories down and keeps you on the right side of every threshold. Integrated with your existing systems in 5–7 working days, at $5/vehicle/month, with no new hardware required.
Free tier for up to 3 vehicles · No credit card required · No hardware installation
July 18, 2026By Derek Goes
All Blogs