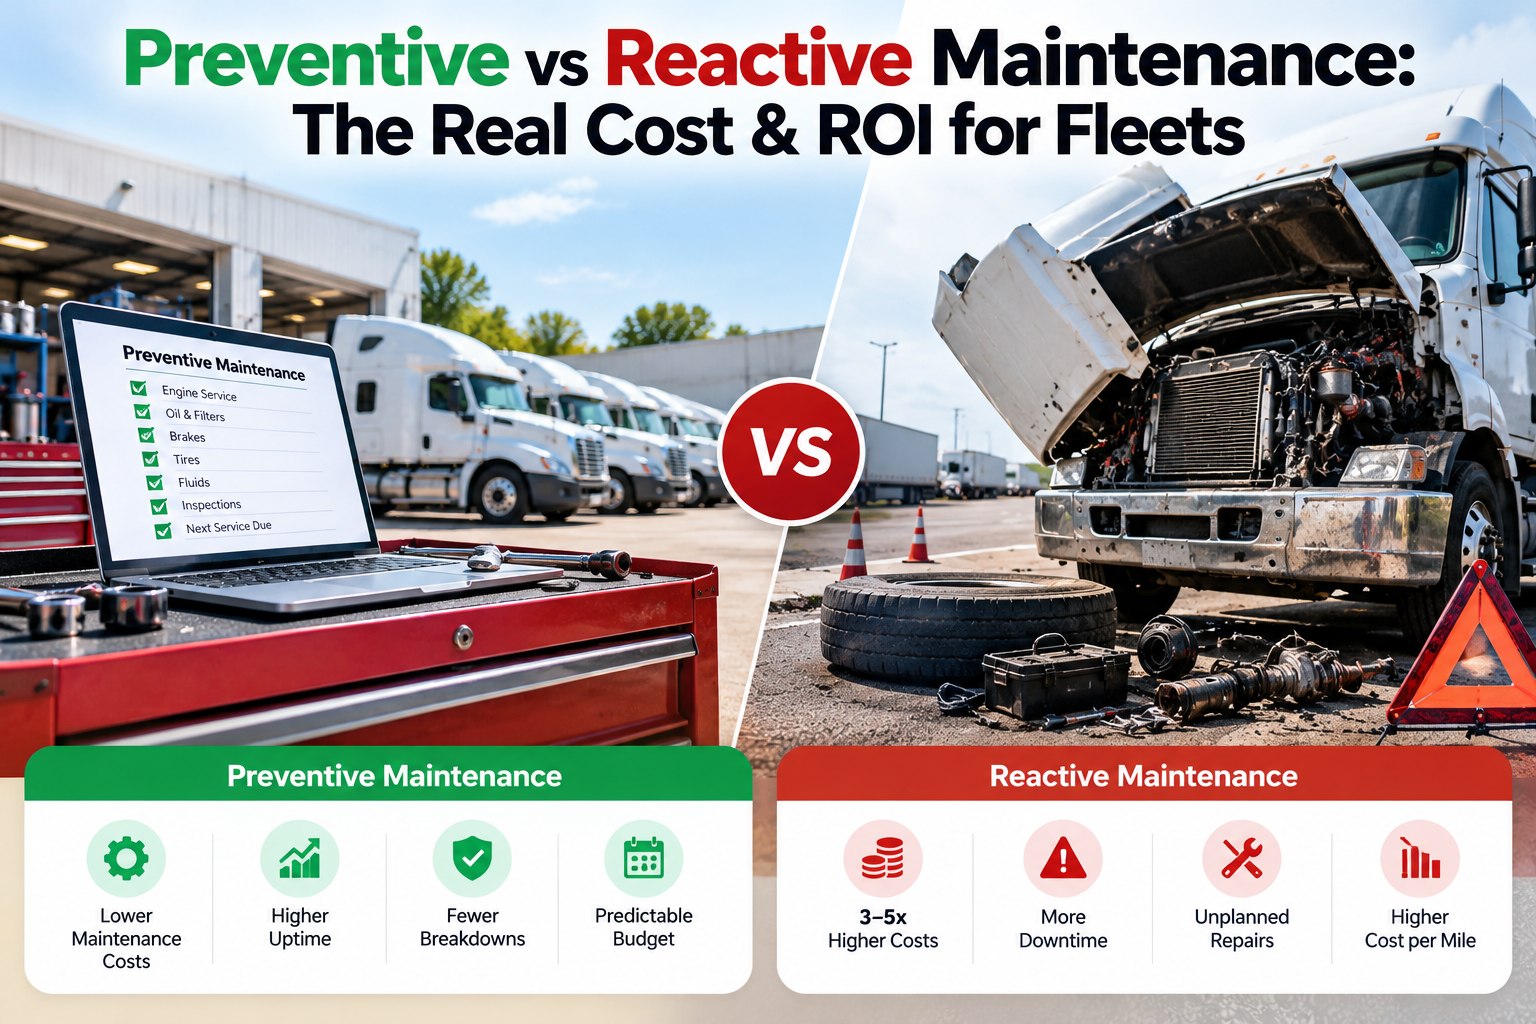
Preventive maintenance costs less than reactive maintenance because a planned job avoids the tow, overtime, rush parts and lost day that come with a breakdown. Vendor guides put the gap at roughly 3 to 5 times for the same job, and none of them names the study behind the figure. This page uses the industry cost per mile, per-job examples and a simple break-even model to show what a PM program is worth, with the assumptions in plain view. Schedule a call to run this math on your own fleet.
PM ROI · FLEET OWNERS AND OPERATIONS LEADS
The Same Brake Job Can Be a $1,200 Shop Visit or a $4,800 Roadside Emergency
The repair is the same. The tow, the overtime, the rush parts and the lost day are what change the bill. Here is the math, and the point at which scheduling pays for itself.
ONE VENDOR EXAMPLE: THE SAME BRAKE JOB
$1,200Planned, in the shop
$4,800Emergency, roadside
A hypothetical example, not measured data.
Preventive vs Reactive Maintenance: What Actually Differs
The work is the same, and the cost difference comes from when and where it happens
Reactive maintenance
!Repair after the failure
!Parts ordered when it breaks
!Tow, overtime and rentals
!Downtime is a surprise
Preventive maintenance
✓Service on a schedule
✓Parts staged in advance
✓Done in the shop, in a low-demand window
✓Downtime is planned
What Truck Maintenance Costs Per Mile Right Now
Repair and maintenance runs about 21 to 22 cents a mile, and it is rising faster than total cost
The American Transportation Research Institute reports a record 2025 operating cost of $2.336 per mile for Class 8 trucks, up 3.4 percent. Repair and maintenance rose 8.6 percent to about $0.215 per mile, and tires rose 6.4 percent to 5 cents. Preliminary 2026 data shows repair and maintenance rising another 2.4 percent.
SELECTED 2025 CLASS 8 COSTS, CENTS PER MILE. ATRI, AS REPORTED BY TRADE PRESS
Repair and maintenance
21.5 cents
Insurance premiums
10.6 cents
Tires, parts and labor
5 cents
At 100,000 miles a year, that is about $21,500 of repair and maintenance per truck
These annual figures are the per-mile rate multiplied by assumed mileage, so adjust them to your own truck.
ANNUAL REPAIR AND MAINTENANCE PER TRUCK AT $0.215 PER MILE. CALCULATED
60,000 miles a year
$12,900
100,000 miles a year
$21,500
120,000 miles a year
$25,800
Why Reactive Repairs Cost More: The Cost Layers on Top of the Part
Overtime, rush parts, towing and downtime stack on top of the repair itself
Labor and overtime
One vendor guide puts the labor premium at 1.5 to 2.5 times, with overtime rising from $85 to $127 to $170 an hour.
Premium and rush parts
Expedited or premium parts add roughly 1.3 to 2 times the normal part cost, plus next-day freight of $150 to $400.
Towing and downtime
Class 8 towing runs $800 to $2,500 an incident, and the truck earns nothing while it waits.
EXTRA COSTS OF A BREAKDOWN, US DOLLARS. VENDOR GUIDES, AMBER IS DOWNTIME ESTIMATES THAT DISAGREE
Class 8 tow, per incident
$800 - $2,500
Next-day air freight, per shipment
$150 - $400
Downtime per vehicle per day, guide 1
$448 - $760
Idle revenue per day, guide 2
$1,200 - $4,000
$0
$1,000
$2,000
$3,000
$4,000
Read the downtime figures as a range. One guide gives $448 to $760 per vehicle per day without showing the math, and another gives $1,200 to $4,000 of idle revenue per day. They measure different things, so use your own revenue per truck per day.
Want your own planned-versus-emergency numbers? Schedule a call and we will walk through them.
Bring one month of repair invoices, and we will split them into planned and unplanned.
Planned vs Emergency Repair Cost: Per-Job Examples
Vendor examples show a multiple of about 3 to 5 for the same job
These are illustrative figures from one fleet-software vendor, built from a hypothetical fleet. The 3 to 5 times headline is attributed to unnamed industry studies, and a second vendor puts the range at 3 to 9 times when indirect costs are included. Treat them as a planning range, not a measured result.
ALTERNATOR
$520
↓
$1,850
3.6x
BRAKE JOB, FAQ ESTIMATE
$1,200
↓
$3,600 - $6,000
3 - 5x
DEFERRED PADS
$180
↓
$2,600
one vendor example
The PM Software ROI Math: How Many Emergencies Pay for It
Four inputs give a break-even you can check against your own invoices
1
Subscription cost
Free for 3 vehicles, then $5 per vehicle per month.
2
Saving per avoided emergency
$3,600 emergency minus $1,200 planned is $2,400, at the low end of the 3 to 5 times range.
3
Break-even
Annual cost divided by $2,400 gives the emergencies you must convert to planned jobs.
4
Everything above break-even
Downtime, tow and cargo costs are on top, and are not counted here.
A 50-truck fleet breaks even after converting about one emergency a year
The chart divides the annual FleetRabbit subscription by the $2,400 saved on each emergency turned into a planned job. It counts only the repair cost difference, so downtime, towing and cargo are not included, and neither is staff time to run the program.
EMERGENCY REPAIRS THAT MUST BE AVOIDED PER YEAR TO COVER THE SUBSCRIPTION. CALCULATED
10 trucks, $420 a year
0.2 repairs
25 trucks, $1,320 a year
0.6 repairs
50 trucks, $2,820 a year
1.2 repairs
100 trucks, $5,820 a year
2.4 repairs
This is a model, not a promise. Software only helps if reminders lead to work being done on time. The assumption that a repair costs 3 times as much in an emergency is the low end of the range quoted above, so the real break-even can be lower or higher.
How PM Scheduling Software Moves Repairs From Reactive to Planned
Three jobs of the software turn the break-even into savings
Schedules and reminders
Recurring PM schedules per unit, triggered by miles, engine hours or date, so the service happens before the failure.
Defects to work orders
A defect reported on a DVIR becomes a work order against the same truck, so a small problem is fixed while it is cheap.
History and cost per unit
Every service and its cost stays on the unit, so repeat failures and cost per mile are visible.
How to Measure Your Own Preventive and Reactive Split
Track four numbers for a quarter, and your own ratio replaces the vendor ranges
Measure
Count planned and unplanned repairs separately each month
Track repair and maintenance cost per mile per truck
Flag repeat failures on the same unit
Record tow, overtime and downtime hours on each breakdown
Act on it
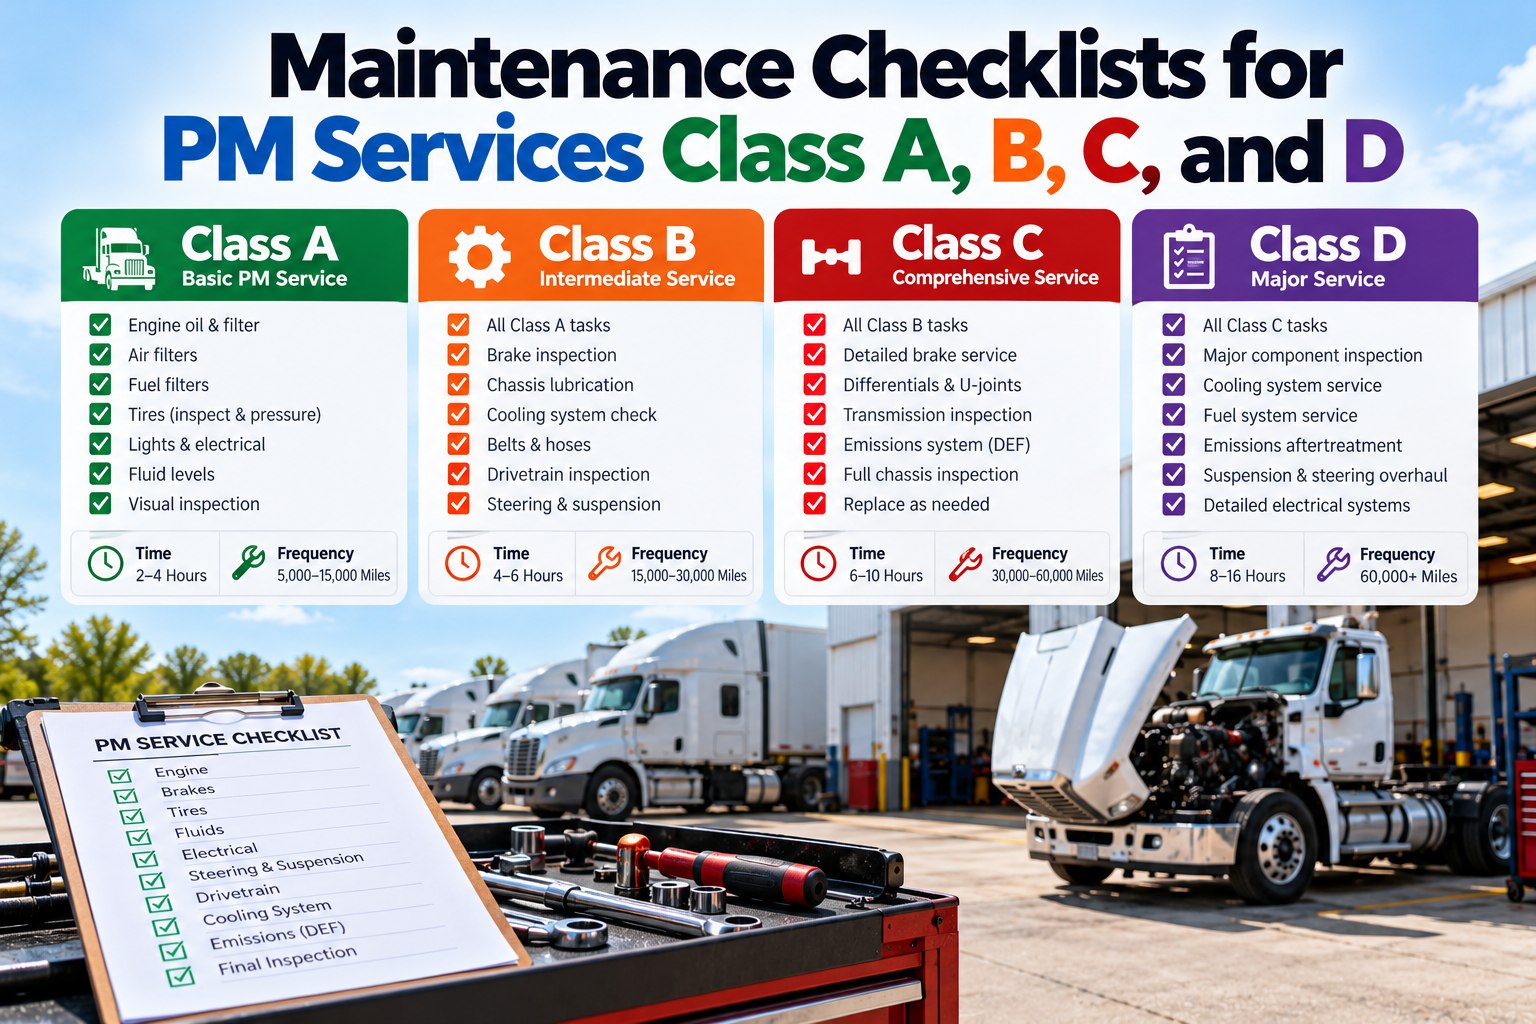
Put every recurring service on a PM schedule
Turn DVIR defects into work orders the same day
Review the planned share of repairs each quarter
Compare your cost per mile to the industry figure each year
Prove PM ROI on Your Own Fleet: Schedule Services, Log Every Repair and Track Cost Per Unit in FleetRabbit
FleetRabbit puts recurring PM schedules, DVIR work orders and service history on every truck, so you can see how many repairs were planned and what each unit costs. It is free for up to 3 vehicles, then $5 per vehicle per month.
PM schedules per unit
DVIR defects to work orders
Repair cost per truck
Service history on record
Frequently Asked Questions
Quick answers on preventive versus reactive maintenance cost and ROI
Is reactive maintenance really 3 to 5 times more expensive?
Vendor guides say so for the same job, and up to 9 times with indirect costs, but they do not name their sources. Measure your own planned and unplanned costs to find your multiple.
What does truck maintenance cost per mile?
ATRI's 2025 figures put repair and maintenance at about 21.5 cents per mile for Class 8 trucks, up 8.6 percent, within a total of $2.336 per mile.
How do I calculate PM software ROI?
Divide the annual software cost by the saving from turning one emergency repair into a planned job. That gives the number of avoided emergencies needed to break even.
Does preventive maintenance eliminate breakdowns?
No. It reduces the ones that come from missed services and early wear, but some failures are unpredictable. The aim is to shift the mix toward planned work.
What costs are not in the break-even model?
Downtime, towing, cargo loss, missed deliveries and staff time. These add to the benefit or cost and depend on your operation.
Is a small fleet too small for PM software?
The break-even in the chart is under one emergency a year for a 25-truck fleet. FleetRabbit is free for up to 3 vehicles.
What does FleetRabbit cost?
FleetRabbit is free for up to three vehicles and $5 per vehicle per month after that.
Track 3 vehicles free.
Turn Reactive Repairs Into Planned Work: Put Every Service and Repair on Record
For a fleet of about 25 trucks, one emergency turned into a scheduled job can cover a year of the subscription. Set the schedules, track the split and let your own numbers make the case.
Free tier for up to 3 vehicles · No credit card required · Services and costs stored per unit
October 12, 2026By Alex Rowan
All Blogs