Every fleet manager has the same target hanging over the next quarterly review: get the breakdown numbers down. Get the truck-availability numbers up. Get the cost-per-mile back to budget. The good news is that 35% downtime reduction in 90 days is not aspirational marketing copy it is the documented outcome from fleets that follow a specific, sequenced playbook combining preventive maintenance discipline, predictive alerts, and dispatch-aware scheduling. The fleets that hit it don't have better trucks or richer budgets than the ones that miss it, they have a 30-60-90 day execution plan that builds in three layers, with measurable milestones at each gate. This guide gives you that exact plan: what to do in days 1-30, 31-60, and 61-90, the four downtime drivers that produce 80% of the savings, the KPIs that prove progress, and how Fleet Rabbit operationalizes the entire playbook from day one.
From Reactive Firefighting to 35% Less Downtime — in 12 Weeks
Three phases. Three layers. One measurable outcome. The 30-60-90 day playbook that fleets running 95%+ uptime use to lock in compounding wins on PM compliance, predictive alerts, and scheduling discipline.
The Real Cost of Fleet Downtime — and Why 35% Matters
Before we get into the playbook, the math has to be honest. Most fleet managers underestimate downtime cost by 40-60% because they only count the repair bill. The actual cost includes towing, rental replacement, missed delivery penalties, idle driver wages, and route disruption — and it scales fast.
On a 20-vehicle fleet at the industry average $148,000 annual downtime cost, hitting a 35% reduction puts $51,800 back into operating budget — recovered from breakdowns that did not happen. On a 50-truck fleet, the same percentage moves over $130,000 per year. Calculate Your Fleet's Downtime Recovery Potential →
The 4 Drivers of Fleet Downtime — Where 80% of Hours Are Lost
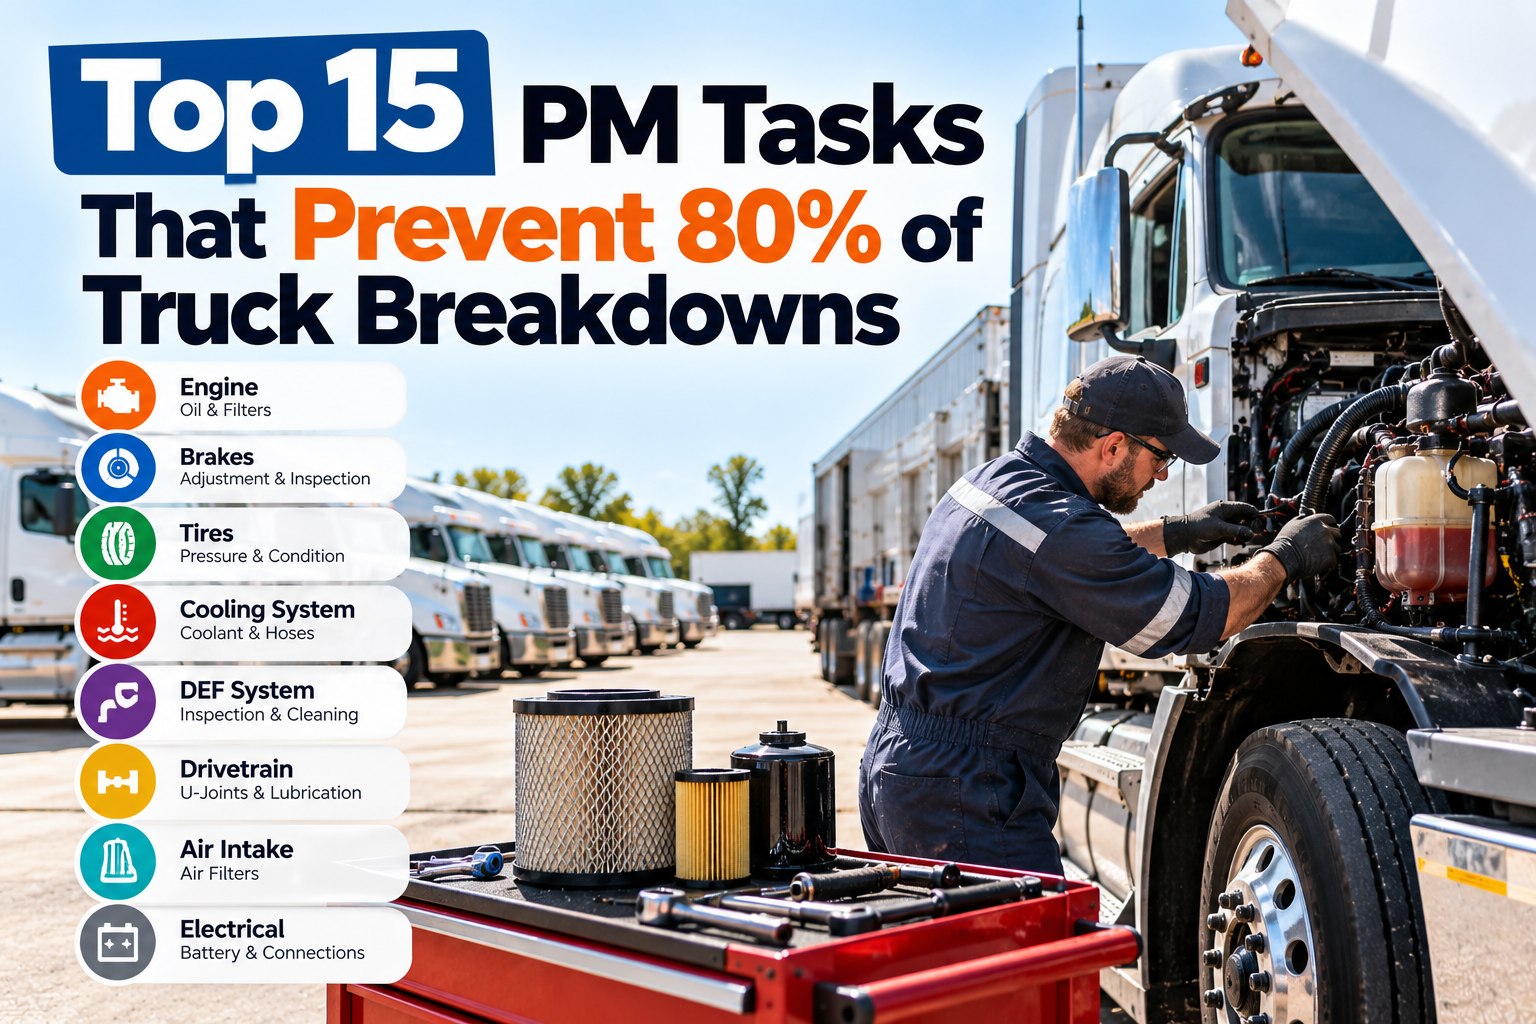
Not all downtime is equal. Across thousands of fleet operations studied by AAA, Samsara, and the American Trucking Associations, four root causes consistently produce 80% of all unplanned vehicle hours off the road. Hit these four and the rest is rounding error.
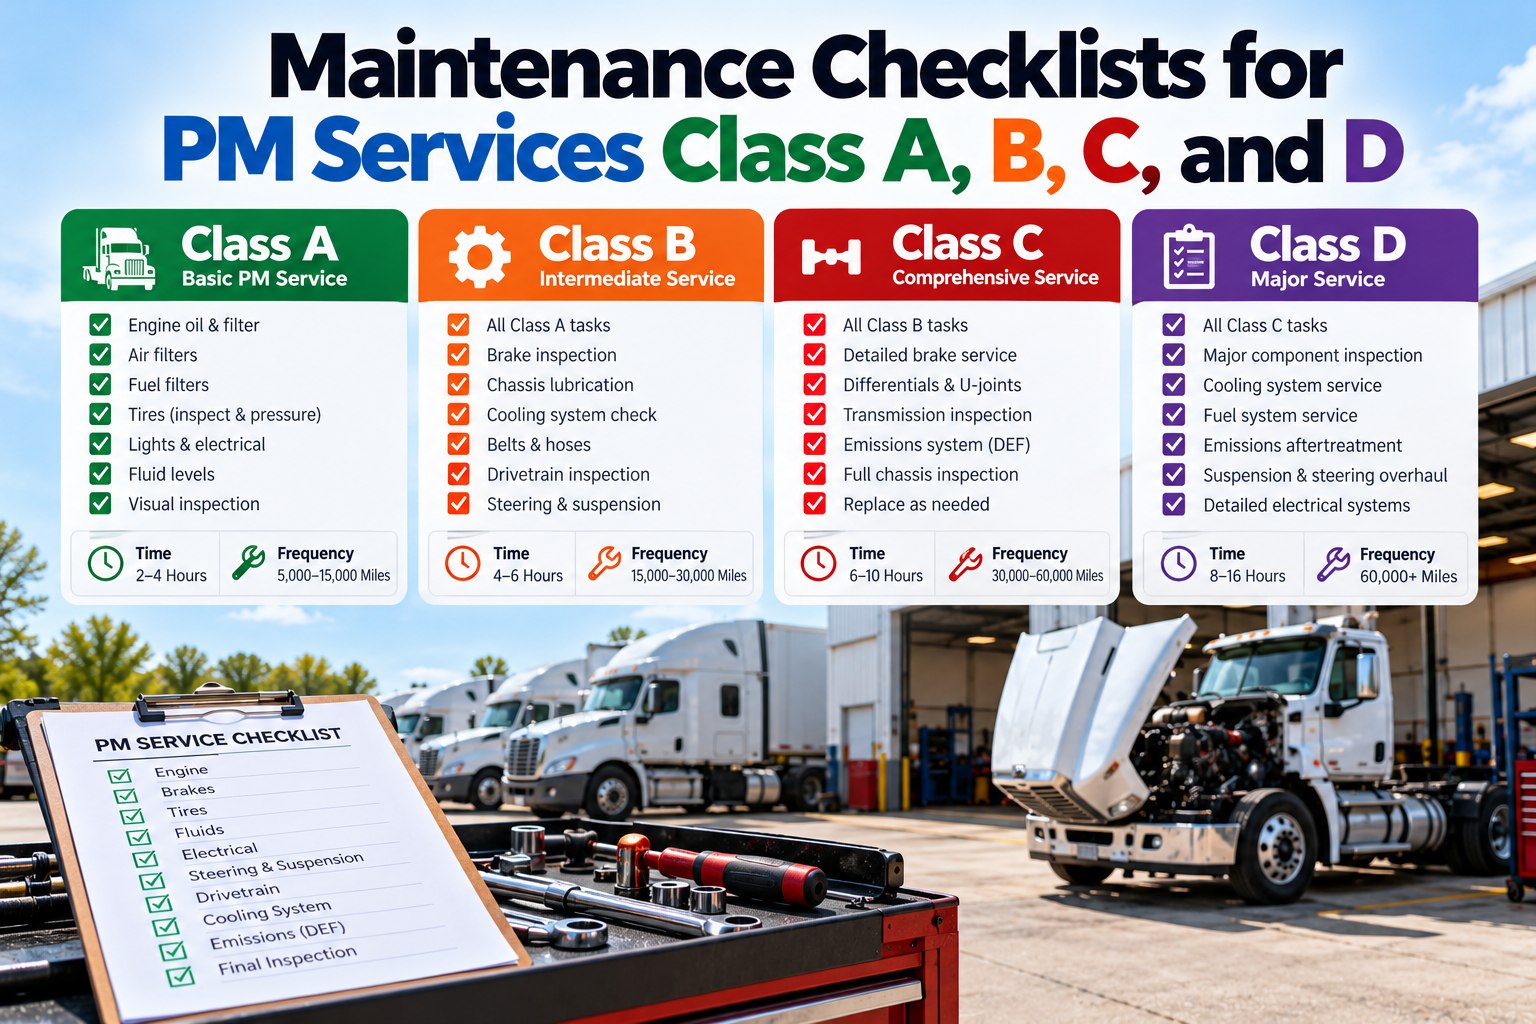
Industry average PM compliance is 61%. Fleets running below 75% experience significantly higher breakdown rates. Missed oil changes, skipped filter replacements, deferred brake adjustments — every one becomes an emergency repair within 30-90 days.
Driver flags a defect, paperwork sits 2-3 days, defect escalates into a roadside event. The 60+ hour paper-DVIR lag is the single biggest source of cascade failures in mid-sized fleets.
Engine fault codes, oil temperature drift, vibration anomalies — modern telematics produce these signals, but most fleets have nothing watching for them. Failures that should have been caught 2-4 weeks early become catastrophic events.
Shop schedules service when convenient for the shop. Dispatch finds out at 6 AM that the truck they planned to use is in the bay. Coordinating maintenance with dispatch capacity recovers 8-12% of fleet uptime instantly.
The 30-60-90 Day Playbook — Phase by Phase
This is the sequenced action plan that moves the fleet from reactive to proactive in 12 weeks. Each phase builds on the last; skipping phases breaks the compounding effect.
The first 30 days are about getting eyes on the fleet. Most operations starting this playbook have no real-time visibility into PM status, defect queues, or work order aging. Phase 1 fixes that.
Move from paper DVIRs to mobile-first digital inspections. Mandatory photo capture on defects. Auto work order generation. Inspection completion rates go from 55-65% (paper) to 94-98% (digital) within 30 days.
Configure mileage + time + engine-hour triggers per vehicle. Set 90/60/30/14-day lookahead alerts. Pull current PM compliance baseline — most fleets discover they're at 55-70%.
Every defect, every PM, every repair lives in one queue. Shop sees status at a glance. Tech assignment automated. The 23-minute manual work order creation drops to under 10 seconds.
MTTR, PM Compliance %, Work Order Aging, Defect-to-Repair Cycle — all updated in real time. Phase 1 success metric: PM compliance climbs from baseline to 80%+, downtime drops 10-15%.
With visibility in place, Phase 2 turns reactive triage into proactive intervention. Predictive layer goes on top of the foundation built in Phase 1 — and the AI accuracy hits 90%+ by month two as it learns your fleet's specific patterns.
Wire up OBD-II, J1939, or factory ELD feeds into the maintenance platform. Engine fault codes, oil pressure, coolant temperature flow into the alert engine — no more dashboard light hidden until the truck dies on I-80.
Turn on AI-driven anomaly detection. Each vehicle gets a real-time risk score based on its own historical pattern. Alerts fire 2-4 weeks before component failure — not after.
Critical defects auto-trigger out-of-service holds. Major defects route to same-day shop queue. Minor defects bundle into next PM. Severity is pre-mapped at template level — no driver opinion, no inconsistent triage.
Measure: PM compliance now 88-92%. Predictive alerts catching first batch of pre-failure events. MTTR down to under 4 hours. Phase 2 success metric: 22-28% cumulative downtime reduction.
Phase 3 Is Where the Compounding Effect Locks In
Most fleets that start a downtime program plateau at 25%. Phase 3 is what gets you past that ceiling — and Fleet Rabbit ships it native, not as an add-on.
Phase 3 is where the playbook delivers the final 7-13% of downtime reduction by closing the maintenance-dispatch handoff gap and feeding completed-work-order data back into trend analysis.
Shop schedule visible to dispatch. Vehicle availability flows back from maintenance to operations in real time. Service windows pre-coordinated with route demand — not "drop the truck whenever."
Bill of materials linked to VMRS code. Parts auto-pulled before truck arrives. Skill-matched tech assignment based on certifications. First-time fix rate climbs from 75% to 90%+.
Surface vehicles with recurring defect patterns, technicians with low FTF rates, parts with high failure incidence. Pattern detection feeds back into PM template adjustments — continuous improvement loop activated.
Phase 3 measurement gate: PM compliance 95%+, MTTR under 3 hours, FTF rate 90%+, downtime 35%+ below Day 0 baseline. Document the gains, set Q2 stretch targets, repeat the loop.
The 5 KPIs That Prove the Playbook Is Working
Every phase has a measurable gate. If you can't see the number moving in real time, you can't tell if the playbook is working — and you can't course-correct before the quarter closes. These five KPIs are the ones to track on a live dashboard.
The leading indicator. Improving this from 70% to 94% reduces breakdowns by 50% and cuts MTTR within 90 days. Tracked per vehicle, terminal, technician.
The headline metric. The thing the playbook is built to move. Total unplanned hours / available hours, by vehicle, by week.
End-to-end pipeline measure. From driver flag to wheels-rolling. The single biggest time saver in Phase 1-2.
Phase 3 quality measure. Each 5% improvement cuts shop backlog ~20%. Driven by parts pre-staging + skill-matched assignment.
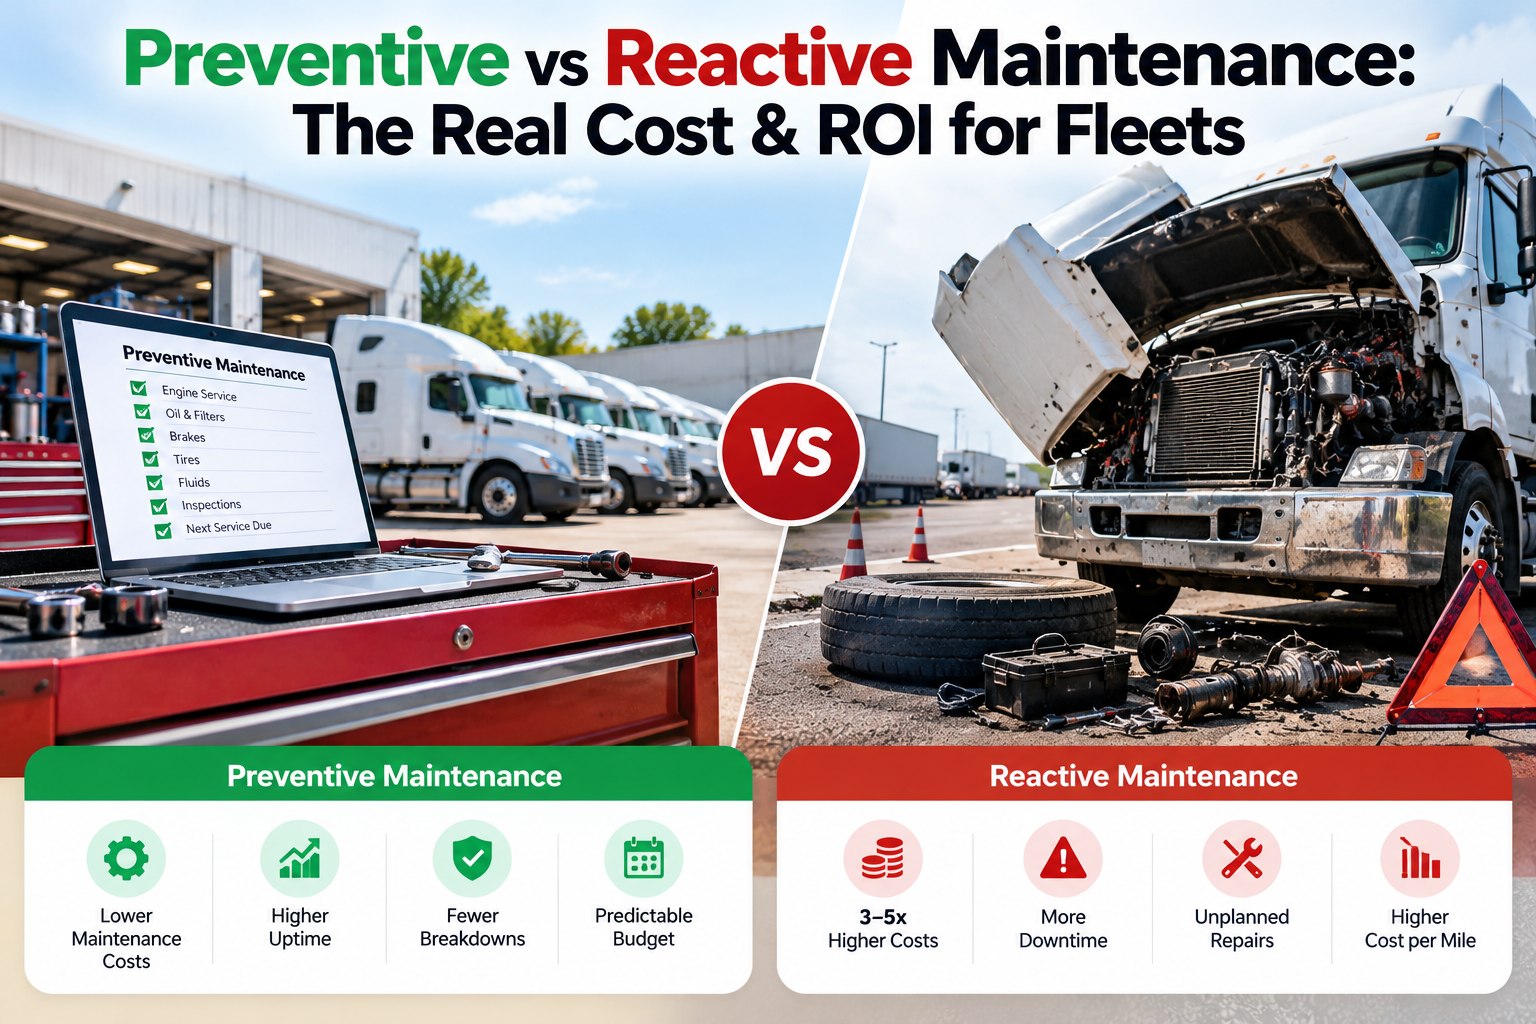
Strategic measure. The 80:20 ratio is the steady-state of a healthy fleet. Reactive fleets run 40:60 and pay 3-9× the cost.
Before vs After — What 90 Days Actually Looks Like
The cumulative impact across all five KPIs is what produces the headline 35% number. Here is what a typical 50-truck fleet looks like before starting the playbook versus 90 days in.
| Metric | Day 0 Baseline | Day 90 Result | Change |
|---|---|---|---|
| PM Compliance | 61% | 95%+ | +34 points |
| Unplanned Downtime Rate | 5.4% | < 2% | -63% |
| MTTR (Mean Time To Repair) | 4.8 hrs | < 3 hrs | -37% |
| Defect-to-Repair Cycle | 2.7 days | < 4 hrs | -94% |
| First-Time Fix Rate | 76% | 90%+ | +14 points |
| Inspection Completion | 62% | 96% | +34 points |
| Emergency Repair Spend | 42% of total | 15% of total | -64% |
| Annual Downtime Cost | $370K | $240K | -$130K |
That last row — $130K recovered on a 50-truck fleet — is the core ROI story. The Fleet Rabbit subscription cost across 90 days is a fraction of that. See the ROI Math for Your Specific Fleet Size →
How Fleet Rabbit Delivers the 90-Day Playbook
Every action in the 30-60-90 day plan above runs natively on Fleet Rabbit — no separate ELD, no bolt-on predictive tool, no external CMMS. Here is how each capability maps to phase outcomes.
Inspections completed in 60-90 seconds on driver's phone. Mandatory photo capture. GPS + timestamp lock. Inspection completion jumps from 55-65% (paper) to 94-98% (digital) in week one of deployment.
Mileage + time + engine-hour triggers per vehicle. 90/60/30/14-day lookahead alerts. Auto-generated work orders the moment any threshold fires. Compliance climbs from baseline to 80%+ in 30 days.
AI-driven anomaly detection trained on your fleet's specific patterns. Component-level alerts 2-4 weeks before failure. 90%+ accuracy by month two of deployment.
Critical defects auto-trigger OOS holds. Major defects route same-day. Severity pre-mapped at template level — no inconsistent triage. Dispatch board updates in real time as vehicle availability changes.
Shop calendar visible to dispatch. Service windows pre-coordinated with route capacity. The handoff gap that used to lose 8-12% of fleet uptime collapses to a shared dashboard view.
PM compliance, MTTR, defect-to-repair, FTF rate, planned vs unplanned — every gate metric updated live. Drill down by vehicle, terminal, technician. Surface plateaus before they cost a quarter.
Fleets that deploy the playbook on Fleet Rabbit consistently hit 35%+ downtime reduction by day 90, with full ROI inside 60-90 days from prevented breakdowns alone — before counting insurance, CSA score, and resale benefits. Schedule a 30-Minute Walkthrough of the Playbook →
Frequently Asked Questions
Yes — when you follow the phased playbook. Industry data from FleetRabbit, Samsara, AAA, and the U.S. Department of Energy consistently shows 25-45% downtime reduction within 90-180 days for fleets moving from reactive to predictive maintenance. The ones hitting 35%+ at day 90 are the ones that execute all three phases sequentially, not in parallel.
Phase 1 (PM compliance + DVIR digitization) runs without telematics — manual odometer entry works for the first 30 days. Phase 2 (predictive alerts) is significantly more accurate with telematics or ELD feeds. Most fleets either already have ELD installed (FMCSA-mandated for HOS) or add OBD-II hardware in week 4-5 to set up Phase 2.
The playbook scales down. Smaller fleets often see higher percentage gains because every prevented breakdown has outsized impact on tight margins. The phase 1 actions (digital DVIR, multi-trigger PM, central WO queue) deliver the biggest wins per dollar at any fleet size from 5 trucks up. See How Fleets Under 20 Vehicles Scale Phase 1 →
First prevented breakdown typically pays for the entire 90-day software cost. Average ROI on the full playbook lands at 2-4× within the first year — driven by reduced emergency repairs (3-9× cost premium avoided), lower towing/rental costs, fewer missed-delivery penalties, and insurance premium negotiation room from improved CSA scores.
Skipping Phase 1. Operators who try to jump straight to predictive alerts without first locking in PM compliance and digital DVIR get noisy alerts, low signal-to-noise, and shop teams that ignore the dashboard. Phase 1 builds the data foundation that makes Phase 2 actually work.
Yes. Fleet Rabbit supports vehicle-class templates (Class 3 light-duty, Class 8 tractor, reefer, bucket truck, etc.) with class-specific PM intervals, severity mapping, and parts libraries. Each vehicle inherits the right configuration automatically — the playbook runs identically across mixed fleets without bifurcating into multiple programs.
From Day 0 Baseline to 35% Less Downtime in 12 Weeks.
Mobile DVIR. Multi-trigger PM. Predictive alerts. Dispatch-aware scheduling. Live KPI dashboard. Every phase of the playbook native to Fleet Rabbit, deployable in days, measurable from week one. Used by 500+ fleets to recover six-figure annual downtime cost.