Almost everything sold to fleets as predictive maintenance is not prediction. It is threshold alerting, and there has been a formal name for that since 2003. ISO 13374 splits condition monitoring into six processing blocks and groups them explicitly: Data Acquisition, Data Manipulation and State Detection are the data-oriented blocks, while Health Assessment, Prognostic Assessment and Advisory Generation are the analysis-oriented ones. A telematics feed delivers the first block. A dashboard threshold is the third. The word predictive refers to the fifth — and getting there requires knowing how the component failed last time, which most fleets have never recorded. This is not an argument against telematics integration; it is an argument for being honest about which rung you are on, because the rungs below prognosis return most of the money anyway. The clearest example is usage: engine hours and odometer miles are different measures of different wear, and one published rule of thumb treats one engine hour as roughly 60 miles of engine work. On an idle-heavy unit that gap decides whether an oil interval is right or 40% late. This guide covers the six-block chain and where fleets actually stop, which signal should drive which maintenance item, the idle-adjusted usage calculation worked through, leading against lagging indicators, and the honest limits of prediction. Book a 30-minute demo to see usage-driven PM running, or start free with 3 vehicles.
Your Telematics Feed Is Block One of Six. Predictive Is Block Five.
For fleet maintenance managers, ops leaders and integration teams: the ISO 13374 chain from raw signal to advisory, which telematics signals genuinely support prediction, and the usage calculation that pays for itself long before any model does.
No credit card required. Connect telematics, ELD and inspection data in one place.
The Six Blocks Between a Signal and a Decision
ISO 13374 establishes general guidelines for software specifications related to data processing, communication and presentation of machine condition monitoring and diagnostic information. Its value here is not compliance — it is that it names every step, which makes it obvious which one your fleet has actually built. Start with the data in one place, free on 3 vehicles.
Block names and the data-oriented against analysis-oriented grouping are per ISO 13374-3:2012, which describes DA, DM and SD as data-oriented and HA, PA and AG as analysis-oriented. The bracket positions are our characterisation of common fleet practice, not part of the standard. The standard's own terms are defined in ISO 13372.
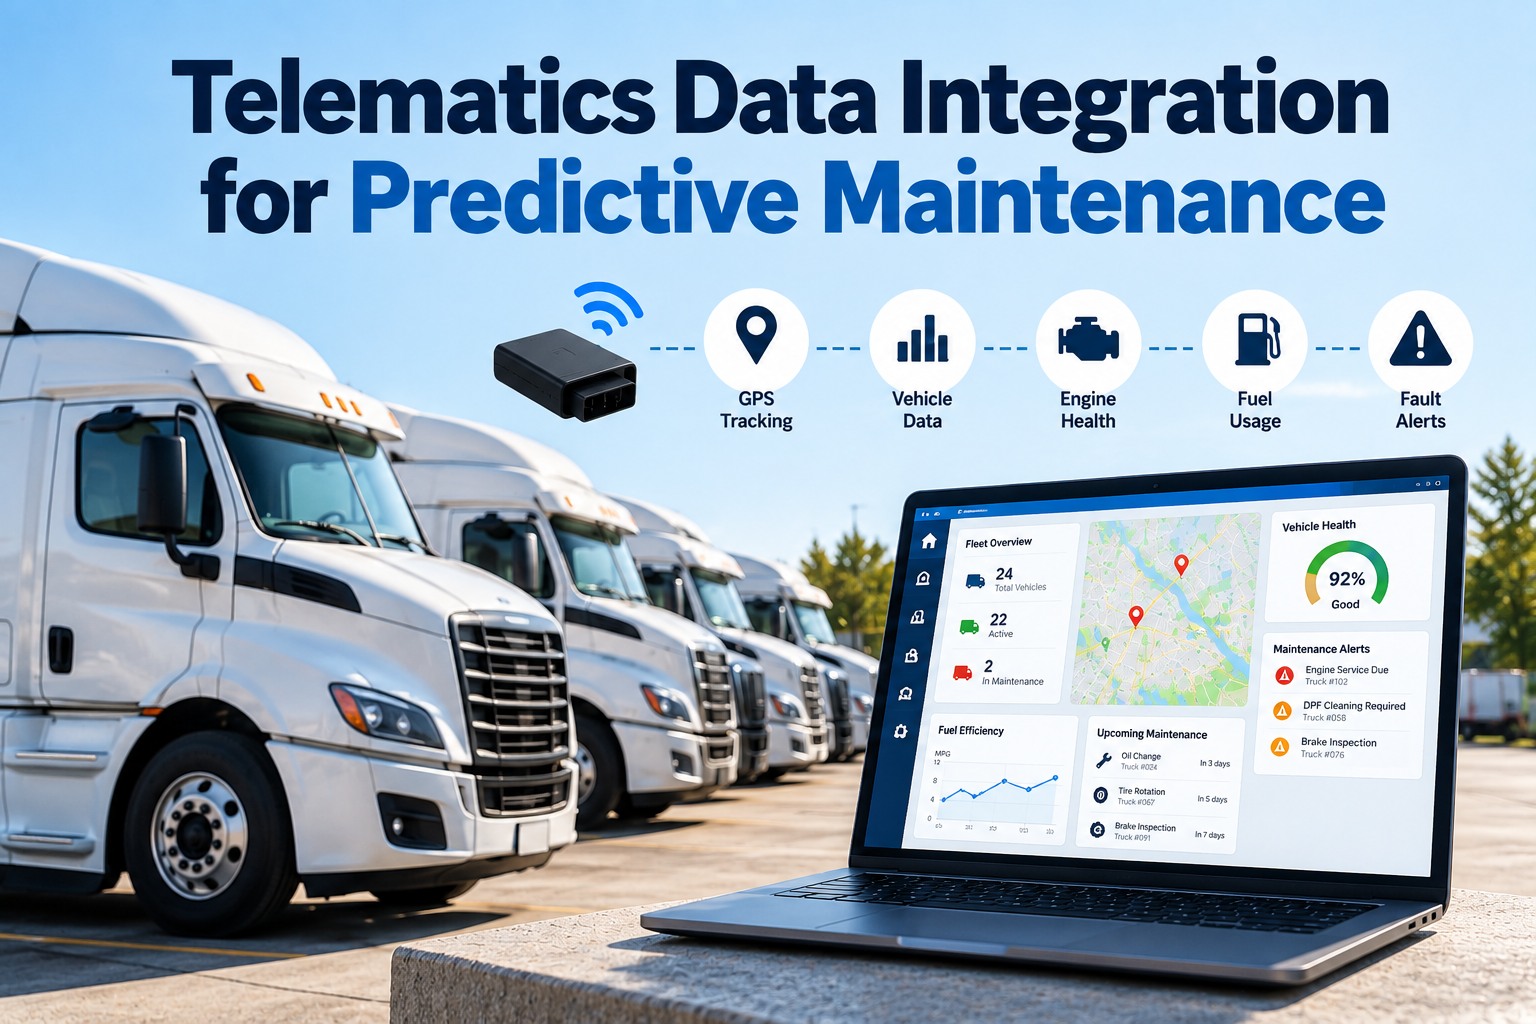
Getting the raw signal off the vehicle — odometer, engine hours, fault codes, GPS, fuel rate. This is what a telematics feed gives you, and it is where an integration project usually declares victory.
Cleaning, converting and aligning it. Units asserted, timestamps normalised, idle separated from PTO, a device reading tied to the right asset. Skipped far more often than it is done.
Comparing against a baseline and saying whether the value is normal. A threshold alert lives here. So does almost everything a fleet dashboard calls an insight.
Judging the condition of a component, not just a reading — combining several signals with history to say this unit is degrading. Needs trend storage, which most integrations never build.
Estimating future condition and remaining useful life. This is the block that the word predictive actually refers to, and it requires knowing how the component failed last time.
Turning the assessment into a recommended action with a deadline attached — which for a fleet means a scheduled work order, a part reserved, and a bay booked.
Which Signal Should Drive Which Maintenance Item
This single mapping does more for a fleet than any model. Engine-driven wear and chassis-driven wear accumulate at different rates on the same truck, and a schedule keyed to one number gets one of them wrong. We'll map your own signals in a demo.
The split follows published fleet guidance that engine hours help determine future oil, fuel filter and air filter changes, while mileage is the better guide for chassis, suspension and driveline components — with the recommendation to use both rather than relying on the odometer alone. SPN references are the J1939 parameter numbers commonly used for total engine hours and total vehicle distance; confirm the parameters your gateway actually exposes.
The Idle Adjustment, Worked Through
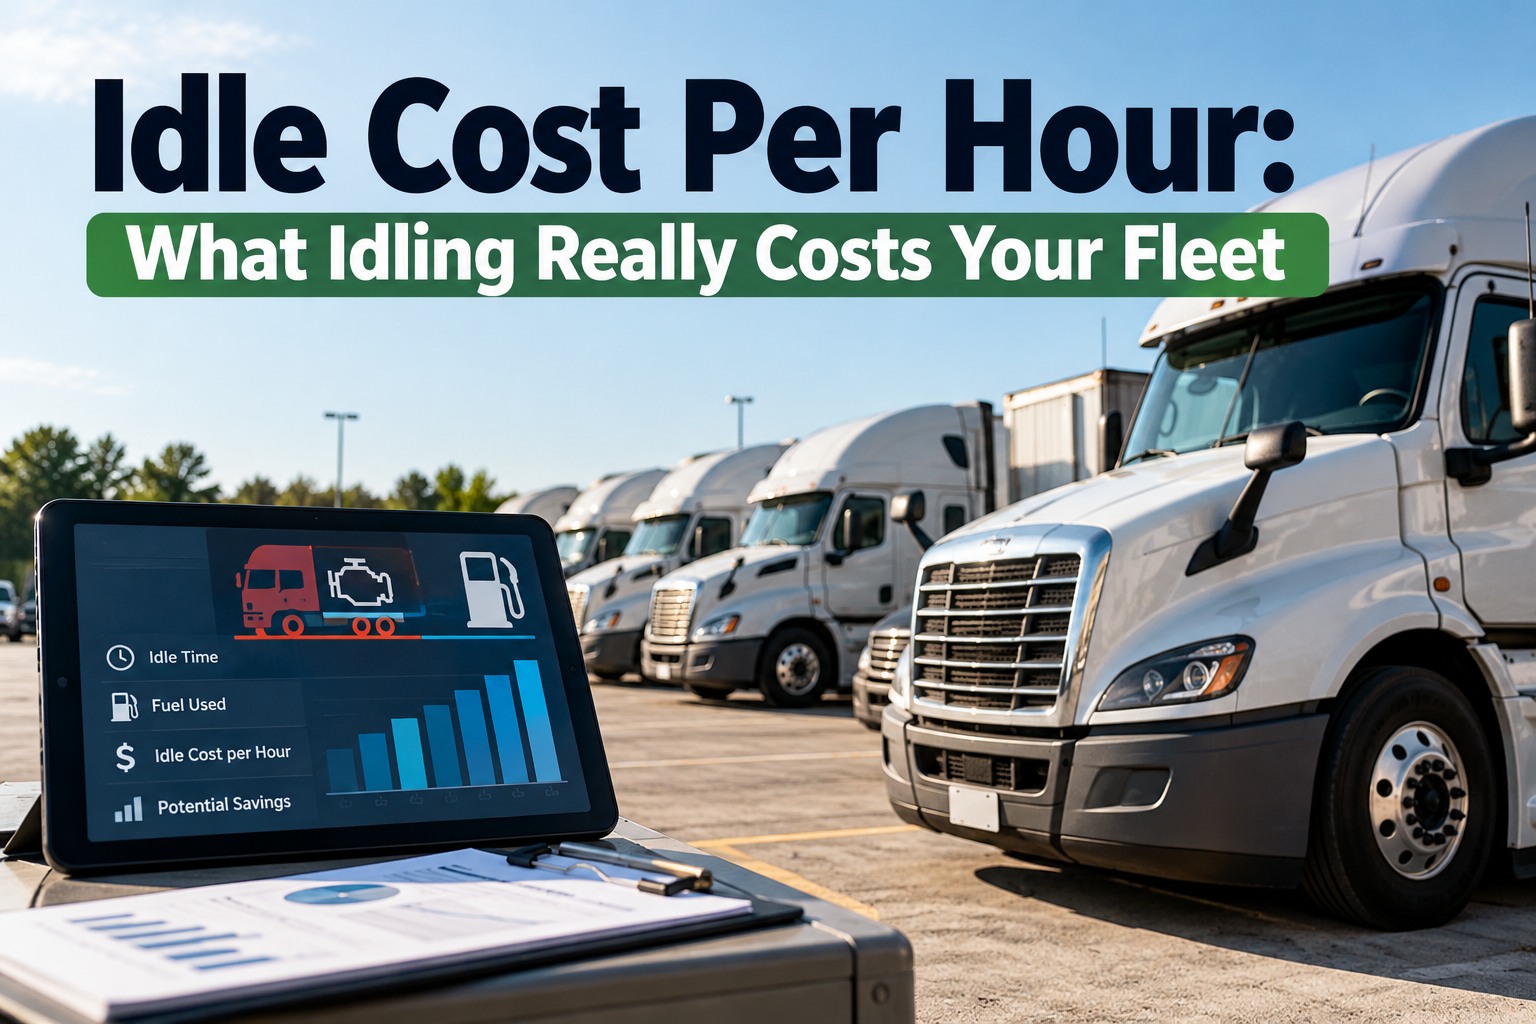
Two trucks, same odometer, same PM schedule, and one of them is 40% overdue on oil without anybody doing anything wrong. Here is the arithmetic, using the published rule that engine hours multiplied by 60 approximates equivalent miles. Set usage-driven intervals free on 3 vehicles.
Worked illustratively from the published approximation that engine hours multiplied by 60 gives approximate equivalent mileage. The same source notes that for a medium-duty engine, one gallon of fuel burned at idle is equivalent to travelling roughly 30 miles, and that a truck idling to run equipment such as a crane can use a gallon in about two hours of idling. Use these figures to size the problem, never as a substitute for the engine maker's stated interval — the point is that two identical odometers can hide very different engine wear, not that 60 is a universal constant.
Are Your PM Triggers Reading Hours, or Only Miles?
Most fleets already have the engine-hours signal arriving and simply never wired it to a schedule. In 30 minutes we'll show you PM triggered on hours, miles and idle-adjusted usage together, with inspections and compliance records against the same unit — no model required, no data science hire.
Leading and Lagging Indicators
Prediction needs signals that move before the failure. Most fleet dashboards are built almost entirely on the ones that move after it. Swipe the table on mobile.
| Signal | Type | What it buys you |
|---|---|---|
| Idle ratio climbing on one unit | Leading | Engine hours accumulating faster than miles means the engine-driven intervals are coming due sooner than the odometer suggests |
| Fuel rate drifting up at the same duty | Leading | Efficiency loss ahead of a fault code — injectors, air restriction or a dragging brake |
| Same fault code recurring and self-clearing | Leading | An intermittent that will become a hard fault. The recurrence is the signal, not the code |
| Coolant or oil temperature trending up | Leading | Cooling or lubrication degrading before any threshold trips |
| Active fault lamp | Lagging | The condition already exists. Useful, but this is detection, not prediction |
| Roadside out-of-service | Lagging | Everything upstream had a chance to catch this and did not |
| Breakdown call | Lagging | The most expensive possible way to learn about a component |
Real prognosis needs to know how the component failed last time
Prognostic assessment estimates future condition and remaining useful life, and that requires labelled history — this component, on this duty cycle, showed this pattern and then failed this way. Most fleets have work orders that say "replaced water pump" with no signal history attached, which is not a training set. The route to prediction is therefore boring and sequential: record failures against units properly, keep the signal history that preceded them, and the fourth and fifth blocks become possible in a year or two. Buying a model before you have the history just relabels threshold alerting.
Reading the Signals in Practice
Seven patterns that come up on real fleets, and what each one should change. We'll review your own signals with you. Put the results into the inspection report and into preventive maintenance so a trend becomes a booked job. Swipe the table on mobile.
| What you see | What it means | What to change |
|---|---|---|
| Engine hours running well ahead of miles | Idle-heavy or PTO duty | Move oil and filter intervals onto engine hours; leave chassis items on mileage |
| Miles running well ahead of engine hours | Sustained highway work | Mileage is the honest driver for chassis, suspension, driveline and tyres |
| One unit's fuel rate worse than its own baseline | Developing restriction or drag | Compare the unit against itself, not against the fleet average, then inspect |
| A code that sets and clears repeatedly | Intermittent fault | Count recurrences and raise an inspection on the count, not on the single event |
| A signal that stopped arriving | Device, token or harness problem | Alert on absence of data; a silent feed looks identical to a healthy truck |
| Readings that jumped after a device swap | Identity keyed to the device, not the asset | Re-key on the durable asset identity and rebuild the baseline |
| Everything normal but PM never triggers | No usage data reaching the schedule | Confirm the odometer and hours fields are actually populating the PM trigger |
What Each Rung Returns
The economics run the opposite way to the marketing: the cheap rungs return the most. Industry benchmarking puts unplanned downtime at roughly $448 to $760 per truck per day before the repair, and ATRI puts 2025 repair and maintenance cost at $0.215 per mile, up 8.6%. Work through your own numbers with our team.
Bars show relative effort and data prerequisites, longest being hardest — illustrative, not prices. The order is deliberate: the top two rows need no model and no new hardware. Downtime benchmark: FleetNet America and ATA's Technology & Maintenance Council via industry reporting; per-mile cost: ATRI.
Telematics and Maintenance Questions Fleets Ask
What is telematics data integration for maintenance?
Taking the signals a telematics system already collects — odometer, engine hours, fault codes, idle time, fuel rate — and wiring them to the things maintenance actually does: PM triggers, inspection records and work orders. The integration is the plumbing; the value is in which signal drives which schedule. See it working in a demo.
Is telematics-based predictive maintenance real?
Partly. ISO 13374 separates state detection, which is threshold alerting, from prognostic assessment, which estimates remaining useful life — and most fleet products live in the former. That is not a criticism: detection and condition-based scheduling return most of the available savings. Genuine prognosis needs a labelled failure history you have to build first. Start recording that history free.
Should PM run on engine hours or odometer miles?
Both, on different items. Engine hours are the better guide for oil, fuel filter and air filter changes; mileage is the better guide for chassis, suspension and driveline. Running everything on one number guarantees half the schedule is wrong, and on idle-heavy units the error is large. Set both in a demo.
How do I account for idle time in maintenance intervals?
Convert hours to equivalent engine miles — one published approximation is engine hours multiplied by 60 — then compare that against the odometer to get a ratio of engine work per mile driven. Divide the engine-driven interval by that ratio. A unit at 1.8× should see its oil interval come due at roughly 14,000 odometer miles rather than 25,000. Confirm against your engine maker's interval before adopting it. Log both readings per unit free.
Which telematics signals are worth acting on first?
Odometer and engine hours, because they fix the PM schedule immediately and need no analysis. Then recurring self-clearing fault codes, because the recurrence count is a leading indicator that a single code is not. Per-unit baselines for fuel rate and temperature come after that. Prioritise them with our team.
Why do my telematics alerts get ignored?
Usually because they fire on thresholds without history, so a normal-for-this-unit reading looks like a problem and a genuine drift does not. Comparing a unit against its own baseline rather than a fleet average fixes most of it. Once alerts are not trusted, the integration has effectively stopped working whether or not the data is still arriving. Build per-unit history free.
Do I need a data scientist for this?
Not for the first four rungs. Usage-driven PM, idle adjustment, recurrence counting and per-unit baselines are arithmetic and record-keeping. You need modelling only for remaining-useful-life prediction, and you cannot usefully start there because the training data is the failure history you have not collected yet. Talk through the sequence with us.
Climb the Ladder in Order and the Cheap Rungs Pay for the Rest
FleetRabbit takes telematics, ELD, dashcam and inspection data into one place, triggers PM on hours, miles and idle-adjusted usage, and keeps the signal history alongside every work order — which is exactly the labelled record that makes real prognosis possible later.
No credit card required. Start with your first connected unit.