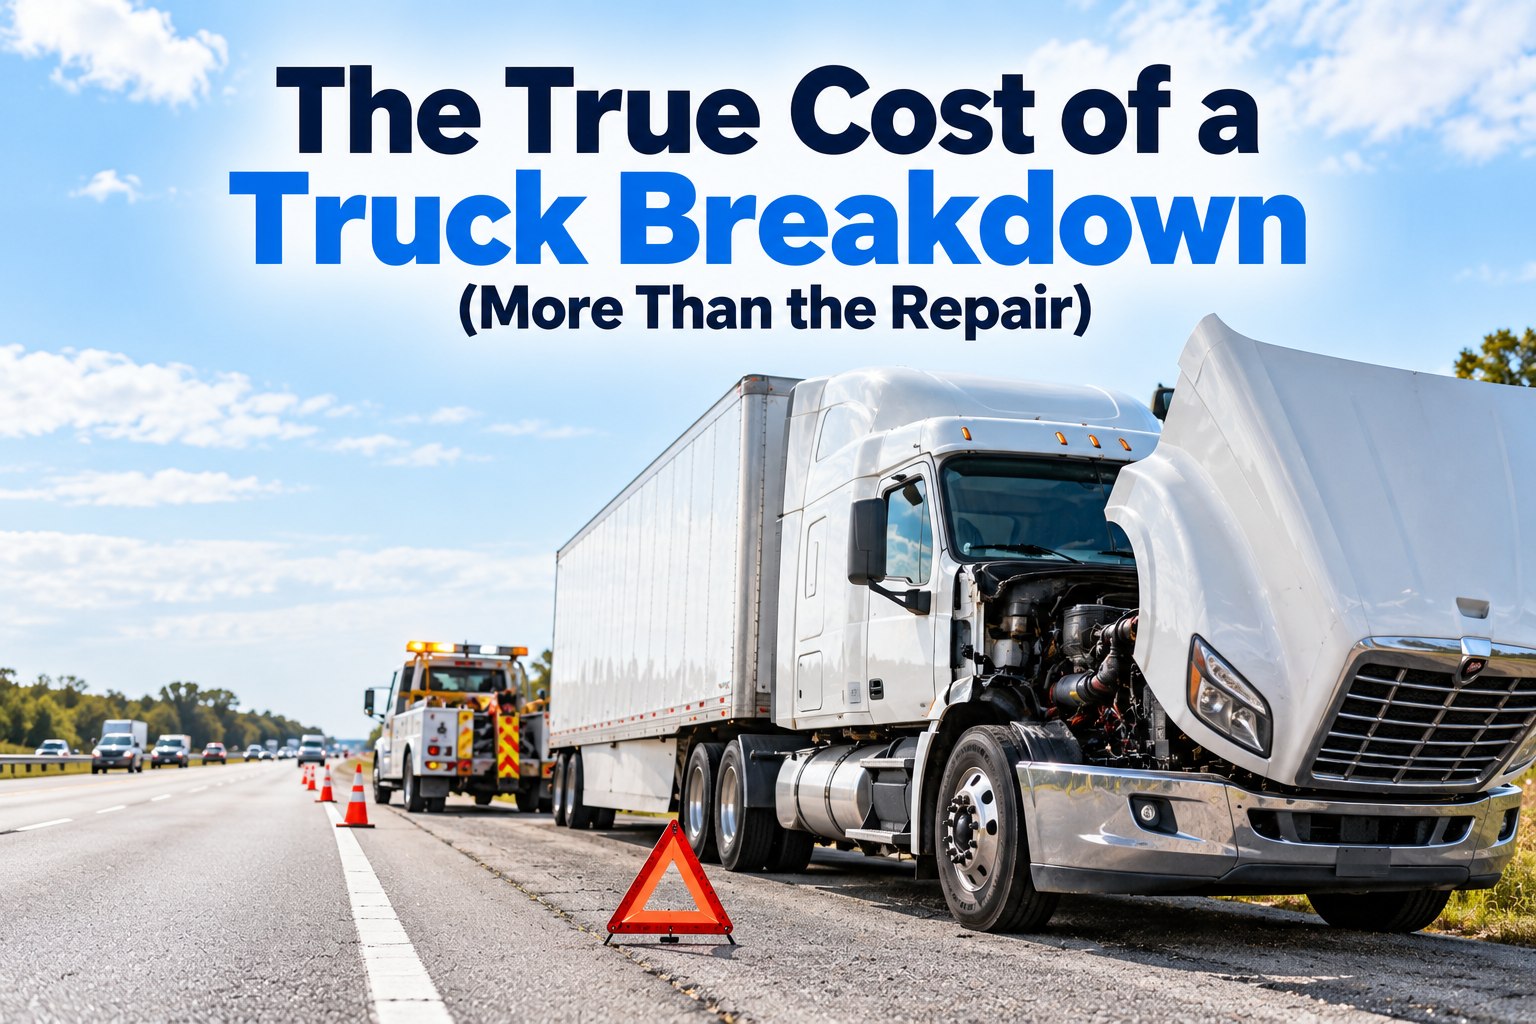
A breakdown invoice is the smallest number in the story. The parts and labour are on the bill. The tow, the missed delivery window, the day the truck earned nothing, the driver’s hotel and the load moved to another truck usually aren’t, and together they can cost more than the repair itself. FMCSA, in a 2026 rule analysis, cited industry estimates of $448 to $760 for every day a truck sits out of service. This guide breaks the true cost of a breakdown into six parts, gives the benchmarks that are actually published, sets out a formula you can fill with your own numbers, and works through an example. To see what breakdowns cost your fleet, book a short demo with our team.
The published benchmarks, and what each one actually measures
Breakdown cost figures circulate widely, and many have no traceable source. The table below uses only figures with a named origin. Treat them as ranges for sense-checking your own numbers, not as your cost.
| Cost item | Published figure | Source and scope |
|---|---|---|
| Daily cost of a truck out of service | $448 to $760 per day | Industry sources cited by FMCSA in a 2026 rule analysis; FMCSA used $800 a day to cover extra costs |
| Shipper late-arrival charges | $50 to $100 per hour | Cited in the same FMCSA analysis, or a percentage of shipment value |
| Repair and maintenance, average | 21.5 cents per mile | ATRI operating cost study, 2025; excludes towing and recovery |
| Total operating cost, average | $2.336 per mile | ATRI operating cost study, 2025 |
| Vehicles placed out of service | 19% of vehicles inspected | CVSA International Roadcheck 2026, nearly 55,000 inspections |
| Leading out-of-service category | Brakes, nearly 4 in 10 violations | CVSA International Roadcheck 2026 |
Notice what is missing. There is no reliable national figure for an average tow or an average roadside repair, because both depend on location, time of day, vehicle and how far the truck has to go. Your own invoices are a far better source than any average.
A formula for the true cost of one breakdown
Add six parts. Most fleets track the first and sometimes the second. The other four sit in dispatch, payroll, customer service and safety, which is why breakdowns usually look cheaper than they are.
The term that usually dominates is downtime. It is also the hardest to see, because a parked truck doesn’t generate an invoice. Calculate it once, carefully, and reuse it for every breakdown.
Working out what one day of downtime costs your fleet
A truck that isn’t moving still has costs that don’t stop, and it isn’t earning the margin it would have made. A daily downtime cost has two parts.
Fixed costs keep running even if no driver is assigned, so they belong in every day of downtime. Lost margin only applies if the work was actually lost; if another truck covered the load, count that truck’s extra cost instead.
Add the two and you have your daily downtime cost. Compare the result with the $448 to $760 range FMCSA cited. If yours is far outside it, check whether driver pay continues during downtime in your operation and whether lost loads were actually re-covered by another truck, because both change the answer.
The costs that arrive weeks later, on someone else’s budget
Some breakdown costs never appear on the day. A roadside out-of-service order adds a vehicle maintenance violation to the carrier’s safety record, which can raise the chance of future inspections. Customers keep on-time scorecards, and a carrier that misses windows can lose lanes at the next bid. Insurers look at loss history when they price renewals. And drivers who are repeatedly stranded in unreliable trucks start looking for other jobs, at a time when replacing a driver means recruiting, onboarding and an empty seat in the meantime.
None of these can be priced precisely for a single breakdown, and you shouldn’t invent a number for them. List them on the breakdown record anyway, as yes or no flags, so the pattern is visible when someone asks why reliability matters beyond the repair budget.
A worked example: one breakdown on a loaded reefer
A tractor pulling a loaded reefer loses an air line on the interstate on a Thursday evening. The numbers below are illustrative, but each line is a cost that fleets regularly leave off the breakdown record.
Some lines will be zero on a different breakdown. A dry van has no reefer cost; a truck that fails at the yard gate needs no tow. That is the point of the formula: it forces each line to be considered, so the ones that do apply aren’t forgotten.
In this example the repair was less than half of the total. The same air line, found on a pre-trip inspection and fixed in the yard, would have cost the part and an hour of shop time, with no tow, no late delivery and no stranded driver. That gap is what preventive work is buying.
The same repair, planned or unplanned
This is why roadside inspection data matters for cost, not only for safety. In the 2026 International Roadcheck, 19% of vehicles inspected were placed out of service, and brake problems made up nearly four in ten vehicle out-of-service violations. Many of those defects are visible on a walk-around. A driver who finds them on a digital DVIR turns an unplanned breakdown into a planned repair.
Record every breakdown the same way, or the costs stay hidden
A breakdown that is logged as a single repair invoice will always look cheap. Record the full event, so the costs can be added up per truck, per component and per year.
After a few months, patterns appear. The same component failing on one model, breakdowns clustered just after missed PM intervals, or a single truck responsible for a large share of downtime. Each points to a different fix: a parts change, tighter preventive maintenance scheduling, or a replacement decision based on that truck’s cost per mile.
Two measures that turn breakdowns into a trend you can manage
Single breakdowns are stories. A fleet needs measures that move over time. Two work well together.
Report both monthly, by truck and for the fleet. When miles between road calls rises and breakdown cost per mile falls, the maintenance programme is working. When they move the other way, the breakdown records show which trucks, components and intervals are behind it.
Breakdowns in total cost of ownership: when to repair and when to replace
Breakdown costs belong in each truck’s total cost of ownership, alongside its payments, fuel and planned maintenance. A truck can look cheap to keep because its payments are finished, while its breakdowns and downtime quietly make it the most expensive unit in the fleet per mile. Compare trucks of similar age and duty on the same measure: total cost per mile, including the full cost of every breakdown. When a truck’s figure rises well above its peers and keeps rising, the repair-or-replace question has a numeric answer rather than a gut feeling.
ATRI’s 2025 data shows repair and maintenance costs rising faster than most other categories, which makes this comparison more urgent each year. A fleet that can show the full cost of breakdowns by truck is also in a far better position to argue for a replacement budget.
Every breakdown on the truck’s record, with the inspections that could have caught it
Repairs are only half the record. Keeping every job, part and cost in fleet maintenance records is what lets you add up the true cost of a breakdown later, instead of reconstructing it from invoices.