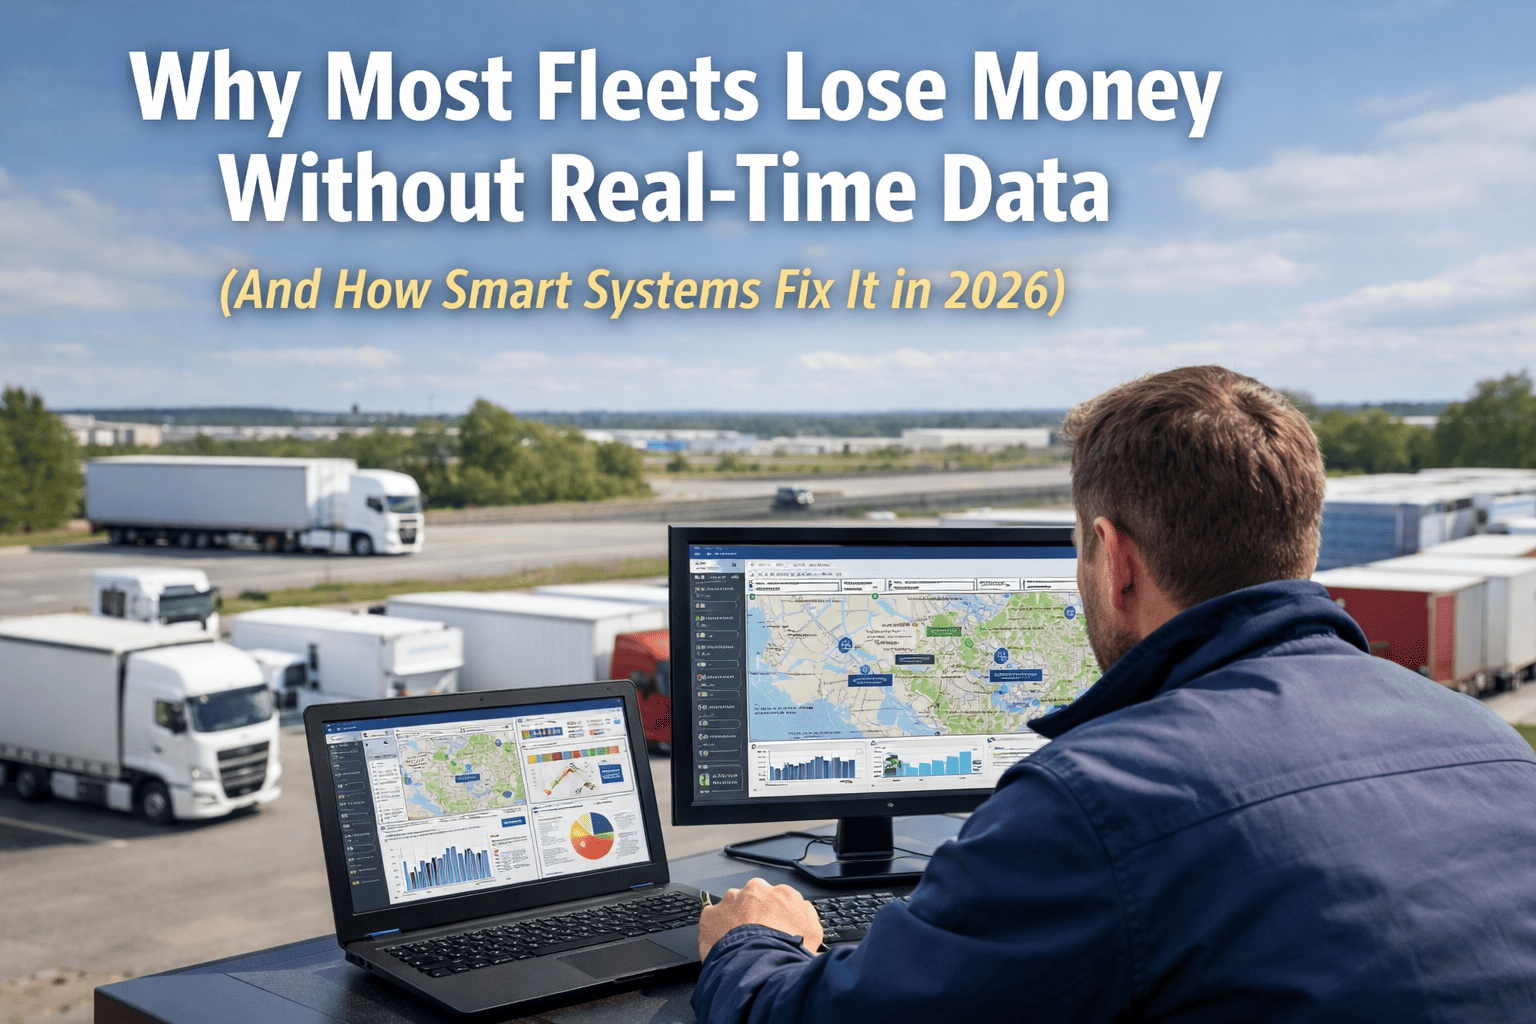
Most fleet operators don't realize how much money they are losing every month — simply because they lack real-time visibility. Not from bad decisions. Not from poor management. Simply because the data they need to act on arrives too late — or never arrives at all.
A truck idles for 45 minutes outside a distribution center. A vehicle misses its service window by three weeks and fails mid-route. A dispatcher routes a driver 22 miles out of the way because they had no idea a closer vehicle was available. None of these appear on an invoice. They show up as unexplained overruns — and theyare happening to your fleet right now.
The Hidden Cost of No Real-Time Data
These losses aren't dramatic. They're quiet. Steady. Compounding. And because there's no single moment where they become obvious, most fleet managers only discover the full scale of the damage when they do a detailed cost audit — and come away shocked.
Fleets without live fuel tracking idle 20–30% of engine-on time. That's diesel burning for zero output. Route inefficiencies add another 12–18% mileage overhead — all invisible without fleet performance data tracking.
Every idle hour burns fuel, adds engine wear, and produces zero revenue. Without real-time idle alerts, no one knows it's happening — and no one stops it. It runs quietly for months before appearing in a cost report.
Emergency repairs cost 4–5× more than scheduled service. A missed PM window becomes a roadside breakdown. A $200 service becomes a $1,400 repair — plus towing, plus a grounded vehicle during peak hours.
Dispatchers making decisions without live vehicle locations send trucks on overlapping routes, miss nearby stops, and add unnecessary mileage. A real-time fleet monitoring system surfaces the nearest available vehicle — instantly.
Why Traditional Fleet Management Fails
The tools that worked for a 10-truck fleet in 2010 are actively costing you money in 2026. Manual tracking, end-of-day reports, and Excel-based maintenance logs weren't built for the pace of modern logistics — and the gap widens every year.
Take a closer look at how real-time tracking actually works — and what it finds in the first 30 days.
What Real-Time Fleet Data Actually Means
"Real-time" is one of the most overused terms in fleet technology. Here's the practical difference between live data and delayed data — and why that difference is measured in thousands of dollars per month:
- Live GPS updated every 15–60 seconds
- Instant idle alerts the moment threshold is crossed
- Engine fault codes transmitted as they occur
- Fuel consumption tracked mile-by-mile
- Maintenance triggers on actual engine hours
- Dashboard showing fleet status right now
- Dispatch using live vehicle positions
- Location checked every few hours or on request
- Idling discovered in end-of-day reports
- Engine issues found at scheduled service
- Fuel logged manually at the pump
- Maintenance triggered by calendar — not usage
- Dashboard showing yesterday's numbers
- Dispatch based on a phone call or last known stop
Every item in the delayed column has a cost attached to it. Real-time fleet visibility software converts each of those costs into savings — automatically, continuously, across every vehicle in your fleet.
How Smart Fleet Systems Fix These Problems
Modern fleet data insights platforms don't just collect data — they convert it into operational actions before problems escalate into costs. Here's how the best systems work in practice:
How FleetRabbit Delivers This for Your Fleet
FleetRabbit is built around one principle: every fleet decision should be backed by live data, not last week's report. It connects real-time tracking, predictive maintenance, automated inspections, and performance analytics into a single platform your entire team can use from day one.
Every vehicle, driver, and alert visible in real time. Route-ready, in-service, or flagged — all at a glance before dispatch makes a single call.
Idle alerts, geofence breaches, speed violations, and maintenance triggers — routed to the right person the moment they fire, not the next morning.
Cost-per-mile, fuel efficiency, MTTR, PM compliance — all live. The fleet dashboard analytics software shows where improvement exists, not where it used to exist.
Failures flagged 14–30 days early. Work orders auto-created and scheduled off-peak. Zero surprise breakdowns. Zero unplanned downtime.
DVIR records, maintenance logs, and inspection histories stored automatically. Always timestamped, always audit-ready, never scrambled together the night before an inspection.
Month-on-month cost comparisons, fuel savings, repair reduction trends — quantified automatically so you see the return on every dollar of software spend.
Get a personalized FleetRabbit walkthrough — see your exact cost-saving opportunities in 30 minutes.
Real Business Impact — The Numbers That Matter
When logistics companies switch from manual tracking to a real-time fleet intelligence system, the results show up fast — usually within the first 60–90 days. Here's what the data consistently shows:
Idle-time monitoring and route optimization cut fuel spend within the first month of real-time deployment.
Predictive maintenance catches failures 2–4 weeks before they happen — preventing the most expensive type of downtime.
Automated reporting, digital inspections, and live dashboards eliminate hours of manual data collection every single week.
Fuel, repair, admin, and compliance savings combined — at $3/vehicle/month — deliver 20× ROI in year one alone.
Before vs After: What Changes When You Add Real-Time Data
This comparison reflects what fleet managers consistently report within 90 days of switching from manual processes to a live data platform:
| Factor | Without Data | With Real-Time Data |
|---|---|---|
| Decisions | Guesswork | Data-driven |
| Visibility | Low or none | Real-time, every vehicle |
| Cost control | High & unpredictable | Optimized and measurable |
| Fuel usage | Reviewed monthly | Monitored and alerted daily |
| Maintenance | Reactive or calendar-based | Predictive, usage-triggered |
| Idle time | Undetected 20–30% of time | Alerted in real time |
| Compliance | Pre-audit scramble | Always audit-ready |
| Monthly losses | $8,400–$14,200 hidden | Identified and eliminated |
Why Data-Driven Fleets Win in 2026
The logistics market in 2026 rewards efficiency, not effort. Two fleets running identical vehicles on identical routes will generate very different margins — based entirely on how well they can see what's happening and how fast they can act.
When a vehicle breaks down, live data identifies the nearest replacement in seconds. When a route is congested, dispatch reroutes based on live positions — not the plan made three hours ago.
Every dollar of waste becomes visible. Fleet managers stop chasing cost overruns and start preventing them — before they appear on the invoice.
Real-time visibility reveals underused vehicles, overworked routes, and avoidable inefficiencies. Rebalancing based on data consistently lifts fleet utilization by 15–25%.
Every month with a fleet data insights platform means one more month of performance data feeding smarter decisions. The gap between data-driven fleets and manual ones widens every quarter.
The difference between struggling fleets and high-performing ones comes down to visibility — start making smarter decisions today.
Every day without real-time data is another day of preventable losses. FleetRabbit gives you live tracking, predictive maintenance, automated compliance, and ROI analytics — from a single platform your team can use within two weeks.
Free demo · No commitment · Fleets of 10–500+ vehicles







