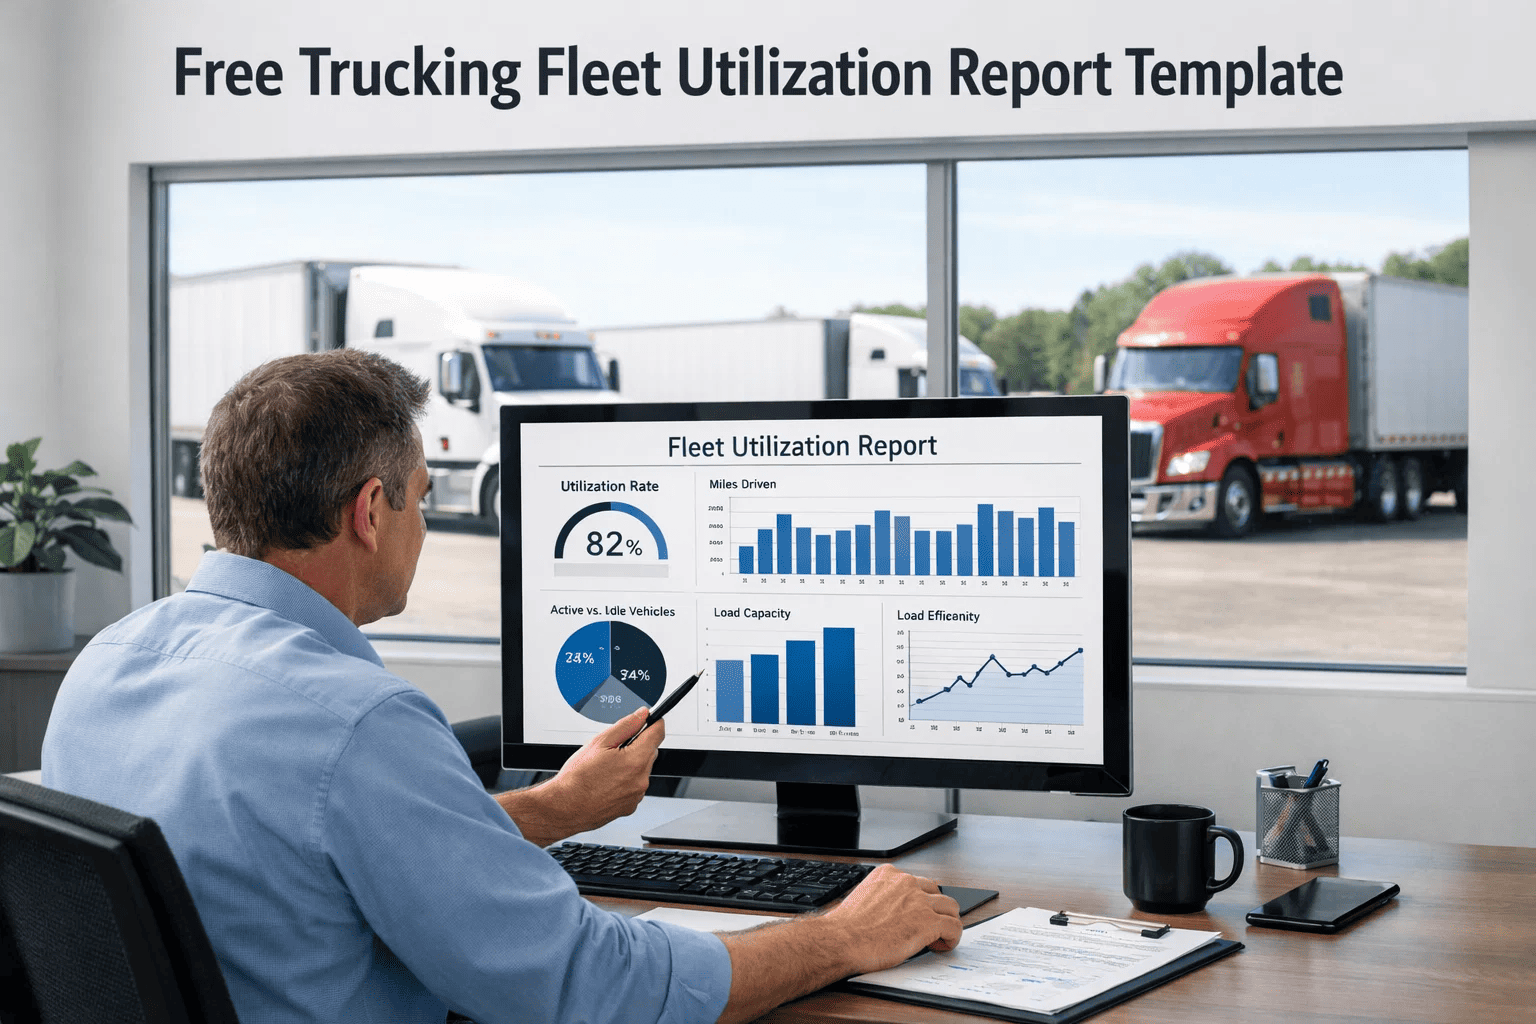
Managing a trucking fleet without visibility into utilization data is like navigating freight lanes without a GPS — you're moving, but you're not optimizing. Fleet utilization rate is one of the most powerful KPIs available to fleet managers and transportation executives, yet most fleets track it inconsistently, incompletely, or not at all. A structured fleet utilization report converts raw operational data into actionable decisions: which trucks are underperforming, which routes are inefficient, and where capital is being tied up in idle assets. FleetRabbit's fleet management platform captures every utilization data point automatically — and this free trucking fleet utilization report template gives you the reporting framework to start tracking today. Book a demo to see how FleetRabbit automates fleet utilization tracking.
Free Template — Instant Download
Trucking Fleet Utilization Report Template
A structured reporting framework for fleet managers, transportation directors, and logistics executives tracking truck productivity, idle time, and asset performance across their fleet.
78%
Avg. Fleet Utilization (Industry)
$4,200
Monthly Cost of Idle Trucks
23%
Revenue Lost to Underutilization
90%+
FleetRabbit Target Utilization
What Is a Fleet Utilization Report — And Why It Matters
A fleet utilization report measures how effectively each vehicle in your fleet is being used relative to its operational capacity. It answers questions that directly affect profitability: Is this truck generating revenue or sitting idle? Is it deployed on the right routes? Is it being maintained well enough to maximize uptime? Without a utilization report, fleet managers are making scheduling, procurement, and retirement decisions based on intuition rather than data.
Right-Size Your Fleet
Utilization data reveals whether you have too many trucks, too few, or the wrong mix — enabling smarter capital allocation and lease/purchase decisions.
Reduce Operating Costs
Idle trucks still generate insurance, depreciation, and financing costs. Identifying and redeploying underutilized assets directly reduces cost-per-mile ratios.
Improve Route Efficiency
Low utilization rates by route or region identify scheduling inefficiencies, deadhead miles, and load-matching failures that can be corrected operationally.
Maximize Asset Lifespan
Overutilized trucks accumulate wear faster. Distributing mileage evenly across the fleet through utilization tracking extends vehicle service life and reduces early replacement costs.
Strengthen Executive Reporting
Transportation VPs and CFOs require utilization metrics for quarterly reviews, investor reporting, and lender covenant compliance. A structured report delivers the data in a presentable format.
Benchmark Fleet Performance
Utilization reports allow month-over-month and year-over-year comparisons — identifying seasonal patterns, improvement trends, and performance regression early.
Template Structure — What to Include in Every Utilization Report
A professional fleet utilization report requires consistent data fields across every vehicle entry. Below is the complete reporting structure FleetRabbit recommends — and automatically populates for fleets using the platform's real-time tracking and reporting module.
Section 1 — Fleet Summary Dashboard
Overall Fleet Utilization Rate
87.4%
81.2%
90%
−2.6%
Total Active Vehicles
48
48
48
0
Vehicles Below 70% Utilization
6
9
0
↓ 3
Average Idle Time Per Vehicle
3.2 hrs/day
4.1 hrs/day
<2 hrs/day
+1.2 hrs
Total Revenue Miles This Period
182,440 mi
164,310 mi
190,000 mi
−7,560 mi
Deadhead (Empty) Miles
14.2%
18.6%
<12%
+2.2%
Section 2 — Vehicle-Level Utilization Detail
TR-101
J. Martinez
94%
4,210 mi
1.8 hrs
0 days
Active
TR-108
R. Patel
62%
2,760 mi
5.4 hrs
3 days
Review
TR-115
D. Thompson
43%
1,920 mi
7.1 hrs
7 days
Flag
↑ Repeat for all vehicles. FleetRabbit generates this section automatically for all active units.
Section 3 — Downtime Cause Analysis
Compliance / Regulatory Hold6%
How FleetRabbit Automates Fleet Utilization Reporting
The template above requires data collection, manual entry, and regular formatting — a process that takes fleet managers hours every reporting cycle. FleetRabbit eliminates manual data aggregation entirely by capturing every utilization metric automatically through GPS tracking, telematics integration, dispatch scheduling, and maintenance records — then generating the complete utilization report on demand.
01
Real-Time GPS & Engine Data Capture
Every vehicle's location, engine status, idle time, and mileage is recorded continuously via GPS telematics. No manual odometer readings, no driver-reported hours.
02
Automatic Revenue vs. Non-Revenue Mile Classification
FleetRabbit classifies miles as loaded (revenue), deadhead (empty), or non-operational — giving accurate utilization rates without manual route coding.
03
Downtime Tagging & Maintenance Integration
Downtime events are automatically tagged to maintenance records, work orders, or scheduling gaps — so your utilization report includes cause analysis without manual research.
04
On-Demand Report Generation
Fleet managers generate a complete, formatted utilization report for any time period, vehicle set, or route segment from the FleetRabbit dashboard — in under 2 minutes.
Key Metrics Every Fleet Utilization Report Must Include
Productivity Metrics
Vehicle Utilization Rate (%)
Revenue Hours ÷ Available Hours × 100
Target: ≥ 85%
Revenue Miles per Vehicle
Total Loaded Miles per Reporting Period
Track monthly per unit
Deadhead Mile Percentage
Empty Miles ÷ Total Miles × 100
Target: < 15%
Loads Completed per Truck
Deliveries Completed ÷ Active Units
Benchmark to fleet average
Availability Metrics
Fleet Uptime Rate (%)
Operational Days ÷ Total Scheduled Days × 100
Target: ≥ 95%
Average Daily Idle Hours
Total Engine-On Non-Moving Hours ÷ Active Days
Target: < 2 hrs/day
Maintenance Downtime Days
Days Vehicle Unavailable Due to Repair
Track per unit per quarter
Out-of-Service Rate (%)
Out-of-Service Days ÷ Total Fleet Days × 100
Target: < 5%
Financial Efficiency Metrics
Cost per Revenue Mile
Total Operating Costs ÷ Revenue Miles
Benchmark: $1.80–$2.40 / mile
Revenue per Available Truck Day
Total Revenue ÷ (Active Units × Available Days)
Track monthly trend
Idle Fuel Cost
Total Idle Hours × Fuel Burn Rate × Fuel Price
Industry avg: $0.80/hr at idle
Asset Turn Ratio
Revenue Generated ÷ Fleet Asset Value
Track quarterly for capital efficiency
How FleetRabbit Turns Utilization Data Into Fleet Decisions
Utilization data is most valuable when it's connected to action. FleetRabbit's fleet intelligence layer converts raw utilization numbers into specific operational recommendations — surfaced automatically in the fleet manager dashboard so decisions can be made faster and with higher confidence.
Low Utilization Alert (<70%)
→
Automatic Fleet Manager Notification
FleetRabbit alerts fleet managers when any vehicle falls below the utilization threshold for 3+ consecutive days — prompting reassignment or maintenance review before costs accumulate.
Excessive Idle Time (>3 hrs/day)
→
Driver Coaching Flag + Route Review
High idle time alerts flag the specific driver, location, and time window — enabling targeted coaching discussions and route timing adjustments that reduce idle fuel cost immediately.
Chronic Downtime Pattern (>10 days/qtr)
→
Vehicle Retirement or Early Replacement Signal
FleetRabbit's utilization trend analysis identifies vehicles whose downtime costs have exceeded the value of continued operation — providing the data needed for defensible asset replacement decisions.
Deadhead Rate >20%
→
Load Planning Optimization Trigger
Persistently high deadhead rates surface in utilization reports as a scheduling inefficiency — prompting load planning review, backhaul matching analysis, and lane optimization with freight partners.
FleetRabbit Fleet Intelligence
Replace Manual Reports With Real-Time Fleet Utilization Dashboards
FleetRabbit captures every utilization metric automatically — GPS data, idle time, maintenance downtime, revenue miles — and delivers formatted reports to fleet managers and executives in real time.
90%+
Utilization Rate Achieved
2 min
Report Generation Time
Common Fleet Utilization Mistakes — And How to Avoid Them
Mistake 1
Tracking Mileage Instead of Revenue Hours
Mileage alone doesn't capture utilization accurately — a truck completing a 600-mile round trip in 8 hours is utilized differently than one taking 18 hours for the same route. FleetRabbit tracks both mileage and time-based utilization to give a complete productivity picture.
Mistake 2
Reporting Fleet Average Without Vehicle-Level Data
A fleet average of 82% utilization can mask three trucks running at 40% while the rest exceed targets. Vehicle-level detail is essential for identifying the specific assets dragging down performance.
Mistake 3
Not Including Downtime Cause Classification
Downtime is only actionable when you know why it occurred. A report that shows 7 downtime days without noting maintenance, scheduling, or driver availability as the cause provides no path to improvement.
Mistake 4
Monthly Reporting Frequency
Monthly utilization reports identify problems too late to course-correct within the period. FleetRabbit provides real-time utilization visibility so managers can act on underperforming assets in days, not weeks.
Mistake 5
Excluding Financial Impact Calculations
A utilization report that only shows percentages without connecting to revenue impact or cost-per-mile misses the business case for action. Financial metrics translate utilization data into executive-level decision support.
Frequently Asked Questions
QWhat is a good fleet utilization rate for trucking companies?
Industry benchmarks suggest that a well-managed trucking fleet should target 85–90% vehicle utilization during active periods. Utilization rates below 70% consistently indicate scheduling inefficiencies, excess fleet capacity, or chronic maintenance issues. FleetRabbit-managed fleets typically achieve 88–93% utilization through real-time dispatch optimization and proactive maintenance scheduling.
QWhat data points does the template require to be filled out accurately?
The template requires: vehicle unit number, driver assignment, available hours or days per period, revenue hours or miles, idle hours, maintenance downtime days, deadhead miles, and total operating costs. FleetRabbit automatically collects all of these data points from telematics, dispatch records, and maintenance logs — eliminating manual data gathering.
QHow often should fleet utilization reports be generated?
Operational-level utilization tracking should be reviewed at minimum weekly, ideally in real time. Monthly summary reports are appropriate for executive-level reporting and capital planning decisions. FleetRabbit provides continuous utilization dashboards for fleet managers and scheduled summary reports for leadership teams — eliminating the need to manually generate reports at any frequency.
QHow does FleetRabbit integrate with existing dispatch or TMS systems?
FleetRabbit integrates with major Transportation Management Systems (TMS) and dispatch platforms via API connections, enabling utilization data to be enriched with load, customer, and revenue information from your existing systems. Integration typically configures in hours, not weeks, with full technical support from the FleetRabbit implementation team.
Book a demo to discuss your integration requirements.
QCan the template be adapted for different vehicle types within the same fleet?
Yes — the template structure accommodates mixed fleets with distinct vehicle categories (dry van, reefer, flatbed, tanker, straight truck). FleetRabbit supports custom vehicle classifications and generates separate utilization summaries for each vehicle type, enabling accurate apples-to-apples comparisons across different operational roles within the fleet.
Stop Guessing. Start Optimizing. FleetRabbit Fleet Utilization Intelligence.
FleetRabbit automatically tracks every utilization metric across your entire fleet — delivering real-time dashboards, on-demand executive reports, and AI-driven recommendations that help transportation managers optimize asset performance, reduce idle costs, and make capital decisions with confidence.
Real-Time GPS Tracking
Automated Utilization Reports
Idle Time Alerts
Downtime Cause Analysis
Executive Dashboard
April 9, 2026
By Nathan Smith
All Posts