Commercial trucking accident costs extend far beyond vehicle repair and medical expenses. A single preventable collision costs a carrier an average of $91,000 in direct expenses and when litigation, insurance premium increases, lost productivity, and regulatory scrutiny compound over the following 24 months, total incident cost regularly exceeds $400,000. The fleets achieving the lowest accident rates in their operational categories are not operating different vehicles on different roads — they are leveraging collision avoidance technology and proximity alert systems that prevent the driver behavior patterns and situational awareness failures responsible for the majority of preventable commercial vehicle accidents. FleetRabbit's driver safety platform integrates collision avoidance monitoring, proximity alerts, and behavior-based coaching into a unified prevention framework — giving fleet managers the tools to reduce accident risk systematically rather than responding after incidents occur. Book a demo to see FleetRabbit's collision avoidance and safety monitoring capabilities.
Fleet Safety Guide
Collision Avoidance and Proximity Alerts in Trucking: Technology, Implementation, and the Driver Behavior Framework That Prevents Commercial Vehicle Accidents
FLEET SAFETY & ACCIDENT PREVENTION
Collision Avoidance and Proximity Alert Systems: The Fleet Safety Infrastructure That Prevents the Accidents Reactive Programs Cannot
Reactive safety management — reviewing incidents after they occur, coaching after violations accumulate, investigating after accidents happen — cannot prevent the next collision. Proactive safety infrastructure that detects risk patterns before incidents occur, alerts drivers in the moment of elevated danger, and enables targeted coaching on specific high-risk behaviors is the only framework that systematically reduces accident frequency and severity.
$91K
Average direct cost per preventable commercial vehicle accident
72%
Of commercial vehicle accidents are preventable through driver behavior intervention
40–55%
Accident rate reduction achievable with systematic collision avoidance programs
8–15%
Insurance premium reduction for fleets with documented safety technology programs
The Root Causes of Commercial Vehicle Collisions — And Why Technology Addresses Each One
The Problem
Drivers maintain insufficient following distance, particularly at highway speeds with heavy loads. A loaded Class 8 truck at 65 mph requires 525 feet to stop safely — nearly the length of two football fields. Following distances of 150 to 200 feet that drivers perceive as adequate are insufficient by a factor of 2.5 to 3.5 under emergency braking conditions. Tailgating is the single largest contributor to preventable commercial vehicle rear-end collisions.
How FleetRabbit Addresses It
FleetRabbit's telematics-based following distance monitoring calculates headway time (seconds of following distance) continuously. When following distance drops below 3 seconds at highway speeds or 2 seconds at lower speeds, alert logged and driver receives in-cab notification. Persistent following distance violations by specific drivers flagged for coaching session with event-specific data evidence.
The Problem
Fatigued driving impairs reaction time, decision-making, and situational awareness to a degree comparable with alcohol impairment at 18 consecutive hours of wakefulness. HOS regulations exist specifically to limit fatigue exposure — but without real-time monitoring, drivers operating near HOS limits continue driving beyond safe fatigue thresholds, particularly under delivery pressure from dispatch or customer time windows.
How FleetRabbit Addresses It
FleetRabbit's ELD provides real-time HOS status visibility to both drivers and dispatch. Pre-violation alerts notify drivers and safety managers when approaching HOS limits — creating intervention opportunity before violations occur. Dispatch visibility into driver HOS availability prevents assignment of routes that require HOS violations to complete. Fatigued driving risk is addressed structurally, not individually.
The Problem
Speed above posted limits and speed inappropriate for road conditions (construction zones, adverse weather, curves, intersections) dramatically increases both accident likelihood and accident severity. A commercial vehicle collision at 75 mph delivers 33 percent more kinetic energy than the same collision at 65 mph — directly affecting injury severity even when the accident itself is unavoidable.
How FleetRabbit Addresses It
FleetRabbit's GPS speed monitoring compares vehicle speed against road class speed limits continuously. Speed violations logged by duration, magnitude above limit, and road class — enabling differentiated coaching between highway speed marginally above limit and sustained excessive speed in school zones. Speed violation trends by driver and route provide the data infrastructure for targeted, documented coaching interventions.
The Problem
Hard braking events indicate a pattern of situational awareness deficits — drivers not reading traffic conditions far enough ahead to adjust speed smoothly. Statistically, drivers with hard braking event rates above 3.0 per 100 miles are three times more likely to be involved in a preventable accident than drivers with rates below 1.0 per 100 miles. Hard braking is a leading indicator of collision risk, not just an efficiency concern.
How FleetRabbit Addresses It
FleetRabbit's accelerometer monitoring captures hard braking events at configurable threshold levels. Event data includes timestamp, location, speed at event, and severity. Coaching sessions that present specific event data — "Tuesday at 3:47 PM on Route 9 northbound, you braked at 0.45g while traveling at 62 mph" — produce behavior change at significantly higher rates than aggregate score presentations.
How FleetRabbit's Proximity Alert System Works
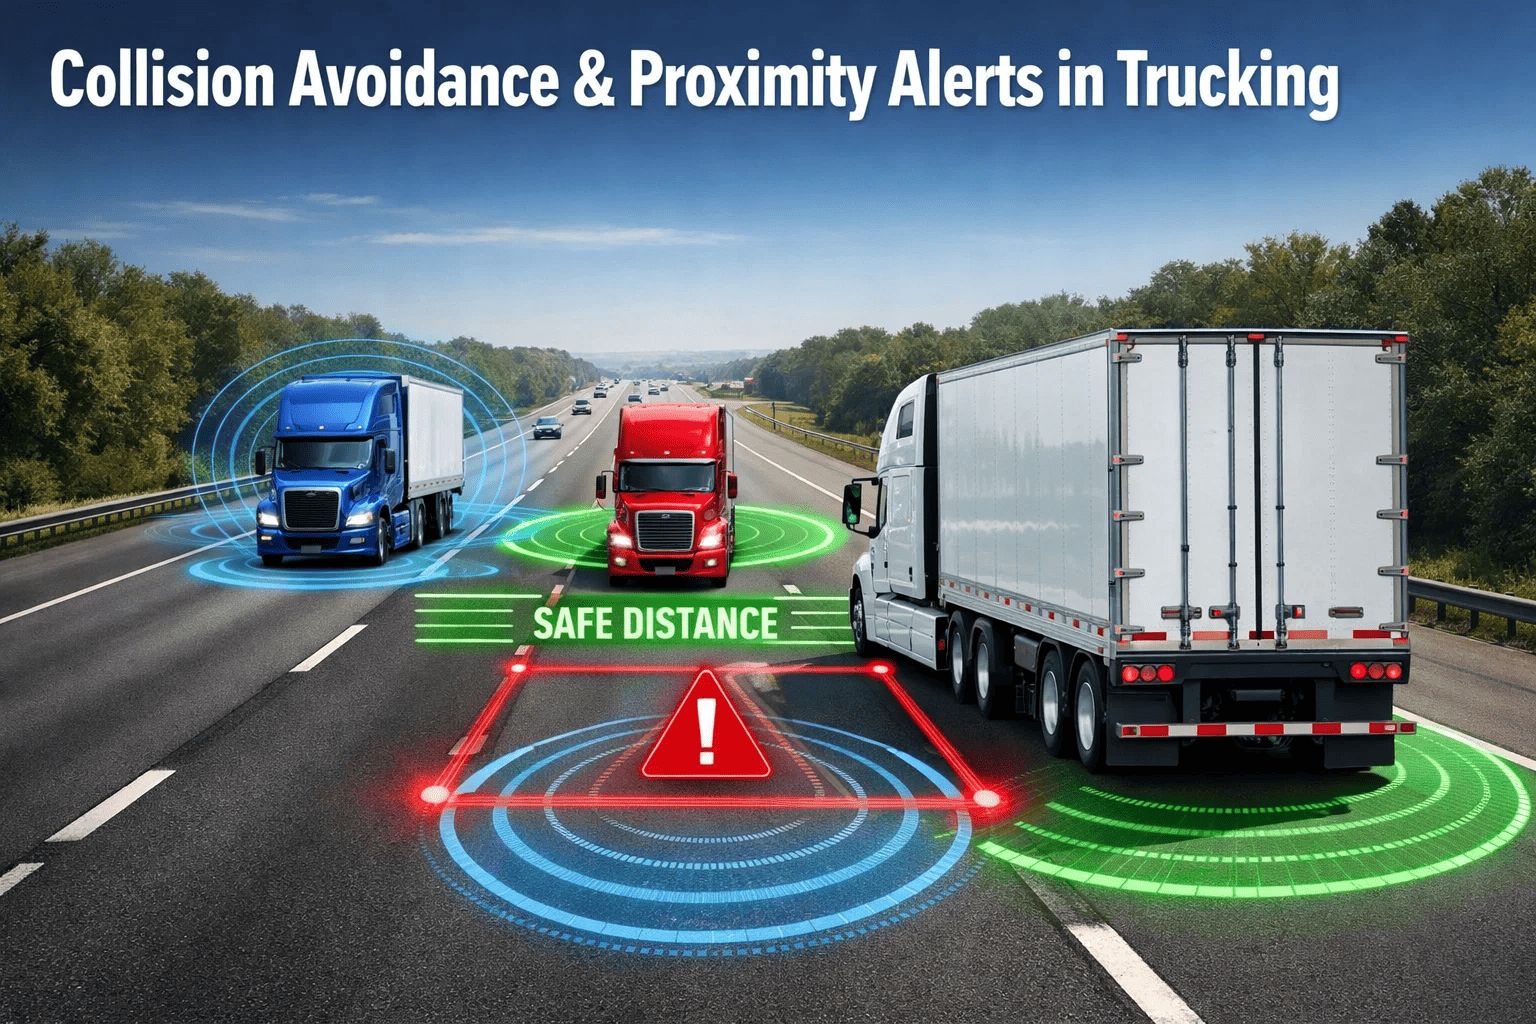
Proximity alerts extend collision avoidance from behavioral coaching into real-time situational awareness support — providing drivers with active alerts when vehicle proximity, speed, and road conditions create elevated collision risk. FleetRabbit's proximity monitoring framework operates at three levels, each calibrated to alert severity appropriate for the risk level detected.
In-cab gentle notification. Driver prompted to increase following distance. Event logged for pattern analysis — three advisory events within a single shift flag driver for proactive coaching contact.
Elevated in-cab alert. Event logged with full telemetry data including surrounding traffic context. Safety manager notified of warning-level proximity events within the shift for same-day follow-up.
Immediate alert. Safety manager notified in real time. Event flagged for mandatory coaching session before driver's next shift assignment. Persistent critical-level events trigger formal safety improvement plan activation.
Building a Collision Avoidance Program — Not Just Installing Technology
Step 1
Establish Driver Safety Baselines
Deploy FleetRabbit monitoring for 30 days without coaching intervention to establish accurate behavioral baselines for each driver. Baseline data reveals which drivers are already performing well, which require targeted coaching, and which represent urgent safety concerns requiring immediate intervention. Without baseline data, coaching programs apply uniform interventions to non-uniform risk profiles — wasting management attention and reducing coaching credibility with drivers who have strong existing performance.
Step 2
Communicate Standards and Data Transparency
Drivers who understand exactly what is monitored, how data is used, and what performance standards apply perform significantly better than those operating under undefined surveillance. FleetRabbit's driver portal gives each driver access to their own performance data — creating transparency that reduces resistance, enables self-monitoring, and demonstrates the fairness of data-backed coaching compared to subjective supervisor observation.
Step 3
Implement Event-Based Coaching, Not Score-Based Reviews
Safety improvement comes from coaching specific events with specific data, not from presenting aggregate safety scores and asking drivers to improve them. "Your safety score was 72 last month" produces minimal behavior change. "On Thursday at 2:34 PM on I-78 westbound, you maintained 1.8 seconds of following distance at 68 mph for 4.2 minutes" produces specific, actionable coaching conversations that drivers can act on precisely.
Step 4
Link Safety Performance to Recognition and Consequences
Safety programs that track data but apply no structured consequences or recognition produce initial modest improvement followed by performance regression as driver attention shifts. Top-performing safety programs link specific safety performance thresholds to structured recognition programs for strong performers and progressive intervention for persistent high-risk behavior patterns. FleetRabbit's performance management module provides the data infrastructure for both sides of this framework.
Step 5
Track Trend Metrics, Not Just Point-in-Time Scores
A driver with a 78 safety score trending up from 58 over 60 days is a coaching success story. A driver with an 82 safety score trending down from 94 is an emerging safety concern. Point-in-time scores without trend context lead to misallocated coaching attention — neglecting improving drivers who need reinforcement and missing declining drivers who need intervention. FleetRabbit's trend analytics display performance trajectory alongside current scores for every driver.
Insurance Cost Impact of Documented Collision Avoidance Programs
Commercial auto insurance pricing for trucking fleets is increasingly data-driven. Carriers offering behavioral data discount programs provide 8 to 18 percent premium reductions for fleets with documented telematics programs, verified safety score improvement, and demonstrated commitment to driver behavior management. The documentation FleetRabbit generates — complete with trend data, coaching session logs, and CSA score history — satisfies the evidentiary requirements of most carrier discount programs.
CSA Score Improvement Documentation
FleetRabbit generates compliance and safety performance trend reports in formats accepted by insurance underwriters for premium review submissions. CSA score improvement documented over 12 to 24 months is the primary qualification criterion for rate adjustment consideration.
Accident Causation Documentation
When accidents do occur, FleetRabbit's complete telematics event record provides objective evidence of driver behavior in the period preceding the incident — documenting whether collision avoidance protocols were followed. This documentation reduces "driver negligence" findings in litigation by providing objective behavioral context that supports or refutes specific liability claims.
Preventive Program Verification
Insurance carriers increasingly require documented evidence that behavioral monitoring data results in coaching interventions — not just data collection. FleetRabbit's coaching session logging, tied to specific behavior events with documented follow-up, satisfies program verification requirements that pure telematics data collection cannot.
Frequently Asked Questions: Collision Avoidance and Proximity Alerts
QHow do drivers typically respond to proximity alert and behavior monitoring systems?
Driver response to monitoring systems is almost entirely determined by how the program is introduced and how data is used. Fleets that introduce monitoring as surveillance typically experience resistance, morale impact, and driver turnover among high-performing drivers who resent being monitored alongside lower-performing colleagues without differentiation. Fleets that introduce monitoring as a performance and safety tool with driver data access, transparent standards, and recognition for strong performance experience positive driver response and support. The technology is identical; the implementation approach is the determining factor.
QHow long does it take to see measurable accident rate reduction after deploying FleetRabbit safety monitoring?
Leading indicator safety metrics — hard braking events, following distance violations, speed compliance — typically show measurable improvement within 30 to 45 days of consistent monitoring and coaching. Accident frequency reduction, as a lagging metric, requires 90 to 180 days of monitoring data before statistically significant changes are observable against baseline. Fleets that implement the full behavioral coaching program framework — not just monitoring — see 30 to 45 percent reductions in preventable accident rates within 12 months of deployment.
QCan proximity alert data be used in accident litigation?
Telematics data is increasingly being sought in commercial vehicle accident litigation by both plaintiff and defendant parties. FleetRabbit's complete event records — GPS position, speed, acceleration, braking, and HOS status at and before incident time — provide objective behavioral documentation that courts and insurance adjusters treat as highly credible evidence. Your legal team should be aware that this data is discoverable in litigation, meaning it can be requested by opposing counsel. The data works in your favor when your safety program produces the behavioral compliance it is designed to produce.
QWhat is the relationship between HOS compliance and collision avoidance?
HOS compliance and collision avoidance are inseparable from a safety outcome perspective. Fatigued drivers have the same physiological impairment as moderate alcohol intoxication — slower reaction time, reduced hazard perception, and diminished decision-making capacity. FleetRabbit's integrated ELD and safety monitoring platform treats HOS compliance as a safety behavior — not just a regulatory compliance requirement. Drivers approaching HOS limits receive pre-violation alerts that serve simultaneously as fatigue risk warnings and compliance management tools.
The commercial vehicle accidents that generate the largest costs, the most severe injuries, and the most damaging regulatory consequences are not random events — they are the predictable outcomes of specific behavioral risk patterns that technology can detect, monitor, and systematically reduce through data-backed intervention. Proximity alert systems and collision avoidance monitoring do not eliminate driver judgment from the equation; they provide drivers and fleet managers with the situational awareness and behavioral data that make better judgment possible, more consistently, across every driver and every shift.
FleetRabbit's safety platform converts behavioral data into coaching conversations, coaching conversations into improved driving patterns, and improved driving patterns into measurable reductions in accident frequency, insurance costs, and regulatory exposure — building a compounding safety advantage that strengthens every month the program operates.
Build a Collision Avoidance Program That Actually Reduces Accidents
FleetRabbit's driver safety platform delivers proximity monitoring, behavior event logging, coaching data infrastructure, and compliance integration in one unified system — giving safety managers and fleet executives the tools to reduce preventable accident rates by 40 to 55 percent within 12 months of full deployment.
Proximity Alert Monitoring
Hard Braking Detection
HOS Fatigue Prevention
Event-Based Coaching
Insurance Documentation
April 15, 2026
By Nathan Smith
All Posts