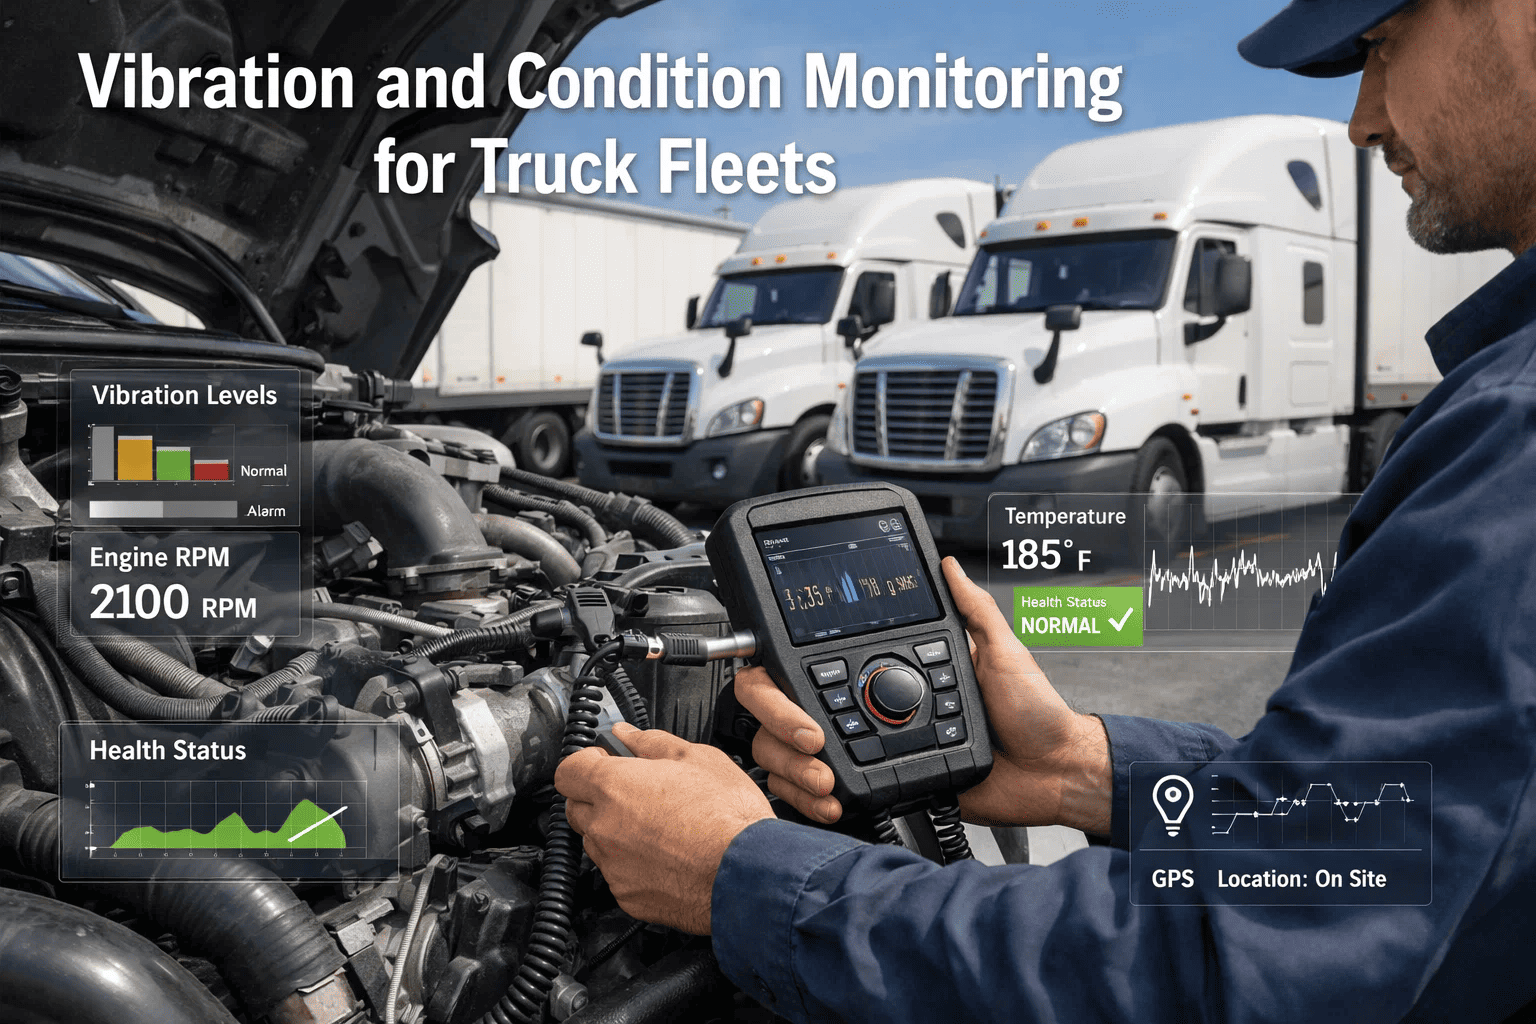
Fleet managers overseeing large commercial truck fleets face a silent operational threat: mechanical degradation that starts weeks before a catastrophic breakdown. Vibration anomalies, bearing fatigue, suspension stress, and drivetrain wear all follow detectable patterns — yet most fleets only discover these patterns after a truck is already off the road. FleetRabbit's condition monitoring platform gives fleet managers and executives the real-time diagnostic visibility to detect, trend, and act on equipment degradation before downtime occurs. Book a demo to see how FleetRabbit's vibration and condition monitoring prevents truck breakdowns before they happen.
Analytics Guide
Vibration and Condition Monitoring for Truck Fleets: How FleetRabbit Turns Sensor Data Into Breakdown Prevention
FLEET ANALYTICS & CONDITION MONITORING
Stop Diagnosing Breakdowns After They Happen — Start Detecting Failures Weeks in Advance
Every unplanned truck breakdown that sidelines a vehicle for 2–5 days costs your operation $8,500–$22,000 in lost revenue, emergency repairs, and driver displacement. Vibration and condition monitoring transforms that reactive cycle into a systematic, data-driven approach — detecting wear signatures before failure and scheduling service during planned windows, not during critical hauls.
74%
of truck failures show detectable vibration signatures 3–6 weeks before breakdown
$22K
average cost per unplanned breakdown including downtime and emergency logistics
68%
reduction in unplanned downtime achieved by fleets using real-time condition monitoring
Why Vibration Analysis Is the Most Powerful Early Warning System for Truck Fleets
Commercial trucks generate vibration signatures that are highly specific to mechanical condition. A healthy drivetrain at highway speed produces consistent, low-amplitude vibration within predictable frequency ranges. As components degrade — wheel bearings wear, driveshaft balance shifts, suspension bushings collapse — those vibration signatures change in measurable, trackable ways.
Fleet managers who rely solely on driver reports and scheduled inspections miss the narrow window between detectable early degradation and catastrophic failure. Drivers adapt to gradual changes and underreport subtle symptoms. Scheduled inspections occur at fixed intervals regardless of actual component condition. The result: mechanical problems that could have been addressed with a $600 bearing replacement escalate into $18,000 engine or transmission replacements.
FleetRabbit integrates vibration sensor data from telematics and OEM systems into a continuous monitoring platform that trends component health over time, compares readings against fleet baselines, and generates actionable maintenance recommendations — not raw data dumps that require specialist interpretation.
What Vibration Monitoring Detects in Commercial Trucks
Wheel bearing wear and race fatigue before seize
Driveshaft imbalance and u-joint degradation
Suspension bushing collapse and spring fatigue
Tire cupping, flat spotting, and out-of-round conditions
Engine mount deterioration and harmonic imbalance
Transmission gear wear and bearing preload loss
Brake rotor warping and caliper drag signatures
Fifth wheel coupling looseness and kingpin wear
The Hidden Cost Structure of Reactive Maintenance in Trucking
Component Replacement
Full assembly replacement on catastrophic failure — $3,200–$8,500
Targeted component swap before failure — $400–$900
Downtime Duration
2–5 days roadside plus tow and shop backlog
4–8 hours planned shop visit during off-peak
Load Disruption
Emergency load transfer, shipper penalties, customer relationship damage
Scheduled service during low-volume windows — zero disruption
Secondary Damage
Bearing seize destroys hub, rotor, half-shaft — cascading repair costs
Bearing replaced before seize — no cascade damage
Driver Safety Risk
Failure at highway speed — accident risk, liability exposure
Addressed in shop — zero safety incident risk
How FleetRabbit's Condition Monitoring Platform Works
FleetRabbit doesn't simply display raw sensor readings. The platform applies fleet-specific baseline analytics, cross-references component age and service history, and delivers interpreted maintenance recommendations directly to fleet managers and maintenance supervisors. Below is the complete diagnostic workflow that powers FleetRabbit's condition monitoring for transportation and logistics fleets.
01
Data Ingestion From Multiple Sources
FleetRabbit aggregates vibration and condition data from OEM telematics systems, aftermarket sensor arrays, GPS telematics platforms, and driver DVIR submissions. All data streams normalize into a unified equipment health profile per vehicle — no manual data consolidation required from your maintenance team.
02
Fleet Baseline Establishment
During the first 4–6 weeks, FleetRabbit establishes baseline vibration profiles for each truck under your specific operating conditions — route types, payload ranges, ambient temperature variations, and typical speed profiles. Baselines are established per vehicle class and route profile, not generalized industry averages. This fleet-specific calibration dramatically reduces false alerts.
03
Continuous Trend Analysis
The platform monitors vibration amplitude, frequency spectrum shifts, and acceleration anomalies continuously. Rather than threshold-only alerts, FleetRabbit tracks rate of change. A bearing vibration reading slightly above baseline but stable warrants monitoring. The same reading trending upward 8% week-over-week triggers a maintenance recommendation with a specific projected failure window.
04
Interpreted Alert Generation
When condition data crosses predictive thresholds, FleetRabbit generates actionable alerts — not raw data notifications. Fleet managers receive vehicle identification, suspected component, severity classification, projected failure timeline, recommended action, and estimated cost difference between proactive and reactive repair. No specialized data interpretation skills required from your team.
05
Maintenance Work Order Integration
Condition-based alerts automatically generate or recommend work orders within FleetRabbit's maintenance scheduling module. Parts requirements populate from inventory. Technician availability is cross-referenced against planned shop capacity. Service is scheduled before the projected failure threshold — not after the truck breaks down on a client delivery route.
06
Post-Service Validation and Learning
After maintenance is completed, the system re-baselines the serviced component. Technician findings are captured and fed back into the predictive model. Over time, FleetRabbit's condition model becomes increasingly precise for your specific fleet, routes, and operating environment — improving alert accuracy beyond 95% within the first 90 days.
See How FleetRabbit's Condition Monitoring Cuts Unplanned Downtime by 68%
Transportation and logistics fleets using FleetRabbit replace emergency roadside breakdowns with scheduled shop visits — protecting delivery commitments, reducing repair costs, and eliminating the driver safety risk of highway failures.
Component-by-Component: What Condition Monitoring Reveals in Your Truck Fleet
Wheel Bearings
Detection Signal: High-frequency vibration at wheel speed harmonics
Detection Window: 3–8 weeks before seize
Proactive: $380–$620 vs. Reactive: $4,200–$9,800
Wheel bearing failure at highway speed can cause complete wheel separation — among the highest safety liability events in commercial trucking.
Driveshaft Assembly
Detection Signal: Rotational imbalance at cruising speed frequency
Detection Window: 2–6 weeks before catastrophic failure
Proactive: $800–$1,400 vs. Reactive: $3,500–$7,200
Driveshaft failure at speed causes irreparable transmission tail housing damage and potential vehicle loss of control.
Suspension System
Detection Signal: Low-frequency amplitude increase over road inputs
Detection Window: 4–10 weeks before structural failure
Proactive: $600–$1,200 vs. Reactive: $2,800–$6,400
Degraded suspension accelerates tire wear, reduces braking effectiveness, and damages cargo — compounding total loss well beyond repair costs alone.
Engine Mounts
Detection Signal: Engine harmonic resonance transmitted to cab and frame
Detection Window: 3–7 weeks before isolation failure
Proactive: $420–$780 vs. Reactive: $1,800–$4,200
Failed engine mounts allow engine movement that stresses coolant lines, fuel lines, and exhaust connections — triggering multiple simultaneous failures.
Brake System
Detection Signal: Non-uniform deceleration vibration and pedal feedback anomalies
Detection Window: 2–5 weeks before compliance threshold
Proactive: $700–$1,600 vs. Reactive: $3,200–$8,500 + CSA violation
Brake system failures represent the largest source of out-of-service violations during DOT roadside inspections — direct CSA score impact and revenue loss.
Transmission
Detection Signal: Gear-mesh frequency anomalies during load transitions
Detection Window: 5–12 weeks before gear or bearing failure
Proactive: $1,200–$2,800 vs. Reactive: $12,000–$28,000
Transmission failure is among the most expensive single-event repairs in commercial trucking — early detection delivers the highest per-alert return on investment.
How FleetRabbit Delivers Executive-Level Visibility Across Your Fleet
Condition monitoring data is only valuable if it reaches the right decision-makers in an actionable format. FleetRabbit structures condition monitoring outputs across three organizational levels — ensuring technicians, fleet managers, and executives each see the information most relevant to their role.
Maintenance Technicians
FleetRabbit Shows
Specific vehicle and component requiring inspection
Urgency classification and service window recommendation
Historical vibration trend data for diagnostic context
Parts required and current inventory availability
DVIR history and previous technician observations
Fleet Managers
FleetRabbit Shows
Fleet-wide condition health dashboard with risk-ranked vehicles
Open alerts by severity with projected failure windows
Planned vs. unplanned maintenance ratio tracking
Downtime trend comparison vs. prior period
Cost avoidance data — proactive vs. projected reactive cost
Executives and Directors
FleetRabbit Shows
Fleet availability percentage trend by month
Total maintenance spend vs. budget with predictive breakdown
Equipment lifecycle performance and replacement planning
CSA compliance score trends influenced by maintenance outcomes
ROI dashboard: cost avoidance through predictive actions
Integrating Vibration Monitoring With FleetRabbit's DVIR and Digital Inspection System
Sensor data alone cannot capture everything. A driver who notices unusual steering wheel vibration, an abnormal clunk during gear transition, or irregular brake pedal feel provides diagnostic information that sensors may not yet be flagging. FleetRabbit closes this gap by integrating structured driver DVIR submissions directly into the condition monitoring workflow — creating a combined human-and-sensor diagnostic layer that is more accurate than either source alone.
Structured Driver Observations Feed the Predictive Model
FleetRabbit DVIR checklists include specific vibration and ride quality observation fields. Driver reports of rougher-than-normal conditions at specific speed ranges, unusual noises under load, or brake pedal inconsistency become structured data points — not informal verbal complaints that get lost in shift handover conversations. These observations are time-stamped, GPS-stamped, and correlated with sensor readings from the same vehicle and time period.
Photo Documentation of Visual Anomalies
Drivers use the FleetRabbit mobile app to photograph visible anomalies — leaking seals, uneven tire wear patterns, suspension component movement, brake dust accumulation. Photo documentation gives maintenance supervisors visual diagnostic context before the truck arrives at the shop, enabling pre-staged parts and reduced bay time. A technician who already knows what to look for works 40–60% faster than one diagnosing from scratch.
Automatic Escalation of Critical Findings
When a driver marks a vibration item as defective or deteriorating in the DVIR, FleetRabbit automatically escalates to the maintenance supervisor for same-day review. The system correlates the driver's observation against current sensor data for that vehicle. If sensor data confirms the reported anomaly, a maintenance recommendation is generated immediately — not queued for the next scheduled inspection cycle.
Compliance Documentation as a Compounding Benefit
Every DVIR submission, sensor alert, maintenance recommendation, and work order completion creates a timestamped, searchable audit record in FleetRabbit. During DOT audits or insurance claims, your team can produce complete equipment history documentation within minutes. Demonstrating systematic, data-driven maintenance oversight provides regulatory credibility that reactive maintenance organizations cannot match.
Implementation Roadmap: From Data-Blind to Condition-Monitored Fleet
Phase 1
Fleet Audit and Platform Integration — Week 1 to 2
FleetRabbit onboarding team maps your existing telematics and OEM data sources. Integration connectors are established for GPS platforms, OEM remote diagnostic systems, and fuel card data. Existing vehicle records, service history, and component age data are imported into FleetRabbit. Fleet-wide digital DVIR deployment begins with driver training on structured condition reporting via the mobile app.
Outcome: Complete data pipeline established, DVIR active across fleet.
Phase 2
Baseline Establishment and Alert Calibration — Week 3 to 6
Platform collects baseline condition data across your specific routes, loads, and operating conditions. Alert thresholds are calibrated against your fleet's actual operating parameters — not generic defaults. Initial condition assessment identifies any vehicles already in deteriorated condition requiring priority inspection. Maintenance team is familiarized with alert interpretation and response protocols.
Outcome: Fleet-specific baselines established, first condition alerts live.
Phase 3
Predictive Maintenance Transition — Week 7 to 10
Maintenance scheduling transitions from time-based intervals to condition-based triggers. Work orders are generated from FleetRabbit recommendations. Parts procurement is aligned with platform projections rather than historical averages. Maintenance managers gain confidence in alert reliability as early predictions are validated by technician findings at service. Planned vs. unplanned ratio begins improving immediately.
Outcome: Condition-based maintenance operational, unplanned downtime declining.
Phase 4
Fleet-Wide Optimization and Executive Reporting — Month 3 Onward
Platform model accuracy improves as technician findings refine predictions. Executive reporting dashboards provide month-over-month improvement tracking. Fleet availability percentage, cost avoidance metrics, and maintenance spend trend data are available for leadership reviews. Inventory optimization becomes based on predictive parts demand rather than reactive emergency purchasing. Most fleets achieve 60–70% unplanned downtime reduction by month four.
Outcome: Measurable ROI documentation, fleet-wide maintenance optimization active.
Key Outcomes Fleet Managers and Executives Achieve With FleetRabbit
68%
Average reduction in unplanned truck downtime events within 90 days of full platform deployment
9.2x
Average return on condition monitoring platform investment through prevented emergency repairs and sustained vehicle availability
43%
Reduction in total maintenance spend through elimination of cascade damage and shift from emergency to planned service pricing
35%
Extension of component service life through condition-based replacement timing versus fixed time-based replacement schedules
Frequently Asked Questions: Vibration and Condition Monitoring in Truck Fleets
QDoes FleetRabbit require additional hardware sensors installed on each truck?
FleetRabbit first integrates with your existing telematics system, OEM remote diagnostics, and ELD data — no additional hardware required in most fleets. For trucks without telematics or with limited OEM data access, FleetRabbit supports integration with aftermarket sensor arrays. The platform's data ingestion layer is hardware-agnostic, meaning your team is not locked into proprietary sensor investments. Most transportation fleets have sufficient existing data sources to launch condition monitoring within the first two weeks.
QHow does FleetRabbit prevent alert fatigue from too many false alarms?
Alert fatigue is the primary failure mode of poorly implemented condition monitoring systems. FleetRabbit addresses this through three mechanisms: fleet-specific baseline calibration so alerts trigger against your fleet's actual normal, rate-of-change analysis so trending deterioration triggers alerts rather than static threshold crossings, and severity classification — Monitor, Service Soon, Urgent — that allows maintenance teams to batch low-urgency alerts and prioritize appropriately. Most fleets report high-confidence alerts within 6–8 weeks. Alert accuracy reaches 93–97% by month three.
QWhat telematics and OEM systems does FleetRabbit integrate with?
FleetRabbit integrates with major GPS telematics platforms including Samsara, Verizon Connect, Geotab, and KeepTruckin. OEM integrations include Volvo CONNECT, Kenworth TruckTech+, Freightliner Remote Diagnostics, Peterbilt SmartLinq, and International OnCommand. ELD integrations cover most major providers. For fleets running mixed equipment from multiple manufacturers, FleetRabbit's data normalization layer unifies all sources into a single equipment health profile — eliminating the fragmented monitoring problem that plagues large mixed fleets.
QHow does condition monitoring change the day-to-day role of our maintenance team?
The most significant operational change is the shift from reactive firefighting to proactive scheduling. Maintenance teams spend less time on emergency triage and parts expediting, and more time on systematic planned service. Technicians work from condition-based work orders with pre-staged parts, reducing bay time per job by 30–45%. Maintenance supervisors shift from managing crises to managing schedules. Over time, teams report significantly reduced job stress and improved ability to plan staffing against known maintenance demand rather than unknown breakdown events.
QCan FleetRabbit's condition monitoring improve CSA scores and DOT compliance outcomes?
Yes — and this is a significant secondary benefit for transportation and logistics fleets. DOT roadside inspections target brake systems, tires, and suspension components specifically. FleetRabbit condition monitoring maintains these systems within safe operating parameters through continuous monitoring, dramatically reducing the probability of out-of-service violations. Complete DVIR documentation and maintenance history records provide evidence of systematic oversight during compliance reviews. Fleets using FleetRabbit report meaningful CSA score improvements within the first two inspection cycles following full implementation.
QWhat is the minimum fleet size that makes condition monitoring cost-effective?
FleetRabbit delivers measurable return on investment for fleets of 10 trucks or more. At that scale, a single prevented emergency breakdown typically covers the platform cost for three to six months. For fleets of 25 or more vehicles, the ROI case is typically 6–12x within the first year through combined downtime reduction, maintenance cost savings, and extended component life. The platform scales without per-unit cost penalties, meaning larger fleets see proportionally larger benefits without proportionally larger costs.
Condition Monitoring Is No Longer Optional for Competitive Transportation Fleets
The trucking operations that compete most effectively over the next decade will not be those with the newest equipment or the highest driver wages. They will be those with the highest asset availability and the lowest unplanned cost burden — both of which are direct outputs of systematic condition monitoring and predictive maintenance.
FleetRabbit gives transportation and logistics fleet managers and executives the vibration analysis, telematics integration, DVIR correlation, and predictive scheduling capabilities to achieve 68% downtime reduction, 43% maintenance cost reduction, and 9x+ return on platform investment — within the first 90 days of deployment.
The cost of inaction is $22,000 per breakdown event. The cost of FleetRabbit is a fraction of that — and it prevents the breakdown from happening at all.
Ready to Replace Emergency Breakdowns With Scheduled Maintenance?
FleetRabbit's vibration and condition monitoring platform detects component degradation 3–8 weeks before failure — giving your team time to schedule service, order parts, and keep trucks on the road. See how transportation and logistics fleets achieve 68% downtime reduction and nine-plus times ROI through systematic predictive maintenance.
Vibration Monitoring
Condition-Based Maintenance
DVIR Integration
Telematics Analytics
DOT Compliance
Fleet Uptime Optimization
April 15, 2026
By Nathan Smith
All Posts