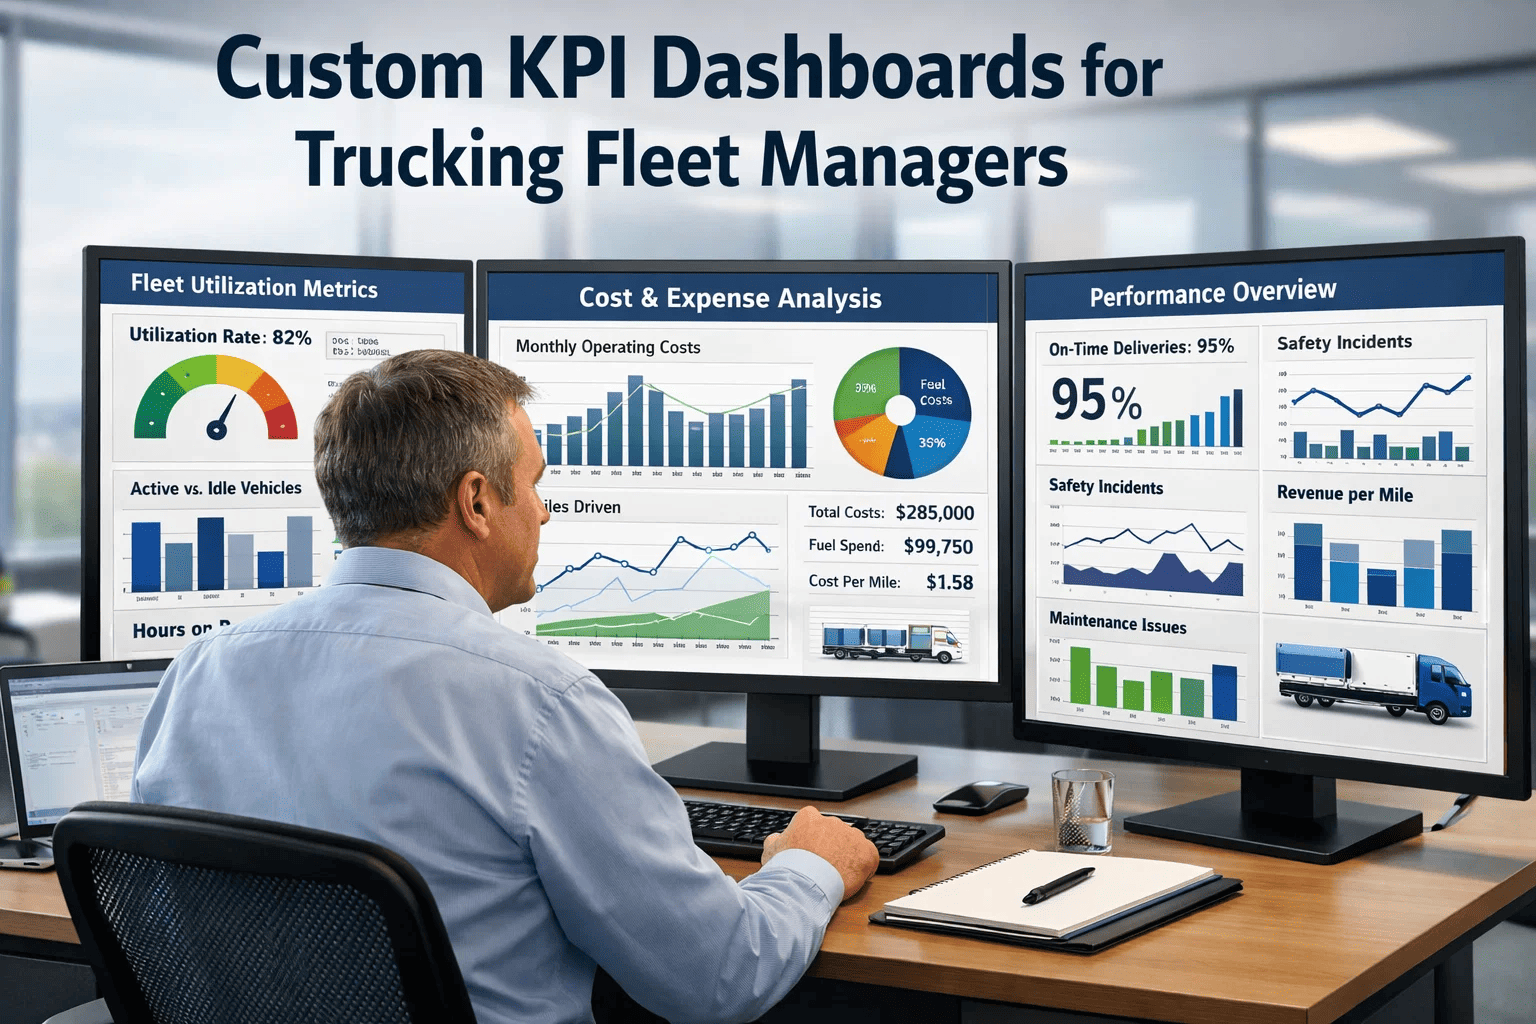
Fleet managers at mid-to-large trucking operations face a data crisis that rarely gets called what it is: not a shortage of information, but an inability to see all of it in one place, updated in real time, structured around the metrics that actually determine whether the business is profitable. Driver behavior data lives in one system. Fuel consumption reports come from the fuel card provider. Maintenance costs are buried in a spreadsheet managed by the shop foreman. Vehicle utilization is estimated, not measured. When a VP of Operations asks why cost-per-mile increased last quarter, the answer requires five people pulling from five systems — and it arrives too late to act on. Book a demo to see how FleetRabbit consolidates every fleet KPI into a single live dashboard built for trucking operations.
Guide Summary
This guide explains how trucking fleet managers and operations executives can build custom KPI dashboards using FleetRabbit to unify vehicle utilization, driver performance, fuel efficiency, maintenance cost, and route analytics into a single real-time view. It covers which metrics matter most by role, how FleetRabbit structures data across the fleet, and how custom dashboards translate raw telematics and dispatch data into decisions that reduce cost-per-mile and improve asset productivity.
Why Standard Fleet Reports Fail Operations Leaders
Most trucking operations do not lack data. They lack structured, role-appropriate visibility into data that arrives too late to drive decisions. Standard telematics exports deliver raw event logs. Fuel card reports show spend but not the behavioral root cause. Maintenance records track costs but cannot be cross-referenced against vehicle utilization to determine whether a high-cost asset is earning its keep. The result is a management culture built on lag — monthly reports assembled by analysts, reviewed two weeks after the period they describe, on metrics that have already shifted.
The specific failure modes are consistent across fleet sizes. Dispatchers cannot see vehicle availability in real time without calling the yard. Fleet managers cannot compare driver fuel efficiency across the same routes without building custom pivot tables. VPs of Operations cannot determine asset productivity — revenue generated per vehicle per day — without requesting reports from three separate departments. Custom KPI dashboards built on a unified data platform eliminate each of these failure modes at the root, not through better reporting, but through better data architecture.
01
Disconnected Data Sources With No Unified Layer
Telematics, ELD, fuel cards, maintenance software, and dispatch systems each hold partial information. No single view combines them. Cross-functional KPIs like cost-per-mile or revenue-per-asset require manual assembly across multiple exports every reporting cycle.
02
Lag Between Event and Awareness
Monthly and weekly reports describe conditions that have already changed. A driver with deteriorating fuel behavior, a vehicle approaching preventive maintenance due date, or a route consistently delivering late — none of these surface until the report arrives, by which point the cost has already occurred.
03
One-Size Reporting That Fits No Role Precisely
Standard fleet reports are built for the person who created them, not for every role that consumes them. Executives see granular vehicle-level data they cannot use. Mechanics receive financial summaries that do not help them prioritize the work queue. Role-appropriate KPI visibility is absent by default.
04
KPI Definitions That Vary Across Departments
Without a shared data platform, fleet efficiency means different things to different teams. Finance calculates it from fuel invoices. Operations calculates it from telematics idle time. Neither calculation uses the same denominator. Custom dashboards built on a common data model enforce a single definition of every metric across the organization.
The FleetRabbit Data Architecture Behind Custom Dashboards
FleetRabbit connects directly to the data sources that trucking fleets already operate — telematics hardware, ELD systems, fuel card providers, maintenance management tools, and dispatch platforms — and normalizes event-level data into a structured layer that feeds every dashboard view simultaneously. No data warehouse configuration is required. No custom ETL pipeline. The integration layer handles ingestion, normalization, and metric calculation automatically, so that when a fleet manager opens their dashboard, they see current numbers built from live source data, not from a batch export run overnight.
The architecture separates data collection from data presentation, which is what makes custom dashboards possible without custom engineering. Every KPI visible on a FleetRabbit dashboard is calculated from the same underlying event stream, ensuring consistency across roles. A dispatcher viewing vehicle availability and a VP viewing asset productivity revenue are reading metrics derived from the same data, structured to answer the question each role is actually asking.
Data Ingestion Layer
Telematics and ELD Integration
Direct connection to major telematics providers and ELD systems. Location, speed, idle time, harsh event, and HOS data normalized into a consistent event schema regardless of hardware vendor.
Cost Intelligence Layer
Fuel and Maintenance Data Fusion
Fuel card transaction data linked to vehicle and driver records. Maintenance work order data connected to asset history. Cost attribution calculated at vehicle, driver, route, and division level simultaneously.
Operational Layer
Dispatch and Route Performance
Planned versus actual route data from dispatch systems compared against telematics actuals. On-time delivery rate, route deviation frequency, and stop efficiency calculated per driver, route, and customer lane.
Presentation Layer
Role-Scoped Custom Dashboards
Every user role — fleet manager, dispatcher, maintenance lead, executive — receives a dashboard view scoped to their operational domain with the KPIs, alert thresholds, and drill-down paths relevant to their function.
Core KPI Categories Every Trucking Dashboard Must Cover
Effective trucking dashboards are not built by listing every available metric. They are built by identifying the four to eight numbers that, if known in real time, would change how the operation is managed today. The categories below represent the measurement domains that consistently deliver operational and financial impact when brought into a live dashboard environment.
Category 01
Vehicle Utilization and Asset Productivity
Active Asset Ratio
Percentage of the fleet generating revenue on any given operating day. Fleets averaging below 78% active asset ratio typically carry excess capacity that is not visible without dashboard tracking.
Revenue per Asset per Day
Total revenue attributed to each vehicle divided by operating days. Enables executive comparison across asset classes, routes, and business units without manual consolidation.
Loaded vs. Empty Miles Ratio
Proportion of total miles driven under revenue-generating load. Empty miles represent direct cost with no corresponding revenue. Industry benchmark for long-haul TL operations is below 12% empty miles.
Average Days Out of Service
Mean time vehicles spend unavailable due to mechanical, compliance, or administrative reasons. Tracked per asset and rolled up to fleet average for capacity planning.
Category 02
Driver Performance and Behavior Analytics
Driver Safety Score
Composite score built from hard braking, rapid acceleration, speeding frequency, and cornering events normalized by miles driven. Enables fair comparison across drivers operating different route profiles.
Fuel Efficiency by Driver
Miles per gallon or cost per mile attributed to individual drivers on comparable routes. Isolates behavioral fuel waste — idle time, speed management, AC usage — from route-level fuel variation.
HOS Compliance Rate
Percentage of drivers operating within Hours of Service limits across the fleet. Real-time HOS status visible at dispatcher and manager level to prevent violations before they occur.
On-Time Pickup and Delivery Rate
Actual versus scheduled arrival performance per driver and per route. Identifies chronic late patterns tied to specific drivers, customers, or lane assignments before they affect service contracts.
Category 03
Fuel Cost Intelligence
Fleet-Wide Cost per Mile (Fuel)
Total fuel spend divided by total miles driven across the fleet, updated daily. Primary executive benchmark for fuel program effectiveness and the first metric to change when driver behavior or routing efficiency shifts.
Idle Time as Fuel Cost
Total idle hours converted to estimated fuel cost at current diesel prices. Quantifies the financial impact of idle behavior in terms management and drivers can both act on.
Fuel Spend by Division or Region
Fuel cost broken down by operational division, geographic region, or customer account. Enables P&L attribution for multi-division fleets without manual allocation.
Fuel Card Exception Rate
Percentage of fuel transactions flagged as out-of-policy — wrong fuel grade, off-network purchase, purchase timing misaligned with vehicle location. Reduces fuel fraud exposure without manual audit.
Category 04
Maintenance Cost and Asset Health
Planned vs. Unplanned Maintenance Ratio
Proportion of maintenance spend on scheduled PM versus reactive repairs. Operations with planned maintenance ratios below 60% typically pay 2 to 3x more per repair event than fleets maintaining 75% or above.
Cost per Mile (Maintenance)
Total maintenance spend divided by miles driven, tracked per vehicle and fleet-wide. The primary metric for identifying assets whose maintenance cost profile makes replacement the financially correct decision.
PM Compliance Rate
Percentage of preventive maintenance tasks completed on schedule across the fleet. Tracked per vehicle, per shop, and fleet-wide. Declining PM compliance is the leading indicator of unplanned breakdown increases.
Mean Time Between Failures
Average miles or days between unplanned mechanical events per vehicle. Fleet-wide MTBF trend identifies whether the maintenance program is improving asset reliability over time.
How FleetRabbit Structures Role-Based Dashboard Views
The most common failure in fleet dashboard implementations is building a single view that attempts to serve every user simultaneously. An executive who needs to assess portfolio-level asset productivity does not benefit from a dashboard that opens to individual driver speed events. A dispatcher managing real-time load assignment does not need a 12-month maintenance cost trend chart. FleetRabbit resolves this by structuring dashboard access around roles, with each view surfacing the specific KPIs, alerts, and drill-down capabilities that the role actually uses to make decisions.
Fleet Manager Dashboard
Operational Control View
Fleet-wide vehicle availability and out-of-service count
Driver safety score distribution and flagged events
PM schedule compliance rate and upcoming due dates
Fuel efficiency ranking across drivers and vehicles
HOS compliance status across active drivers
Unresolved maintenance work orders and aging
Dispatcher Dashboard
Real-Time Execution View
Live vehicle location and current load status
ETA accuracy versus scheduled delivery windows
Available hours remaining per active driver
Route deviation alerts and re-routing triggers
Load assignment gaps and unallocated capacity
Customer stop completion status in real time
Maintenance Lead Dashboard
Asset Health and Shop View
Upcoming PM due list by vehicle and mileage trigger
Open work orders by status and assigned technician
Fault code alerts and diagnostic event feed
Maintenance cost per vehicle versus fleet average
Parts inventory levels and reorder status
Downtime duration per vehicle and fleet total
VP Operations Dashboard
Executive Portfolio View
Revenue per asset per day across fleet and divisions
Total cost per mile trend — fuel, maintenance, driver
On-time delivery rate by customer and lane
Active asset ratio and utilization versus target
Safety incident rate and compliance exposure
Monthly P&L contribution by division or region
Building Your First Custom KPI Dashboard in FleetRabbit
FleetRabbit is designed so that fleet managers — not data analysts or IT staff — can configure custom dashboard views without technical assistance. The dashboard builder operates on a drag-and-drop widget model where each KPI, chart, map, and alert module is individually configurable and placeable. The process from initial data connection to a live, role-specific custom dashboard follows four structured phases.
Phase 1
Connect Your Data Sources
Telematics Integration
Same Day
Direct API connection to major telematics providers. Vehicle location, event, and sensor data begins flowing within hours of credentials setup.
ELD and HOS Data
FMCSA Compatible
ELD data normalized into FleetRabbit's HOS compliance module. Driver availability and violation risk visible in real time from day one.
Fuel and Maintenance
CSV or API
Fuel card data imported via direct API or structured CSV. Maintenance records connected from existing shop management systems or entered directly.
Phase 2
Define Your KPI Targets and Alert Thresholds
Benchmark Configuration
Per Fleet Type
Set cost-per-mile targets, utilization thresholds, and safety score floors based on your fleet's operational profile — not industry averages that may not apply.
Alert Rules
Custom Triggers
Configure push alerts for threshold breaches — idle time exceeding 45 minutes, fuel spend deviation above 15%, PM due within 500 miles — delivered to the right role, not broadcast to everyone.
Reporting Cadence
Daily or Weekly
Automated report packages delivered on defined schedules — daily operational summary for fleet managers, weekly trend digest for executives, monthly cost report for finance.
Phase 3
Configure Role-Scoped Dashboard Views
Widget Library
40+ Modules
Drag-and-drop KPI widgets, map layers, trend charts, ranking tables, and alert feeds. Each widget pulls live from the connected data layer — no code required to configure.
Access Scoping
By Role or Division
Each user role accesses only the vehicle subset, data category, and KPI range relevant to their function. Division managers see their fleet. VPs see the full portfolio. Dispatchers see their assigned loads.
Mobile Optimization
iOS and Android
Every custom dashboard view renders fully on mobile. Fleet managers on the yard, drivers checking their performance score, and executives reviewing KPIs between meetings all access the same live data.
Phase 4
Activate Continuous Performance Intelligence
Trend Analysis
30 90 365 Day
Every KPI on the dashboard carries configurable trend windows. Compare this week to last month. Compare this quarter to the same quarter last year. Trend context is built into every metric view by default.
Predictive Alerts
AI-Powered
FleetRabbit's predictive layer flags deteriorating trends before they cross alert thresholds — identifying fuel efficiency degradation or increasing hard-brake frequency before they become a cost or safety issue.
Benchmark Comparison
Internal and Peer
Compare individual vehicles, drivers, and divisions against fleet averages. Identify which assets and operators are driving cost above the mean and where the opportunity for improvement is largest.
How FleetRabbit Solves the Five Biggest Fleet Analytics Problems
Fleet analytics implementations fail for predictable reasons. Understanding how FleetRabbit addresses each root cause is essential to evaluating whether a dashboard platform will deliver sustained operational value or replicate the visibility gaps that already exist in most trucking operations.
01
From Data Silos to Unified Intelligence
FleetRabbit replaces the five-system manual consolidation cycle with a single connected data layer. Telematics, ELD, fuel, maintenance, and dispatch data flow into one platform, calculated once, displayed consistently across every dashboard role. The analyst-day cost of monthly report assembly drops to zero.
02
From Lag Reporting to Real-Time Awareness
FleetRabbit dashboards update continuously from live data sources. The idle time event that occurred 20 minutes ago is visible now. The PM due date approaching next week is on the maintenance lead's alert feed today. The driver whose fuel efficiency dropped below threshold this week gets a coaching flag before the month-end report — not after.
03
From Generic Reports to Role-Specific KPI Views
FleetRabbit's role-based dashboard architecture ensures every user sees the metrics they own, scoped to the assets and operations within their function. Dispatchers do not navigate executive portfolio views to find load status. Executives do not receive individual vehicle fault code feeds. Every role opens to the dashboard built for their decisions.
04
From Reactive Maintenance to Predictive Asset Management
FleetRabbit's maintenance intelligence layer connects telematics fault code data to PM schedules and cost history, surfacing vehicles at elevated breakdown risk before the roadside call occurs. The predictive maintenance dashboard reduces unplanned repair costs by shifting the maintenance mix from reactive toward planned — the single highest-leverage maintenance cost reduction available to most trucking operations.
05
From Anecdotal Driver Management to Data-Driven Coaching
FleetRabbit's driver analytics dashboard converts raw telematics events into structured performance scores that fleet managers can use for objective, consistent coaching conversations. Drivers with similar route profiles are compared on a fair basis. Improvement trend is tracked over time, not reset each month. Safety, fuel, and delivery performance are visible as a composite view — not three separate reports.
06
From Spreadsheet Forecasting to Automated CapEx Intelligence
FleetRabbit's asset productivity module combines maintenance cost history, utilization rate, and revenue attribution to identify vehicles that have crossed the replacement threshold — where continued operation costs more than replacement. This calculation runs automatically for every asset and surfaces in the executive dashboard, replacing the annual spreadsheet exercise with a continuous, data-driven replacement recommendation feed.
Key Metrics: Before and After FleetRabbit Dashboard Deployment
| Metric |
Without FleetRabbit |
With FleetRabbit Dashboards |
| Monthly KPI report assembly time |
3 to 5 analyst-days per reporting cycle — manual export from multiple systems |
Live dashboard — updated continuously from all connected sources, zero assembly time |
| Time from event to management awareness |
10 to 14 days — next monthly report cycle |
Real-time — alerts delivered to responsible role within minutes of threshold breach |
| Driver fuel efficiency visibility |
Fleet average from fuel card statement — no driver-level attribution |
Per-driver efficiency on comparable routes — ranked, trended, and coaching-flagged automatically |
| Unplanned maintenance as percentage of total |
42% average for fleets without PM compliance tracking |
Below 23% average at 6 months — predictive alerts shift maintenance mix toward planned |
| Asset replacement decision process |
Annual spreadsheet review — subjective, incomplete cost attribution |
Continuous automated CapEx intelligence — replacement threshold flagged per asset as it is crossed |
| Cross-role KPI consistency |
Inconsistent definitions across finance, operations, and dispatch — metrics misalign in reviews |
Single shared data model — every role calculates the same KPI from the same source |
| Dashboard setup and time to live |
6 to 12 months for enterprise BI implementation — requires dedicated analyst team |
48 hours from onboarding to live custom dashboard — no IT engagement required |
What FleetRabbit KPI Dashboards Enable at Each Management Level
The operational value of custom KPI dashboards is not uniform across management levels. Each level of the organization makes different decisions, at different frequencies, using different data. FleetRabbit's role-scoped architecture ensures that the dashboard delivers its highest possible value to each level — not a compromise that serves no level particularly well.
Executive Level
Portfolio Performance and Capital Decisions
VPs and C-suite executives use FleetRabbit dashboards to answer the questions that drive capital allocation: which assets are earning their cost of ownership, which divisions are generating the highest revenue per mile, where safety exposure is concentrated, and whether the fleet's overall cost-per-mile trend is improving or deteriorating. These decisions are made quarterly but benefit from data that updates daily. FleetRabbit delivers that cadence without requiring executive staff to request reports.
Fleet Manager Level
Daily Operational Control and Compliance
Fleet managers use FleetRabbit dashboards to manage the daily operational state of the fleet — which vehicles are available, which drivers need coaching, which PM items are overdue, and which safety events from yesterday require follow-up. The fleet manager dashboard surfaces the 8 to 12 metrics that define whether today is operationally on-track, with drill-down into any anomaly without requiring a separate report request. This is the layer where most of the cost-per-mile improvement opportunity lives.
Dispatcher Level
Real-Time Load and Driver Management
Dispatchers use FleetRabbit's real-time operational view to manage load assignments, driver availability, and customer delivery windows simultaneously. The dispatcher dashboard does not show historical trends or cost analytics — it shows the current state of every active vehicle and driver, updated continuously, with alerts for conditions that require immediate action. ETAs that are drifting, HOS limits approaching, vehicles departing planned routes — these surface in the dispatcher view in real time, not in the following day's report.
Frequently Asked Questions
QHow does FleetRabbit calculate cost-per-mile across different data sources without manual reconciliation?
FleetRabbit's cost intelligence layer links fuel card transaction data, maintenance work order costs, and driver compensation records to individual vehicle mileage from telematics. Each cost category is attributed to the vehicle that incurred it, then divided by confirmed odometer-sourced miles for that vehicle in the measurement period. The calculation runs automatically each time new data is ingested, so the cost-per-mile figure on your dashboard reflects the most recent complete data — not a batch run from the previous night.
Book a demo to see the cost-per-mile calculation for your specific cost categories and data sources.
QCan FleetRabbit connect to telematics hardware we already have deployed across the fleet?
Yes. FleetRabbit integrates with the major telematics platforms used in North American and European trucking operations via direct API. If your telematics provider supports API data export — which most enterprise-grade providers do — FleetRabbit can connect without requiring hardware replacement or parallel installation. The integration team reviews your specific provider during the onboarding call and confirms compatibility before contract commitment.
QHow are driver safety scores calculated and can the scoring model be customized for our operation?
FleetRabbit's default driver safety score is a weighted composite of hard-braking frequency, rapid acceleration events, speeding duration, and sharp cornering — each normalized by miles driven to enable fair comparison across drivers with different daily mileage. The weighting of each event type is configurable by the fleet manager to reflect the safety priorities specific to your operation. Long-haul over-the-road fleets typically weight speed management more heavily; last-mile delivery fleets typically weight braking and acceleration due to urban stop density. Both configurations are supported natively.
QWhat does the implementation process look like for a fleet of 80 to 200 trucks?
For fleets in the 80 to 200 vehicle range, FleetRabbit onboarding follows a structured two-day remote process: day one establishes telematics and ELD data connections and validates that vehicle and driver records are flowing correctly; day two configures role-based dashboard views, alert thresholds, and automated report schedules for each user group. The process does not require an IT implementation engagement or a dedicated internal project team. A fleet operations manager with system admin credentials can complete onboarding with FleetRabbit's implementation team in the allocated window.
Book a demo to review the implementation timeline for your fleet size and current system stack.
QCan executives access FleetRabbit portfolio dashboards without accessing individual driver or vehicle records?
Yes. FleetRabbit's access control layer allows each user role to be scoped to specific data categories, vehicle subsets, and aggregation levels. An executive dashboard view can be configured to display portfolio-level metrics — cost-per-mile, utilization rate, revenue per asset, safety incident rate — without exposing individual driver performance records, which may be subject to HR data governance requirements. This scoping is configured at the role level, not per user, so it applies consistently across everyone in that role group.
Build Your Custom Fleet KPI Dashboard in 48 Hours
FleetRabbit connects to your existing telematics, ELD, fuel, and maintenance data and delivers a fully customized, role-scoped KPI dashboard without an IT project or analyst team. Fleet managers get real-time operational control. Dispatchers get live load and driver visibility. Executives get the portfolio performance view they have never had without requesting a report.
Custom KPI Dashboards
Real-Time Fleet Analytics
Driver Performance Scoring
Cost-Per-Mile Intelligence
Predictive Maintenance Alerts
Role-Based Access Control
April 22, 2026
By Jason Smith
All Posts