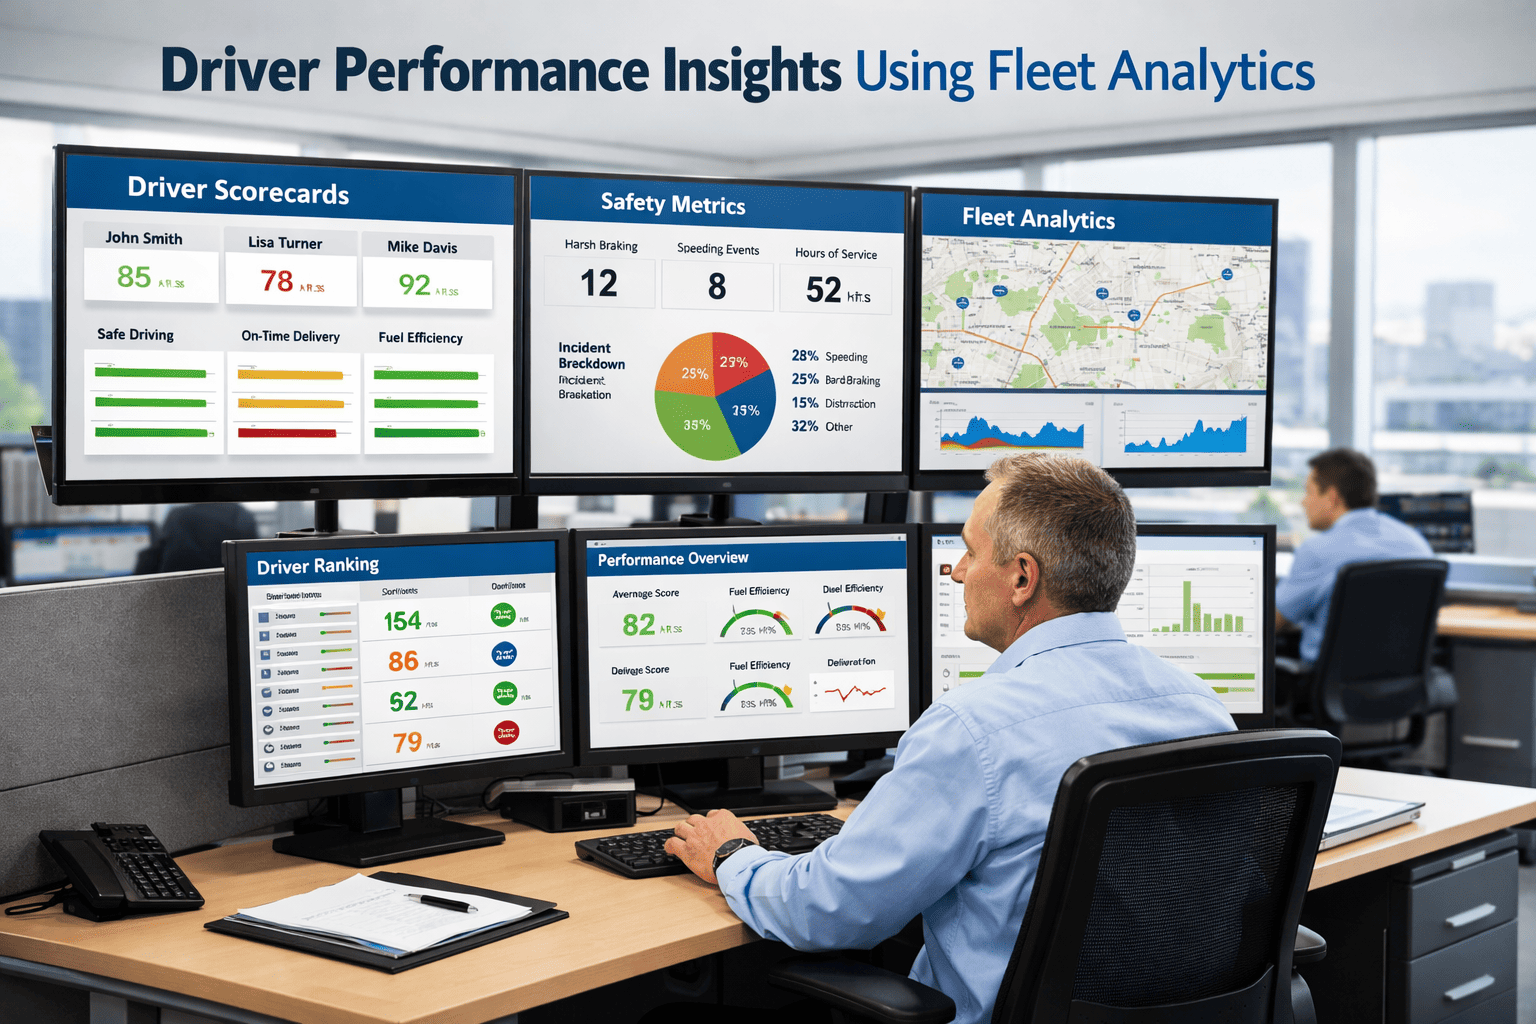
Driver performance is the largest variable cost in commercial trucking that most fleet managers still manage subjectively. A driver who averages 7.2 miles per gallon instead of 8.1 MPG costs a fleet operating 120,000 miles annually an additional $4,320 per year at $3.80 per gallon — and that single driver's fuel behavior is almost never visible to management until it shows up as a line variance on a fuel cost report weeks later. When you scale that single gap across a fleet of 60 drivers, the visibility problem becomes a structural financial problem. Fleet analytics transforms driver performance from a subjective management conversation into an objective, data-driven accountability framework — surfacing exactly which drivers are generating cost, risk, and compliance exposure, and giving fleet managers and transportation executives the specific data needed to intervene early, coach effectively, and reward high performance with credibility. FleetRabbit's driver analytics platform captures, scores, and reports on every driver across every performance dimension — in real time. Book a demo to see FleetRabbit's driver performance dashboard.
$4,320
Annual Cost of 1 MPG Gap per Driver at $3.80/gal
3.8×
Higher Accident Rate for Bottom-Quartile vs. Top-Quartile Drivers
62%
of Fleets Cannot Identify Their Top 10 Most Inefficient Drivers
28%
Lower Driver Turnover in Fleets Using Performance Scorecards
Why Traditional Driver Management Fails — The Visibility Gap
Most fleet managers evaluate driver performance through a combination of accident reports, customer complaints, and occasional fuel card statements. This approach has three fundamental failures that prevent meaningful performance improvement and expose fleets to avoidable financial and safety risk.
Reactive, Not Predictive
Accident reports and complaint calls are outcome data — they record what already happened. By the time a pattern surfaces through reactive reporting, the fleet has already incurred the cost, the insurance claim, or the customer relationship damage. Analytics-driven performance management identifies deteriorating behavior patterns weeks before they produce an incident.
Subjective, Not Objective
Without data, driver performance conversations default to impressions, anecdotes, and relationships. Coaching conversations that rely on subjective feedback rarely produce behavioral change, are legally difficult to document for disciplinary purposes, and fail to distinguish between drivers who need coaching and those doing the right things quietly.
Incomplete — Misses Hidden Costs
Fuel card reports show total consumption but not behavior-level fuel drivers — idle time, speed profile, and route compliance each contribute to fuel cost but require separate, connected data streams to attribute correctly. The true cost of a driver's behavior is invisible in any single data source.
FleetRabbit Driver Analytics — The Complete Performance Picture
FleetRabbit's driver analytics platform captures, scores, and ranks every driver across eight performance dimensions — combining GPS telematics, engine data, HOS records, DVIR completion, and delivery performance into a single, quantified driver score. Fleet managers see exactly where each driver performs well, where coaching is needed, and how individual performance compares to fleet benchmarks — updated after every trip.
Sample Driver Scorecard — J. Martinez, Unit TR-101
The Eight Performance Dimensions FleetRabbit Tracks — And Why Each Matters
01
Fuel Efficiency Score
What it measures: MPG performance relative to vehicle class, load type, and route elevation profile — normalizing for factors outside driver control.
Why it matters: A 1 MPG improvement across a 60-driver fleet at 120,000 miles per driver annually saves $273,600 per year at $3.80/gallon. Driver-level fuel scoring is the most direct path to that improvement.
FleetRabbit action: Weekly fuel score ranking surfaced to fleet managers. Bottom-quartile drivers flagged for coaching consultation with trip-level fuel data.
02
Speed Compliance Profile
What it measures: Percentage of miles driven above posted speed limits and fleet speed policy thresholds — broken down by highway, arterial, and surface street categories.
Why it matters: Driving at 75 mph instead of 65 mph increases fuel consumption by approximately 14% and dramatically increases accident severity risk. Speed compliance directly correlates with both fuel cost and insurance premium rates.
FleetRabbit action: Real-time speed alerts to driver via in-cab app. Fleet manager notified of chronic speed violators with route-level evidence for coaching.
03
Hard Braking & Acceleration Events
What it measures: G-force events exceeding configurable thresholds for deceleration and acceleration — measured per 100 miles and compared to fleet average benchmarks.
Why it matters: Hard braking events are the most predictive single behavioral indicator of collision risk in commercial vehicle telematics research. Drivers with elevated hard-braking rates are 2.4× more likely to be involved in a preventable accident within 12 months.
FleetRabbit action: Event replay with GPS route overlay available for each event — enabling precise coaching discussions about specific driving situations.
04
Idle Time Performance
What it measures: Daily idle hours per driver, broken down by location type (customer dwell, truck stop, route), and compared to fleet average and individual targets.
Why it matters: Idle fuel consumption costs approximately $0.82/hour and generates no revenue. High-idle drivers are often identifiable by pattern — specific customers, specific routes, or specific time windows — enabling targeted interventions.
FleetRabbit action: Daily idle ranking with location hot-spot map. Automatic alerts when single idle events exceed configurable duration thresholds.
05
HOS Compliance Score
What it measures: HOS violations by type (11-hour, 14-hour, 30-minute break, 70-hour weekly), frequency, and severity — with trending over time to identify improving or deteriorating patterns.
Why it matters: Individual driver HOS violations impact the carrier's CSA score for 24 months — affecting insurance rates and shipper qualification decisions across the entire fleet, not just the violating driver. Identifying drivers with chronic HOS issues protects the whole carrier's standing.
FleetRabbit action: Violation history per driver with root cause classification (dispatch-driven vs. driver-driven) enabling targeted corrective action.
06
DVIR Completion Rate
What it measures: Pre-trip and post-trip inspection completion rate, average inspection duration, defect reporting rate, and photo documentation compliance per driver.
Why it matters: Drivers who consistently complete thorough inspections generate lower maintenance costs and fewer roadside breakdowns than drivers who rush or skip inspections. DVIR compliance rate is a strong predictor of overall operational discipline.
FleetRabbit action: Inspection time-per-item analysis flags drivers completing inspections too quickly to be thorough — enabling quality discussions beyond simple completion rate tracking.
07
On-Time Delivery Performance
What it measures: On-time arrival percentage by delivery type, average delay duration, and customer appointment window compliance — distinguishing driver-caused delays from traffic or route factors.
Why it matters: Chronic lateness by specific drivers generates customer penalty exposure, erodes customer relationships, and creates re-dispatch costs. Identifying the pattern at the driver level enables corrective action before the customer escalates or leaves.
FleetRabbit action: Delay attribution analysis separates driver behavior from route/traffic factors — ensuring coaching addresses true driver performance rather than external variables.
08
Seatbelt Compliance & Safety Events
What it measures: Seatbelt usage rate, distracted driving events (where camera AI is integrated), and safety event frequency — compared to fleet baseline and industry benchmarks.
Why it matters: Safety event frequency is the most direct indicator of accident risk and insurance claim likelihood. Carriers with documented safety management programs — including driver safety scoring — achieve lower insurance premiums and stronger legal defensibility in liability claims.
FleetRabbit action: Safety event trend reporting with month-over-month improvement tracking — providing the documented evidence of safety management that insurance underwriters and large shippers require.
FleetRabbit Driver Analytics
Transform Driver Management From Subjective to Data-Driven — Across Your Entire Fleet
FleetRabbit scores every driver across all eight performance dimensions after every trip — giving fleet managers and executives the objective, real-time performance data needed to coach effectively, reward high performance, and protect fleet profitability.
How Fleet Managers and Executives Use FleetRabbit Driver Analytics
Data is only valuable when it drives decisions. FleetRabbit's driver analytics platform is designed around the specific workflows of fleet managers, safety managers, and transportation executives — delivering the right data to each role in the right format for their decision-making needs.
Fleet Manager
Daily Use: Morning Dashboard Review
Fleet managers begin each day with FleetRabbit's driver ranking view — seeing who performed well, who needs attention, and who requires immediate intervention based on the previous day's performance data. The dashboard surfaces the bottom 10% of drivers by composite score and highlights which specific dimension is dragging their score, enabling targeted coaching conversations in the morning briefing.
Daily Driver RankingsException-Based AlertsCoaching Data Export
Safety Manager
Weekly Use: Safety Event Review & Coaching
Safety managers use FleetRabbit's safety event module to review hard braking events, speeding incidents, and safety score trends across all drivers. Each event includes GPS route overlay, vehicle speed at event, and driver history — enabling structured coaching conversations with specific, timestamped evidence rather than general behavioral discussions.
Transportation directors and VPs of Operations use FleetRabbit's executive summary reports to review fleet-wide performance trends, identify systemic issues, and make strategic decisions on driver incentive programs, training investments, and fleet composition. Reports include financial impact quantification — translating performance gaps into concrete cost figures for budget and board presentations.
Driver Incentive Programs — How Analytics Makes Them Credible
Driver retention is one of the most significant cost challenges in commercial trucking — with driver turnover estimated to exceed $8,000 to $12,000 per driver when including recruiting, training, onboarding, and temporary productivity loss. Fleets with structured, analytics-based incentive programs consistently achieve lower turnover rates — because drivers trust a transparent scoring system more than subjective manager evaluations.
Why Data-Driven Incentives Work
✓
Drivers Trust Objective Metrics Over Subjective Ratings
When bonuses are tied to a FleetRabbit score that a driver can see in their own app, the basis for reward is transparent and unambiguous — eliminating the perception of manager favoritism that erodes morale in subjective programs.
✓
Real-Time Visibility Creates Engagement Without Manager Intervention
Drivers who can see their own score trend between shifts are more likely to self-correct behavior — reducing idle time, monitoring speed, and completing inspections properly — without requiring management intervention for every performance gap.
✓
Incentive ROI Is Quantifiable
When FleetRabbit shows that a driver improved their fuel efficiency score from 68 to 84, the financial impact of that improvement is calculable from actual trip data — making the incentive program self-funding in measurable fuel savings alone.
Sample Driver Incentive Structure Using FleetRabbit Scores
Monthly Score
Performance Tier
Incentive Bonus
95–100
★ Elite
$350/month
85–94
High Performer
$200/month
75–84
Solid Performer
$100/month
65–74
Development
Coaching Plan
<65
Performance Review
Formal Process
Fleet Analytics Results — Performance Improvement Across Deployed Fleets
19%
Reduction in Safety Events (Hard Braking + Speeding)
Across fleets using FleetRabbit driver scorecards for 6+ months, safety event frequency drops an average of 19% as drivers self-correct behavior in response to score visibility and structured coaching conversations.
QDo drivers have access to their own performance scores in FleetRabbit?
Yes. FleetRabbit's driver mobile app includes a personal performance dashboard where drivers see their own score breakdown, trend over time, and comparison to fleet averages — without seeing other drivers' individual scores. Driver-facing visibility is the most powerful behavior change mechanism in the platform: drivers who can monitor their own score proactively self-correct far more consistently than those who receive periodic manager feedback alone.
QHow does FleetRabbit's driver scoring account for factors outside the driver's control, like traffic or difficult customers?
FleetRabbit applies normalization algorithms to several scoring dimensions — fuel efficiency scores account for route elevation, vehicle load weight, and speed limit variations so that drivers consistently assigned mountainous or city routes are not penalized relative to highway drivers. On-time delivery delay attribution analyzes route conditions, customer dwell patterns, and appointment window realism to distinguish driver-caused delays from external factors. Book a demo to see the normalization methodology in action.
QWhat data does FleetRabbit use to generate driver scores, and does it require additional equipment?
FleetRabbit generates driver scores from GPS telematics data (speed, location, route), engine diagnostics (fuel consumption, idle time, hard event G-force recording), ELD/HOS records, DVIR completion data from the driver app, and delivery time records from dispatch integration. Most of this data is available from telematics providers already deployed in typical commercial fleets — no additional specialized hardware is required beyond existing ELD and GPS devices.
QCan FleetRabbit driver analytics be used as part of a formal HR disciplinary process?
Yes. FleetRabbit generates timestamped, exportable performance reports that document specific events, patterns, and trends — suitable for inclusion in formal HR documentation, Progressive Improvement Plan (PIP) records, and arbitration proceedings. The coaching log feature within FleetRabbit records each coaching conversation date, the data reviewed, and the manager's notes — creating a documented performance management trail that supports defensible employment decisions.
QHow do I get driver buy-in for a performance scoring program?
The most effective approach is transparency from the start: introduce the scoring system in a fleet meeting, explain every dimension and how it's calculated, give drivers access to their own scores before managers begin coaching on them, and immediately connect scores to positive recognition for high performers alongside coaching for low performers. FleetRabbit recommends deploying a 30-day observation period with driver access before any formal evaluation — allowing drivers to understand the system and begin self-correcting before it affects their standing. Start your free trial to explore the driver engagement features.
Stop Managing Driver Performance by Instinct. Start Managing It with Data.
FleetRabbit's driver analytics platform scores every driver across all eight performance dimensions after every trip — giving fleet managers, safety managers, and transportation executives the objective, real-time data needed to coach effectively, reduce safety events, cut fuel costs, and retain your best drivers.