Performance Guide | FleetRabbit
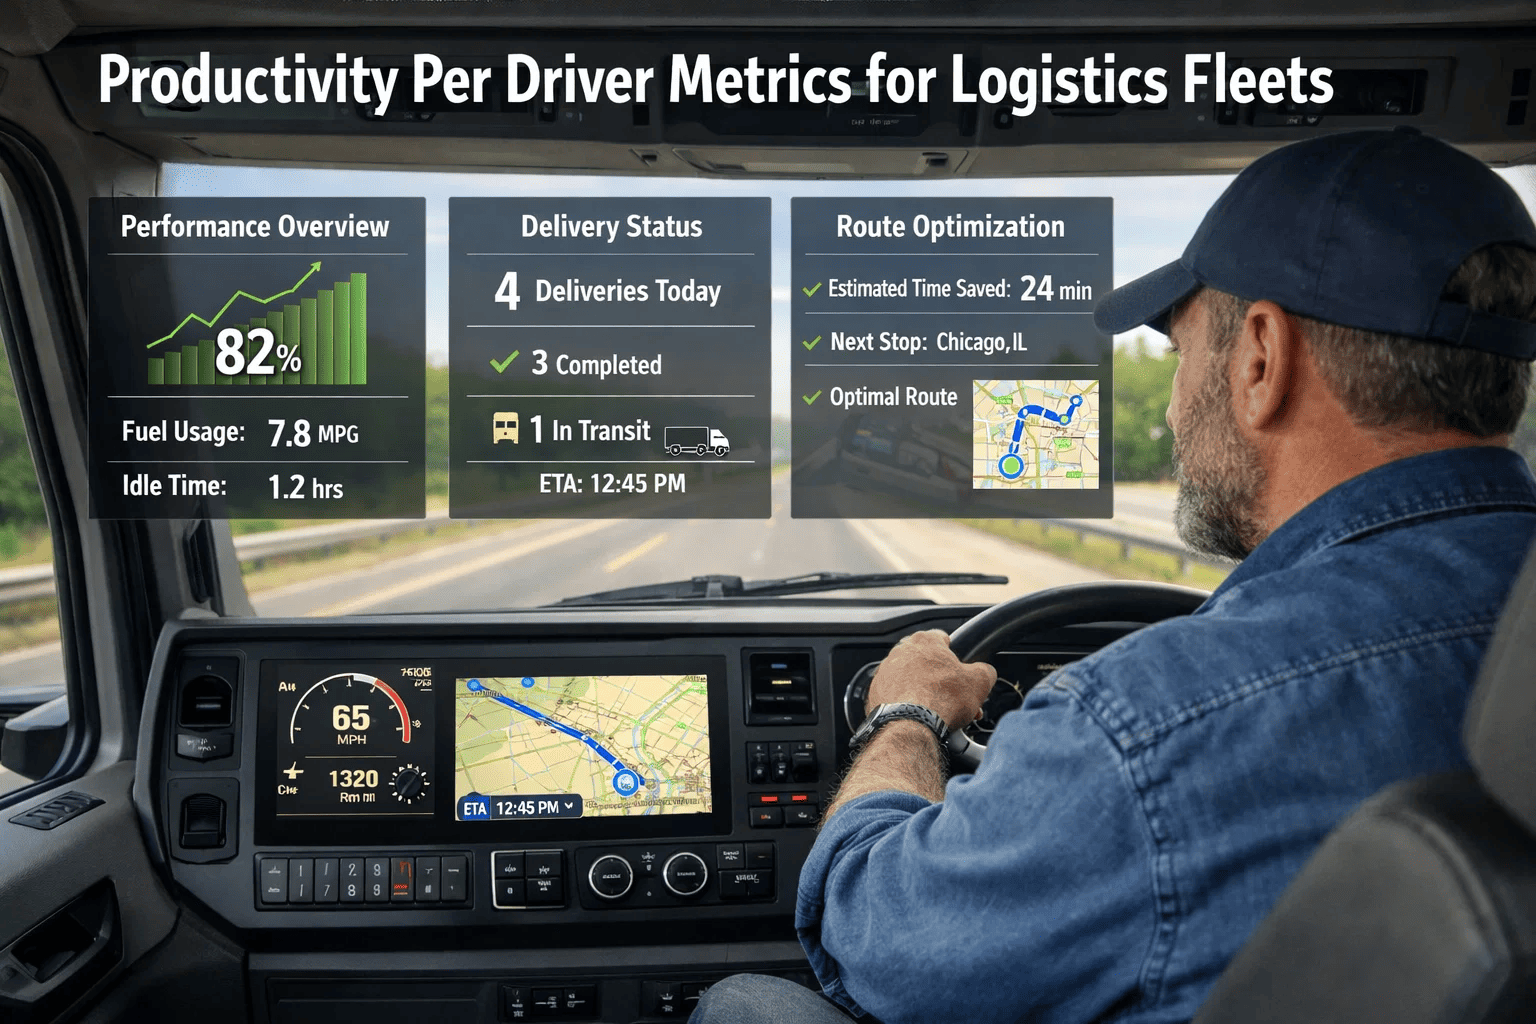
Driver productivity is a critical performance indicator that directly impacts the efficiency and profitability of logistics fleets. By tracking key metrics such as deliveries per day, on-time performance, idle time, route efficiency, and fuel usage, fleet managers can accurately evaluate how effectively each driver is contributing to operations. Leveraging real-time fleet data and telematics insights allows businesses to identify performance gaps, reduce delays, and optimize route planning. Additionally, monitoring driver KPIs helps improve accountability, enhance safety, and support targeted training programs. With data-driven productivity analysis, logistics companies can maximize output per driver, reduce operational costs, and ensure consistent, high-quality delivery performance.
Why Driver Productivity Metrics Are Essential for Logistics Fleet Performance
In logistics fleet operations, driver productivity is the human dimension of operational excellence. While vehicle utilization, route efficiency, and fuel consumption are measurable at the asset level, it is ultimately driver performance that determines whether a fleet delivers on its service commitments, manages costs within budget, and operates safely within regulatory boundaries. Fleets that do not systematically measure driver productivity are consistently paying for performance they cannot quantify, coach toward improvement they cannot define, and accepting outcomes they cannot predict.
Driver productivity metrics provide logistics operators with a structured, data-driven framework for evaluating how effectively each driver converts available time, vehicle capacity, and route miles into completed deliveries, on-time performance, and compliant operations. When measured correctly and reviewed consistently, these metrics identify coaching opportunities before they become compliance violations, recognize high performers before they leave for competitors, and give dispatchers the data they need to assign loads intelligently rather than by habit.
FleetRabbit's fleet performance analytics module captures driver productivity KPIs from telematics, ELD records, dispatch data, and delivery confirmation systems, presenting them in driver-specific scorecards and fleet-wide benchmark reports that give logistics managers full visibility into human-side performance across every driver on the roster.
23%
Average improvement in on-time delivery rates when fleets implement structured driver performance monitoring and coaching programs
31%
Reduction in HOS violations achieved by fleets using real-time driver productivity dashboards with proactive alert systems
$4,200
Estimated annual fuel savings per driver when productivity coaching reduces idle time and improves route adherence
18%
Decrease in driver turnover reported by fleets using transparent performance data for recognition and compensation alignment
The Core Driver Productivity KPIs for Logistics Fleets
Effective driver productivity measurement begins with identifying the right key performance indicators — metrics that are both meaningful and actionable. Measuring the wrong KPIs produces data that does not drive improvement. The following metrics represent the core productivity framework for logistics fleet drivers.
Miles Driven Per Day and Per Week
Total miles driven per available work day and work week reflect how effectively a driver is utilizing available HOS capacity. Drivers consistently below fleet averages for mileage may have scheduling gaps, route assignment inefficiencies, or personal performance issues. Drivers running significantly above average relative to their HOS capacity may be under pressure that warrants investigation to ensure compliance and safety. FleetRabbit pulls verified mileage from GPS records to ensure accuracy.
Loads Completed Per Week
For drivers in multi-stop delivery or dedicated route roles, load count per week measures output volume relative to schedule. Comparing load completions against dispatch targets reveals whether underperformance stems from route design, customer appointment constraints, traffic conditions, or driver efficiency. Load completion rate also informs rate negotiations with shippers by providing documented delivery capacity evidence.
On-Time Delivery Percentage
On-time delivery is the customer-facing metric that most directly reflects driver productivity in logistics operations. FleetRabbit captures planned versus actual arrival times using GPS geofencing, calculating each driver's on-time delivery percentage automatically from delivery activity data. This metric eliminates the subjectivity of self-reported delivery times and provides an unambiguous picture of punctuality performance across the driver pool.
HOS Utilization Rate
HOS utilization rate measures the percentage of legally available driving time that drivers actually use for productive miles. Drivers with consistently low HOS utilization are leaving revenue capacity on the table — whether due to excessive breaks, long dwells at facilities, or scheduling inefficiencies. Conversely, drivers approaching HOS limits frequently may need route adjustments or scheduling support to prevent violations that generate CSA points and compliance exposure.
Driver Safety Score
Safety scores composite telematics data on harsh braking events, rapid acceleration incidents, speeding occurrences, hard cornering, and mobile device usage while moving. High safety scores correlate with lower accident rates, reduced vehicle wear, better fuel economy, and lower insurance premiums. FleetRabbit calculates rolling safety scores for every driver and benchmarks them against the fleet average, flagging drivers whose scores deviate significantly downward for priority coaching attention.
Idle Time Rate
Idle time rate measures the percentage of engine-on time spent at zero speed with the engine running unnecessarily. Excessive idling directly inflates fuel CPM, accelerates engine wear, and indicates inefficient time management at pickup and delivery facilities. FleetRabbit's idle time reports break down idle events by duration and location, enabling managers to distinguish between operational waiting time — which may be the shipper's fault — and personal idling that reflects driver behavior.
How FleetRabbit Measures and Reports Driver Productivity
Collecting driver productivity data manually through paper logs, phone check-ins, and spreadsheet reconciliation is both unreliable and time-consuming. Data is frequently incomplete, delayed, and subject to reporting bias that makes coaching conversations difficult to substantiate. FleetRabbit replaces manual data collection with automated, continuous capture from integrated data sources that produce accurate driver scorecards without administrative overhead.
Automated Driver Scorecards
FleetRabbit generates individual driver scorecards that aggregate performance across all core KPIs — mileage, load completions, on-time delivery, safety score, HOS utilization, and idle time — into a single, weighted composite score. Scorecards update continuously as new data arrives, ensuring fleet managers always have a current view of each driver's performance without waiting for end-of-week report compilation. Drivers can also access their own scorecards through the FleetRabbit mobile app, creating transparency and self-awareness that motivates improvement without requiring manager intervention for every performance issue.
Fleet-Wide Driver Ranking and Benchmarking
FleetRabbit ranks all drivers against fleet averages and against each other, enabling managers to quickly identify the top and bottom performers across every KPI category. This benchmarking is configurable by fleet segment — linehaul drivers versus local delivery drivers, flatbed operators versus reefer drivers — to ensure comparisons are made among operationally similar driver groups. Ranking reports are particularly useful for recognition programs, bonus calculation, and performance improvement plan documentation.
Real-Time Driver Alerts and Exception Monitoring
Rather than discovering performance issues only during weekly or monthly reviews, FleetRabbit surfaces real-time alerts for critical driver events — HOS limit approaches, harsh driving incidents, route deviations, extended unauthorized stops, and geofence violations. Dispatchers and safety managers receive these alerts through the FleetRabbit dashboard and mobile app, enabling immediate response before a performance issue becomes a compliance violation or safety incident.
HOS Compliance Monitoring and Predictive Alerts
FleetRabbit monitors each driver's current HOS status in real time, calculating remaining drive time, required rest periods, and 70-hour cycle availability. Predictive alerts notify dispatchers when a driver's available hours are insufficient to complete an assigned load before mandatory rest is required, enabling proactive load reassignment before drivers are put in positions where HOS violations become likely. This predictive approach reduces violations and the associated CSA score deterioration that follows.
Building an Effective Driver Coaching Program With FleetRabbit Data
Driver productivity data is the foundation of effective coaching — but data alone does not improve performance. Coaches and fleet managers must translate metric insights into structured, consistent, and documented coaching conversations that give drivers specific behavioral targets and clear expectations for improvement timelines. FleetRabbit provides the data framework that makes coaching both evidence-based and efficient.
Identifying Coaching Priorities by Driver
FleetRabbit's driver scorecard system highlights which KPIs are below threshold for each driver, automatically prioritizing the coaching areas with the greatest impact potential. Fleet managers can sort drivers by their lowest-scoring KPI to identify which performance category needs the most fleet-wide attention, and can filter to individual drivers for one-on-one coaching preparation. This targeting ensures coaching time is invested in the areas with the highest improvement potential rather than spread uniformly across all metrics.
Documenting Coaching Conversations
Consistent documentation of driver coaching conversations, performance targets, and follow-up commitments is essential for progressive discipline compliance and for demonstrating good faith efforts in the event of regulatory audits or legal proceedings. FleetRabbit's team management module provides a structured framework for recording coaching events, noting action items, and tracking performance changes in the weeks following coaching sessions to measure effectiveness.
Recognition and Incentive Programs
High-performing drivers who consistently rank at the top of scorecard rankings represent a fleet asset that is easily overlooked when performance management focuses exclusively on problem drivers. FleetRabbit's ranking system enables fleet managers to identify top performers objectively and recognize them through formal incentive programs — fuel efficiency bonuses, safety recognition awards, or preferential load assignment — that reinforce the behaviors that drive fleet financial performance.
Trend Analysis for Improvement Tracking
Individual driver scorecards in FleetRabbit maintain historical trend data, allowing managers to visualize whether a driver's performance is improving, declining, or plateauing after a coaching intervention. Upward trends validate coaching approaches and recognize driver effort. Flatline or declining trends after coaching may indicate that additional support, route changes, or more serious performance management steps are warranted. This trend visibility makes coaching programs measurable and accountable.
Route Efficiency Metrics and Driver Productivity
Driver productivity cannot be evaluated accurately without accounting for route characteristics. A driver running a demanding urban multi-stop route will naturally produce lower miles-per-day and higher idle-time metrics than a long-haul driver on dedicated interstate lanes — not because of performance differences but because of route design differences. Effective productivity measurement contextualizes driver KPIs against route difficulty and order density factors.
FleetRabbit's dispatch integration captures route assignments alongside driver performance data, enabling analytics that control for route characteristics when comparing driver productivity. Fleet managers can identify whether a driver's below-average load completion rate is driven by route timing problems — shipment appointment windows, receiver dock availability — or individual performance factors. This context prevents unfair evaluation of drivers who are performing efficiently within route constraints they cannot control.
Planned vs. Actual Route Adherence
FleetRabbit compares planned route sequences against actual GPS-tracked routes, identifying drivers who consistently deviate from optimal paths. Route deviations add unnecessary miles and time, increasing cost per delivery and reducing the number of stops a driver can complete per shift. Systematic route deviation patterns often indicate drivers who have developed personal preferences for longer but more comfortable driving paths — a habit that adds measurable cost to every route they run.
Dwell Time at Pickup and Delivery Locations
Dwell time — the duration a truck spends at a loading dock or delivery location — directly impacts driver productivity and load capacity per day. FleetRabbit uses geofence entry and exit timestamps to measure dwell time at every stop, identifying locations with consistently long dwell times that may warrant shipper negotiation or appointment window adjustments. Excessive dwell time is frequently a facility problem rather than a driver problem, but the data is needed to distinguish the two.
Stop Completion Rate and Sequence Efficiency
For multi-stop delivery drivers, stop completion rate measures the percentage of planned stops completed per shift without carryover to the next day. Stop sequence efficiency evaluates whether the order in which stops are completed minimizes total route time compared to the optimal sequence. FleetRabbit's dispatch analytics flag routes where stop sequencing is suboptimal, enabling dispatchers to improve route planning for subsequent days and reduce total route time without adding driver hours.
Empty Miles Percentage
Empty miles — miles driven without a loaded trailer — represent pure cost with no revenue offset. Reducing empty miles is a primary driver productivity and profitability lever. FleetRabbit tracks loaded versus empty miles by driver and by lane, giving fleet managers and capacity planners the data to identify opportunities for backhaul load matching that converts empty return miles into revenue. Even a 10 percent reduction in fleet-wide empty miles produces significant improvements in revenue per mile metrics.
How FleetRabbit Supports Driver Retention Through Transparent Metrics
Driver turnover is among the most expensive recurring costs in transportation and logistics, with replacement costs per driver estimated between $8,000 and $12,000 when recruiting, onboarding, training, and productivity ramp-up are fully accounted for. One often-overlooked driver of turnover is the perception of unfair treatment — drivers who feel their performance is evaluated subjectively or that good work goes unrecognized are disproportionately likely to leave for competitors.
Transparent, data-driven performance metrics change this dynamic. When drivers know exactly what is being measured, how their scorecard is calculated, and that every driver is evaluated by the same objective criteria, the perception of favoritism is replaced by a culture of meritocracy. FleetRabbit's driver-facing mobile scorecards give each driver access to their own performance data in real time, removing ambiguity about where they stand and what they need to do to improve or qualify for incentive programs.
Frequently Asked Questions
What are the most important driver productivity metrics for logistics fleets?
The most impactful driver productivity metrics for logistics operations are on-time delivery percentage, HOS utilization rate, driver safety score, miles per available work day, idle time rate, and loads completed per week. These six metrics cover the dimensions of delivery performance, regulatory compliance, safety, revenue capacity utilization, fuel efficiency, and operational output that collectively define driver productivity in the trucking context. FleetRabbit calculates and tracks all six automatically from integrated telematics, ELD, and dispatch data.
How does FleetRabbit calculate driver safety scores?
FleetRabbit calculates driver safety scores by aggregating telematics-captured event data including harsh braking frequency, rapid acceleration events, speeding occurrences by severity, hard cornering incidents, and HOS violation records. Each event type is weighted according to its statistical correlation with accident risk, and scores are calculated on rolling 30-day and 90-day windows. Fleet managers can configure custom weighting profiles to align scoring with their specific safety priorities and insurance requirements.
Can FleetRabbit identify which drivers are at risk of leaving due to low job satisfaction?
While FleetRabbit does not directly measure job satisfaction, it identifies early warning indicators associated with disengagement — declining productivity trends, increasing HOS violations, route deviation patterns, and reduced load acceptance rates. Fleet managers can use these behavioral signals, combined with structured scorecard review conversations, to identify drivers who may be struggling and intervene proactively with schedule adjustments, route reassignments, or coaching support before disengagement leads to resignation.
How should fleet managers use driver productivity data in performance reviews?
Driver productivity data is most effective in performance reviews when it is used as a collaborative discussion tool rather than a disciplinary instrument. Managers should present scorecard data transparently, explain how each metric is calculated, acknowledge driver context such as challenging routes or shipper-caused delays, and focus conversations on specific behavioral changes rather than abstract score improvements. FleetRabbit's historical trend visualization helps frame reviews as progress tracking rather than performance judgments, which tends to produce better engagement and more sustainable improvement outcomes.
What role does dispatch planning play in driver productivity metrics?
Dispatch planning has a significant and often underappreciated influence on driver productivity metrics. Poorly designed routes, unrealistic appointment windows, inefficient load sequencing, and inadequate empty miles management inflate driver time requirements without improving output. FleetRabbit's integration with dispatch data enables analytics that separate the drivers' contribution to productivity from the system-side factors that constrain what drivers can achieve. Fleet managers can identify whether low productivity scores reflect driver performance issues or dispatch planning problems, directing improvement efforts to the right root cause.
How can productivity metrics help reduce driver HOS violations?
HOS violations most commonly occur when drivers are in situations where completing their assigned work within HOS limits requires either rushing — which creates safety risk — or violating the rules to avoid detention penalties or shipper complaints. FleetRabbit's HOS utilization monitoring and predictive alerts allow dispatchers to identify when a driver's remaining hours are insufficient for an assigned load before the driver departs, enabling reassignment or load splitting that prevents violations before they occur rather than recording them after the fact.
Build a High-Performance Driver Fleet With FleetRabbit
Driver productivity is the most direct indicator of logistics fleet performance quality. Fleets that measure it rigorously, report it transparently, coach to it consistently, and recognize it through structured incentive programs outperform competitors on every dimension that matters — delivery reliability, cost efficiency, safety record, and driver retention.
FleetRabbit provides the measurement foundation, the coaching tools, and the operational integrations that transform driver productivity from an aspiration into a managed, measurable, and continuously improving operational capability.
See FleetRabbit Driver Performance Management in Action
Schedule a live FleetRabbit demonstration to see driver scorecards, real-time HOS monitoring, fleet-wide productivity benchmarking, and coaching documentation tools operating together in a single platform built specifically for transportation and logistics fleet management.
Book a Free Demo
Start Free Trial
April 14, 2026
By Nathan Smith
All Posts