Somewhere between the warehouse and the customer's front door sits the most expensive stretch of any shipment's journey. The last mile accounts for roughly 53 percent of total shipping cost, and it's also the stretch where things go wrong the most, a driver stuck rebuilding a route by hand after a no-show, a truck breaking down mid-route and dragging fifteen or twenty delivery windows down with it, a failed delivery that doubles the cost of getting that one package to its destination. Carriers running that stretch on disconnected tools, a route planner here, a GPS app there, a spreadsheet for compliance, are absorbing costs that a single connected platform is built to eliminate.
The best last-mile delivery fleet management for carriers in 2026 combines route optimization, real-time GPS tracking, driver dispatch, proof of delivery, maintenance scheduling, and compliance tracking into one connected platform. Carriers running route optimization software typically cut last-mile cost per delivery by 18 to 25 percent, reduce failed deliveries by 28 to 35 percent, and recover the full cost of the platform within 45 to 60 days.
Why the Last Mile Breaks So Easily
A last-mile operation isn't one system, it's four or five that all have to stay in sync for a single delivery to succeed on time: the route plan, the vehicle, the driver, the customer's time window, and the paperwork proving it happened. When those pieces live in separate tools, one disruption cascades through all of them. A vehicle breakdown doesn't just strand one delivery, it can push fifteen to twenty service-level misses in under two hours while a dispatcher manually rebuilds routes by hand.
Mid-Route Breakdowns
A single vehicle failure can cascade into fifteen to twenty SLA misses while a dispatcher scrambles to rebuild routes manually.
Failed Delivery Attempts
Failed deliveries average around $17.78 each and represent roughly 5 percent of all last-mile deliveries, doubling the cost of that stop.
Manual Route Rebuilding
A no-show driver forces a dispatcher to reshuffle a full day of stops by hand instead of a system doing it automatically.
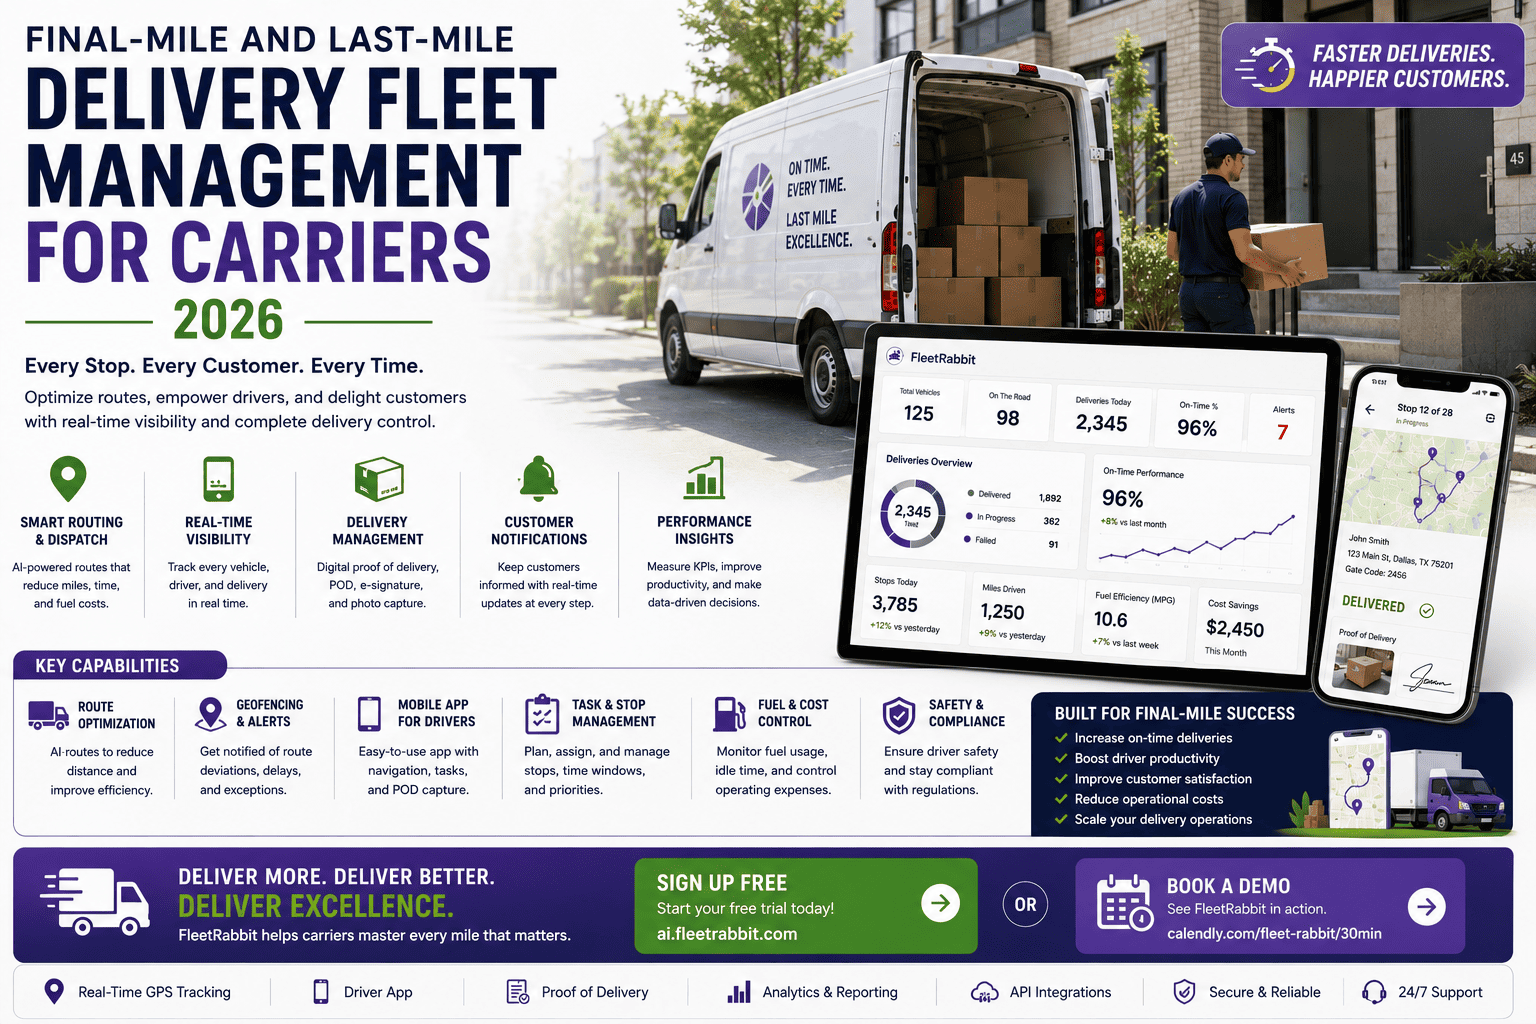
FleetRabbit connects route optimization, GPS tracking, driver dispatch, proof of delivery, maintenance, and compliance into one live view of your fleet. Sign up for a free trial and see your first optimized routes today, or book a demo to walk through your current delivery volume and depot setup.
What a Complete Last-Mile Platform Actually Covers
A tracking app tells you where a truck is. A route planner tells you where it should go next. Neither one, on its own, prevents the cascading failures that actually eat into margin. The carriers pulling ahead in 2026 run every one of these functions from a single connected system instead of stitching several apps together.
Route Optimization
Multi-stop planning that accounts for real traffic conditions, vehicle capacity, and delivery time windows, not just static mapping.
Real-Time GPS Tracking
Live visibility across every vehicle and driver, so a delay gets caught and rerouted around instead of discovered after the fact.
Driver Dispatch
Automatic reassignment when a driver or vehicle drops out, instead of a dispatcher rebuilding a day's routes by hand.
Proof of Delivery
Sign-on-glass and photo capture tied to each stop, closing disputes before they become chargebacks.
Predictive Maintenance
Vehicle health monitoring that catches developing issues before they become the mid-route breakdown that derails a shift.
Compliance Tracking
ELD-compliant hours-of-service, DVIR, and driver qualification file management built into the same platform, not a separate system.
Why Vehicle Reliability Is a Route Optimization Problem Too
Route optimization only delivers what it promises if the vehicle actually completes the route. A perfectly planned day falls apart the moment a van breaks down two stops in, and every delivery behind it slips. That's why predictive maintenance sits underneath route optimization rather than beside it as a separate concern, cutting the vehicle downtime that would otherwise unravel a well-planned route from the inside.
What the Numbers Look Like Once It's Running
| Metric | Typical Improvement |
|---|---|
| Fuel Costs | 22 to 30 percent reduction through optimized routing and less idle time |
| Failed Deliveries | 28 to 35 percent fewer failed attempts through accurate time-window matching |
| Stops Per Vehicle Per Shift | 15 to 20 percent more stops completed in the same working hours |
| On-Time Delivery Rate | 18 to 24 percent improvement in delivery windows met |
| Total Last-Mile Cost | 18 to 25 percent reduction within 90 days of deployment |
Why Vehicle Downtime Numbers Matter Just as Much
Predictive, AI-driven fault detection and automated maintenance scheduling has been shown to cut vehicle downtime by around 40 percent, which is the reliability foundation route optimization depends on to actually function as planned. A route built around vehicles that stay in service is worth far more than a mathematically perfect one built around vehicles that don't.
Getting Set Up Without Disrupting Live Routes
Switching platforms mid-operation is the biggest hesitation most carriers have, and it's a fair one. A well-built implementation should let a carrier go live on a connected platform within about five business days, running new routes alongside existing ones until the transition is confirmed rather than cutting over all at once. If you want to see what that timeline looks like against your specific depot count and vehicle mix, book a demo and walk through it directly, or sign up to test it against a real day of routes first.
FAQ
Every disruption in a last-mile operation cascades because the systems tracking it don't talk to each other. FleetRabbit connects route optimization, tracking, dispatch, maintenance, and compliance into one platform built for how carriers actually run delivery fleets.







