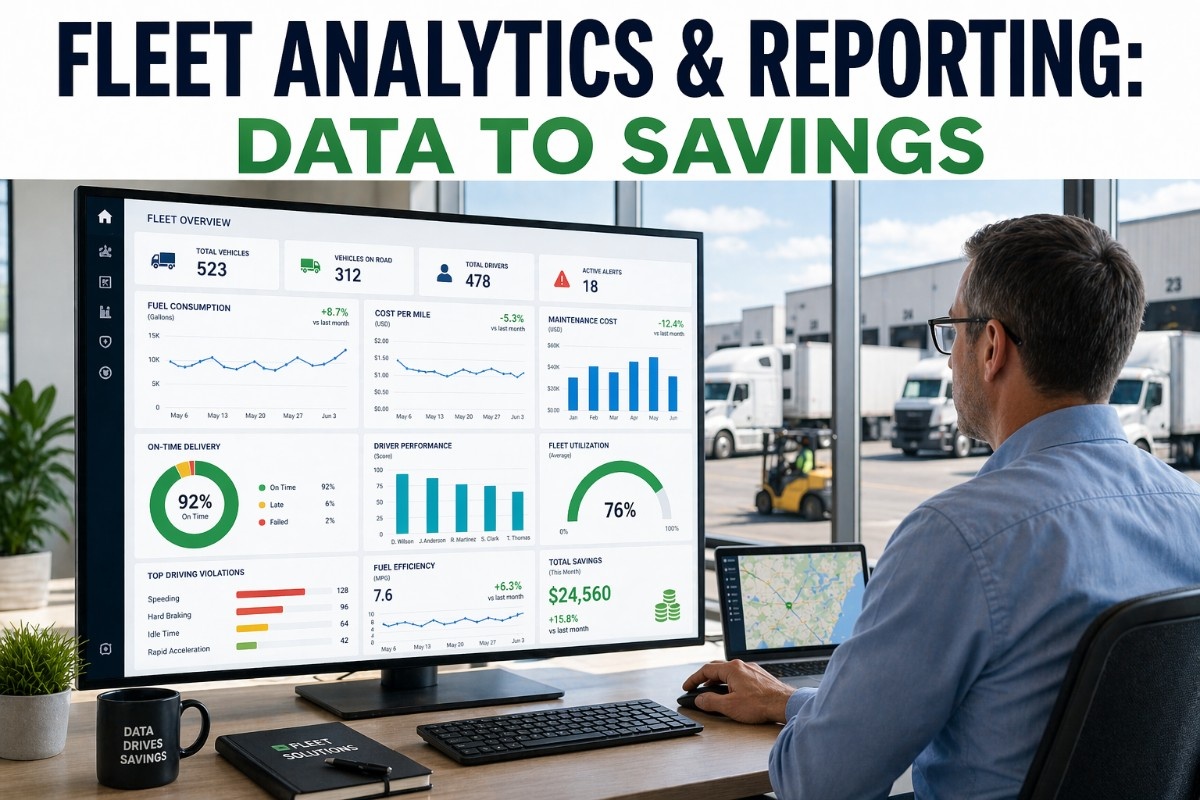
The era of gut-feel fleet management is over. Transportation and logistics operators who continue to make vehicle replacement, route planning, and driver coaching decisions based on intuition rather than operational data are leaving measurable cost savings on the table — and ceding competitive advantage to fleets that have embedded real-time analytics into their daily management routines. Fleet analytics has moved from a strategic differentiator to an operational necessity. The question for fleet managers and operations executives is no longer whether to adopt data-driven management — it is how to translate the raw telematics data streaming from their vehicles into actionable cost-saving decisions without drowning in dashboard overload.
Data Analytics
Fleet Technology
High Priority
10 min read
Guide Overview
This guide covers the complete framework for implementing fleet analytics and reporting in logistics operations — from defining the right KPIs and building a data infrastructure to actionable reporting strategies that convert raw vehicle telematics into measurable cost reduction across fuel, maintenance, utilisation, and safety domains. FleetRabbit provides the analytics platform that transforms vehicle data into decision-ready dashboards, exception-based alerts, and custom reports — enabling fleet managers to identify cost leakage within hours rather than weeks.
12-18%
fuel cost reduction achievable through data-driven driver coaching and route optimisation based on telematics analytics
23%
reduction in unscheduled maintenance events when fleets implement predictive analytics driven by real-time vehicle data
8-11%
improvement in fleet utilisation rates through data-driven asset allocation and idle time reduction strategies
$1,200
average annual cost saving per vehicle from reduced idling identified through telematics analytics and driver feedback programmes
Why Fleet Analytics Is No Longer Optional for Cost Management
Traditional fleet cost management relies on lagging indicators — fuel card summaries received weeks after the fuel was purchased, maintenance invoices processed months after the repair was completed, and annual utilisation reviews that cannot capture the operational inefficiencies that compound daily. Fleet analytics inverts this model. Real-time data streams from vehicle telematics create visibility into cost drivers as they occur, enabling fleet managers to intervene before small inefficiencies become large expense line items.
The market shift toward analytics-driven fleet management is being driven by three converging forces. First, telematics hardware costs have fallen to the point where whole-fleet deployment is economically justifiable for fleets of virtually any size. Second, cloud-based analytics platforms have eliminated the data engineering resources previously required to transform raw telematics data into decision-ready information. Third, the expansion of low-emission zones, carbon reporting requirements, and shipper sustainability contracts has created new reporting obligations that cannot be met without granular operational data. Fleet managers who wait to build analytics capability will find themselves unable to meet the compliance and commercial requirements that are already becoming standard industry practice.
Cost Driver
Fuel Inefficiency Analytics
Fuel represents the largest variable operating cost for most logistics fleets — typically 25 to 35 percent of total operating expense. Analytics platforms that track fuel consumption against distance, load weight, route gradient, and driver behaviour patterns can identify specific inefficiencies that aggregate fuel cost summaries cannot reveal. Fleet managers using FleetRabbit's fuel analytics routinely identify vehicles operating 15 to 20 percent below fleet average fuel efficiency — and the specific driver behaviours or mechanical issues driving that underperformance.
Cost Driver
Maintenance Cost Analytics
Unscheduled maintenance events create three layers of cost — the repair bill itself, the revenue loss from vehicle downtime, and the expedited logistics cost of covering the route with another asset. Predictive analytics that monitor engine parameters, brake wear patterns, and tyre pressure data can identify developing issues before they become roadside failures. Fleets using FleetRabbit's maintenance analytics typically shift 30 to 40 percent of maintenance events from reactive to planned — reducing both repair costs and downtime days.
Cost Driver
Utilisation Analytics
Underutilised assets are hidden cost centres — vehicles that sit idle for extended periods while carrying the same fixed costs as high-utilisation fleet vehicles. Analytics platforms that track vehicle utilisation by hour, by day, and by route can identify assets that could be redeployed, routes that could be consolidated, and peak periods where temporary capacity would be more cost-effective than maintaining underutilised owned assets. FleetRabbit's utilisation analytics typically reveal 8 to 12 percent of fleet capacity that can be redeployed or eliminated without service degradation.
Cost Driver
Driver Performance Analytics
Driver behaviour directly affects fuel consumption, vehicle wear, and safety costs. Analytics platforms that track speeding events, harsh braking, rapid acceleration, and excessive idling create objective performance data that enables targeted coaching rather than blanket training programmes. Fleets using FleetRabbit's driver scoring module typically see measurable behaviour improvement within 30 to 60 days of implementing data-driven coaching programmes — with corresponding reductions in fuel consumption and maintenance incidence.
The Essential Fleet KPIs That Drive Cost Reduction
Not all fleet metrics drive cost savings. Fleet managers implementing analytics programmes must distinguish between vanity metrics that look interesting on dashboards but do not inform action, and performance indicators that directly correlate with operating cost. The KPIs below represent the metrics that consistently differentiate high-performing transport fleets from their peers — and the analytics required to track them effectively.
01
Cost Per Mile or Per Kilometre
The foundational fleet cost metric — total operating cost divided by distance travelled. FleetRabbit calculates this metric automatically from fuel spend, maintenance cost, insurance allocation, and driver costs. The value comes not from the fleet average but from the variance between vehicles, routes, and drivers. A fleet with low average cost per mile but high variance between best and worst performers has clear cost reduction opportunities through root cause analysis of the variance drivers.
02
Fuel Efficiency Variance
Fuel consumption per unit of distance — but tracked at vehicle, driver, and route levels rather than fleet average. Analytics-driven fleets monitor the gap between top-quartile and bottom-quartile fuel efficiency within their fleet. Closing that gap by moving bottom performers toward top-quartile efficiency delivers immediate fuel cost reduction without new capital investment. The analytics requirement is driver-attributed fuel data and route-normalised efficiency comparisons.
03
Idle Time Percentage
The percentage of engine-on time where the vehicle is stationary. Idle time represents pure waste — fuel consumed, engine hours accumulated, and emissions generated without completing any revenue-generating distance. Analytics platforms that track idle time by driver, by vehicle, and by time of day enable targeted intervention. FleetRabbit's idle time alerts notify supervisors when a vehicle exceeds configurable idle duration thresholds — enabling real-time intervention rather than after-the-fact reporting.
04
Unscheduled Maintenance Ratio
The percentage of maintenance events that are unscheduled — breakdowns, roadside failures, and emergency repairs versus planned service. High unscheduled maintenance ratios indicate either ageing fleet assets, inadequate preventive maintenance programmes, or missed early warning signs that telematics analytics could have detected. Fleet managers using FleetRabbit's predictive maintenance module typically reduce unscheduled maintenance ratios from industry averages of 25 to 30 percent down to 10 to 15 percent.
05
Vehicle Utilisation Rate
The percentage of available fleet capacity that is actively generating revenue — typically measured as hours in motion divided by available operating hours, or payload capacity utilisation for mixed fleets. Analytics tracking utilisation by asset, by route, and by time period enables data-driven decisions about fleet sizing, asset redeployment, and peak capacity strategies.
06
Safety Event Frequency
The frequency of harsh braking events, speeding incidents, and rapid acceleration occurrences per thousand miles or kilometres. These driving behaviour metrics correlate directly with accident risk, insurance cost, and vehicle wear — particularly brake and tyre life. Analytics platforms that track safety event frequency by driver enable targeted coaching programmes that reduce both crash risk and the accelerated component wear caused by aggressive driving patterns.
Turn Your Fleet Data into Actionable Cost Savings
FleetRabbit's analytics dashboard transforms raw telematics into decision-ready KPIs, exception alerts, and custom reports — giving fleet managers the visibility required to identify cost leakage before it impacts the bottom line.
Building a Fleet Reporting Framework That Drives Action
The most sophisticated analytics platform delivers no value if the reporting output does not translate into operational action. Fleet managers must design reporting frameworks that deliver the right information to the right people at the right time — not comprehensive dashboards that stakeholders view once and ignore thereafter. Effective fleet reporting follows a three-tier structure.
Tier One
Executive Strategic Dashboard
Senior management and board-level stakeholders require high-level trend data, not operational detail. An executive fleet dashboard should present fleet operating cost as a percentage of revenue, year-on-year cost per mile trend, fleet utilisation rate, unscheduled maintenance percentage, and safety incident frequency trend — typically on a monthly or quarterly cadence. The strategic dashboard answers the question: Is fleet cost performance improving or deteriorating relative to plan and relative to industry benchmarks?
Cost per mile trend
Fleet utilisation rate
Safety incident frequency
Tier Two
Operational Management Dashboard
Fleet managers and operations supervisors need daily and weekly visibility into cost drivers that are within their span of control. The operational dashboard should present fuel efficiency by vehicle and driver, idle time by driver and depot, unscheduled maintenance events by vehicle, utilisation by asset, and exception alerts for vehicles or drivers operating outside acceptable parameters. FleetRabbit's operational dashboard updates in near real-time and surfaces exceptions automatically — enabling supervisors to focus on outliers rather than reviewing every vehicle.
Driver fuel efficiency ranking
Idle time exception alerts
Vehicle maintenance status
Tier Three
Driver and Vehicle Scorecards
Front-line drivers and vehicle maintenance technicians need individual performance feedback, not fleet aggregates. Driver scorecards should present each driver's fuel efficiency, idle time, and safety event frequency compared to fleet average and compared to their own prior period performance. Vehicle scorecards should present maintenance history, upcoming service requirements, and any active diagnostic alerts. FleetRabbit's automated scorecard delivery ensures that performance feedback reaches individual drivers and technicians without administrative overhead.
Individual driver performance
Vehicle maintenance schedule
Diagnostic alert status
From Raw Data to Actionable Intelligence: The Analytics Workflow
Telematics hardware generates thousands of data points per vehicle per operating day — engine parameters, GPS location, speed, acceleration, braking, fuel consumption, diagnostic trouble codes, and more. The challenge for fleet managers is not data availability but data utility. An effective fleet analytics workflow transforms raw telematics into actionable intelligence through four distinct stages.
Stage One: Data Collection and Aggregation
Raw telematics data streams from each vehicle must be collected, time-stamped, and aggregated into a central repository. FleetRabbit's platform ingests data from all major telematics hardware providers — eliminating the fragmentation that occurs when fleets use multiple hardware platforms or when acquired fleets bring incompatible systems. The aggregation stage also applies data validation rules to filter erroneous readings that would distort analytics output.
Stage Two: Metric Calculation and Normalisation
Raw data becomes meaningful only when calculated into standardised metrics — fuel consumption per mile, idle time as a percentage of engine-on time, safety events per thousand miles. Normalisation adjusts for variables outside driver control, such as route gradient, load weight, and traffic conditions. FleetRabbit's metric calculation engine applies industry-standard formulas and normalisation algorithms, ensuring that performance comparisons reflect driver and vehicle factors rather than route characteristics.
Stage Three: Exception Detection and Alerting
Fleet managers cannot review every metric for every vehicle every day. Exception-based analytics surfaces only the vehicles, drivers, or metrics that fall outside established thresholds. FleetRabbit's configurable alert engine notifies supervisors when a vehicle exceeds idle time thresholds, when a driver's fuel efficiency drops below acceptable levels, or when diagnostic trouble codes indicate developing mechanical issues — enabling intervention before small problems escalate.
Stage Four: Reporting and Workflow Integration
Analytics outputs must integrate with existing fleet management workflows to drive action. Maintenance alerts should generate work orders in the fleet maintenance system. Driver performance exceptions should trigger coaching notifications to the relevant supervisor. Fuel efficiency alerts should route to the dispatcher for route optimisation consideration. FleetRabbit's workflow integration ensures that analytics insights become operational actions rather than dashboard decorations.
How FleetRabbit Transforms Fleet Data into Cost Savings
FleetRabbit's analytics and reporting module is built specifically for transportation and logistics fleet managers — not data scientists. The platform transforms the complexity of vehicle telematics into decision-ready dashboards, custom reports, and exception alerts that connect directly to cost reduction opportunities. Key capabilities include the following.
Analytics Capability
Cost Per Mile Analytics Dashboard
Live cost per mile tracking with breakdown by cost category — fuel, maintenance, driver, insurance, and depreciation. Drill-down to vehicle, driver, and route levels to identify specific sources of cost variance. Compare current period performance against historical baselines and configurable targets. Cost per mile dashboards updated in near real-time from telematics and fuel card data feeds.
Analytics Capability
Driver Performance Scorecards
Individual driver scorecards tracking fuel efficiency, idle time percentage, safety event frequency, and on-time performance against fleet average and prior period performance. Automated scorecard delivery to drivers and supervisors. Configurable performance thresholds trigger coaching alerts when drivers fall below acceptable standards.
Analytics Capability
Predictive Maintenance Alerts
Diagnostic trouble code monitoring with predictive analytics that estimate remaining useful life for critical components — brakes, tyres, engine systems. Configurable alert thresholds trigger maintenance work orders before failures occur. Predictive maintenance module reduces unscheduled maintenance events and extends component life through earlier intervention.
Analytics Capability
Utilisation and Asset Productivity
Vehicle utilisation tracking by hour, by day, and by route segment. Identification of underutilised assets and peak capacity constraints. Data-driven recommendations for fleet resizing, asset redeployment, and temporary capacity sourcing. Utilisation reports that support capital expenditure decisions with operational data rather than assumptions.
Analytics Capability
Custom Report Builder
Drag-and-drop report builder that allows fleet managers to create custom reports without IT or data analyst support. Select metrics, date ranges, vehicle groupings, and output formats. Schedule automated report delivery to stakeholders on daily, weekly, or monthly cadences. Export reports in formats compatible with board packs, investor reporting, and shipper compliance requirements.
Analytics Capability
Exception-Based Alert Engine
Configurable alert thresholds for all key performance metrics — fuel efficiency, idle time, safety events, maintenance codes, utilisation. Alerts delivered via dashboard notification, email, or SMS based on severity and recipient preferences. Exception-based workflow enables supervisors to focus on vehicles and drivers requiring attention rather than reviewing every asset daily.
Build Your Fleet Analytics Dashboard with FleetRabbit
FleetRabbit's custom report builder and exception alert engine give fleet managers the analytics capabilities they need without the data science overhead. Book a demo to see how the platform handles your specific reporting requirements.
Turning Analytics into Action: A Practical Implementation Roadmap
Implementing fleet analytics capability requires more than software deployment. Fleet managers must establish the data infrastructure, stakeholder alignment, and operational processes that convert analytics output into cost reduction. The implementation roadmap below provides a structured approach for fleets at any stage of analytics maturity.
Months 1 to 2
Data Foundation and Baseline Establishment
Deploy telematics hardware across fleet if not already installed. Configure FleetRabbit data integration. Establish baseline performance for all key KPIs — current cost per mile, fuel efficiency by vehicle and driver, idle time percentage, unscheduled maintenance ratio. Baseline data provides the reference point against which all future cost reduction is measured.
Telematics deployed
Baseline KPIs established
Data validation complete
Months 2 to 3
Dashboard Configuration and Team Training
Configure executive, operational, and driver scorecard dashboards for the fleet's specific KPIs and reporting cadences. Set exception alert thresholds based on baseline performance data. Train supervisors on dashboard navigation, alert response protocols, and the interpretation of analytics outputs. Driver training on scorecard feedback and performance expectations.
Dashboards configured
Alert thresholds set
Team training complete
Months 3 to 6
Performance Improvement Campaigns
Launch targeted improvement campaigns focused on specific KPIs — reduce idle time, improve bottom-quartile fuel efficiency, decrease unscheduled maintenance events. Use FleetRabbit analytics to track campaign performance weekly. Conduct driver coaching sessions based on individual scorecard data. Refine exception alert thresholds based on observed performance distribution.
Improvement campaign launched
Weekly performance tracking
Driver coaching active
Months 6 to 12
Continuous Optimisation and Expansion
With core analytics capability embedded in daily operations, expand reporting to additional use cases — shipper sustainability reporting, low-emission zone compliance documentation, total cost of ownership modelling for procurement decisions. Use FleetRabbit's custom report builder to address emerging reporting requirements as they arise. Revisit baseline KPIs and set new targets based on achieved performance improvements.
Sustainability reporting active
TCO modelling integrated
Targets recalibrated
What Industry Leaders Say About Fleet Analytics ROI
We deployed telematics years ago but struggled to turn the data into actual cost savings. The data was there — we just lacked the tools to make it useful for daily operations. FleetRabbit's analytics dashboard changed that. We now track cost per mile by driver, identify inefficiency within hours instead of months, and have reduced unscheduled maintenance by over 20 percent in the first year. The ROI on the platform was realised within four months.
Director of Fleet Operations
Regional LTL Carrier, 150-vehicle fleet
Our biggest win from FleetRabbit's analytics has been driver performance visibility. Before we had individual scorecards, we knew some drivers used more fuel than others but could not quantify the gap or identify the specific behaviours causing it. Now each driver receives a monthly scorecard showing their fuel efficiency, idle time, and safety events compared to fleet average. The bottom quartile has improved measurably, and our fleet average fuel efficiency is up 9 percent year over year.
VP of Operations
Urban Delivery and Logistics Provider, 320-vehicle fleet
Frequently Asked Questions
What is fleet analytics and how does it reduce operating costs?
Fleet analytics is the systematic collection, analysis, and reporting of vehicle and driver performance data to identify inefficiencies and cost reduction opportunities. Cost reduction occurs through fuel efficiency improvement, idle time reduction, predictive maintenance that prevents expensive breakdowns, utilisation optimisation that eliminates underutilised assets, and driver coaching based on objective performance data. Fleet managers using analytics platforms typically reduce operating costs by 10 to 15 percent across fuel, maintenance, and utilisation categories.
Book a demo to see how FleetRabbit's analytics dashboard identifies cost leakage in your fleet.
Which fleet KPIs should I track to measure cost performance?
Essential cost-performance KPIs include cost per mile or kilometre (total operating cost divided by distance), fuel efficiency variance between top and bottom performing vehicles or drivers, idle time percentage (engine-on time where vehicle is stationary), unscheduled maintenance ratio (breakdowns versus planned service), vehicle utilisation rate (revenue-generating time versus available capacity), and safety event frequency (harsh braking, speeding, rapid acceleration events per thousand miles). Tracking variance between best and worst performers is more informative than tracking fleet averages alone.
How does FleetRabbit's reporting differ from standard telematics software?
Standard telematics software typically provides raw data and basic reports that require significant manual analysis to identify cost reduction opportunities. FleetRabbit's analytics module delivers decision-ready dashboards, exception-based alerts that surface only the vehicles and drivers requiring attention, custom reports built without IT support, and workflow integration that connects analytics insights to maintenance work orders, driver coaching notifications, and dispatcher route optimisation. The platform is built for fleet managers who need actionable intelligence, not data scientists who can write complex queries.
Book a demo to compare FleetRabbit reporting against your current telematics solution.
Can FleetRabbit generate reports for shipper sustainability requirements and regulatory compliance?
Yes. FleetRabbit's custom report builder generates emissions documentation, carbon intensity per shipment calculations, low-emission zone compliance records, and fleet average fuel efficiency reports required for regulatory and shipper reporting frameworks. Reports are generated automatically from telematics data rather than compiled manually from multiple sources — reducing administrative overhead while improving data accuracy and auditability. The same analytics platform that drives cost reduction also generates the sustainability documentation that shipper contracts increasingly require.
Start Turning Your Fleet Data into Cost Savings Today
FleetRabbit's analytics and reporting platform gives fleet managers the real-time visibility, exception alerts, and custom reporting capabilities required to identify cost leakage and drive measurable operating cost reduction — without a data science team or complex implementation.
Fleet Analytics Dashboard
Cost Per Mile Tracking
Driver Performance Scoring
Predictive Maintenance Alerts
Custom Reporting
Exception-Based Alerting
April 25, 2026
By Jason Smith
All Posts