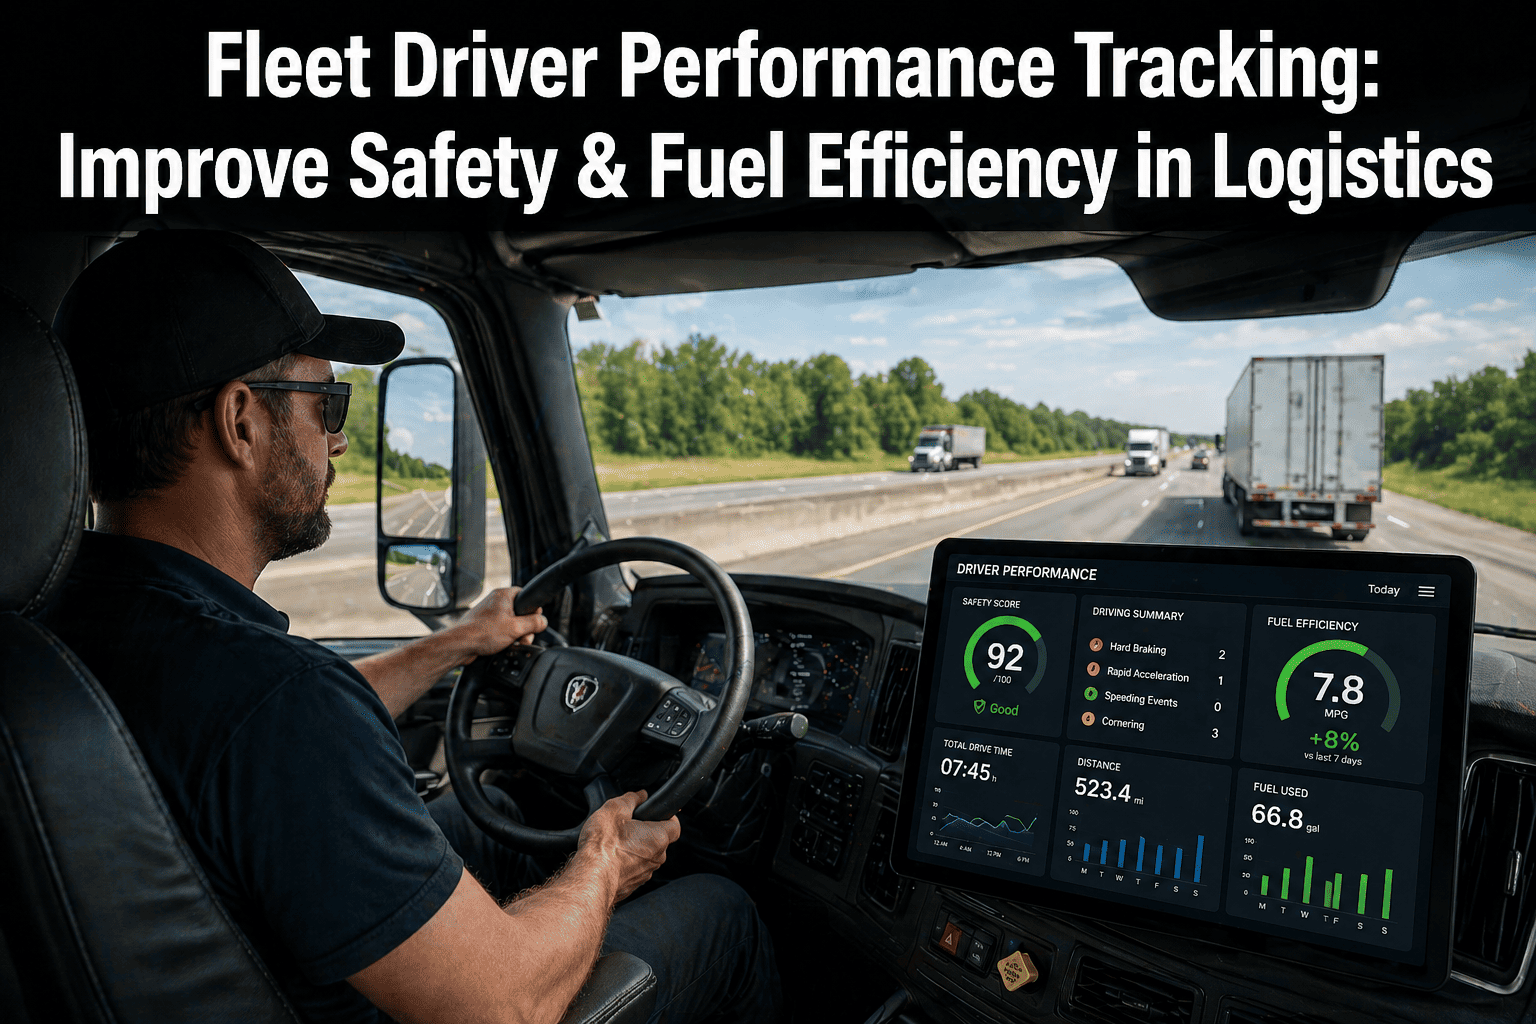
Driver behaviour directly determines fleet operating costs. Two drivers operating identical vehicles on the same routes can differ by 15 to 20 percent in fuel consumption, 30 to 40 percent in maintenance incidence, and 5 to 10 times in safety event frequency. Fleet managers who lack objective driver performance data cannot distinguish between high-performing drivers who need recognition and low-performing drivers who need coaching. Driver performance tracking transforms subjective impressions into objective metrics — enabling targeted coaching programmes that improve fuel efficiency, reduce accident risk, and lower total operating cost per mile.
Driver Performance
Safety Analytics
High Priority
10 min read
Guide Overview
This guide covers the complete framework for implementing driver performance tracking in logistics fleets — from selecting the right metrics and configuring scorecards to coaching techniques that change behaviour and reduce operating costs. FleetRabbit's driver performance module tracks fuel efficiency, idle time, safety events, and on-time performance, delivering individual scorecards that enable targeted coaching and measurable improvement.
12-18%
fuel cost reduction achievable through data-driven driver coaching programmes based on telematics analytics
30-50%
reduction in harsh braking and rapid acceleration events within six months of implementing driver scorecards
20-35%
reduction in idle time when drivers receive real-time alerts and weekly scorecard feedback
15-25%
decrease in accident frequency for fleets with documented driver monitoring and coaching programmes
Why Driver Performance Tracking Matters for Fleet Economics
Driver behaviour affects every major fleet operating expense. Fuel consumption varies significantly based on acceleration patterns, cruising speed, and idle duration. Vehicle wear — particularly brakes, tyres, and drivetrain components — correlates directly with driving aggression. Accident risk increases with speeding and harsh manoeuvres, affecting insurance premiums, vehicle downtime, and liability costs. Without objective performance data, fleet managers cannot identify which drivers need coaching, which behaviours drive cost variance, or whether improvement programmes actually work.
Performance Metric
Fuel Efficiency
Fuel consumption per unit of distance — tracked at driver level and normalised for route characteristics, load weight, and vehicle type. Fuel efficiency variance between top and bottom quartile drivers typically ranges from 15 to 25 percent, representing thousands of dollars per driver per year. Driver-specific fuel tracking enables targeted coaching on acceleration patterns, cruising speed, gear selection, and idle reduction.
Performance Metric
Idle Time Percentage
The percentage of engine-on time where the vehicle is stationary. Excessive idling wastes fuel, adds engine hours, and increases emissions without generating revenue. Idle time varies significantly by driver habit and route planning. Drivers who idle excessively for air conditioning, lunch breaks, or waiting at customer locations can reduce consumption by 20 to 40 percent with targeted coaching and real-time idle alerts.
Performance Metric
Safety Event Frequency
The frequency of harsh braking events, rapid acceleration, hard cornering, and speeding infractions per thousand miles or kilometres. Safety events correlate directly with accident risk, insurance claims, and component wear. Drivers with high safety event frequency are statistically more likely to be involved in collisions. Safety event tracking enables early intervention before accidents occur.
Performance Metric
On-Time Performance
Percentage of deliveries or service calls completed within scheduled time windows. On-time performance affects customer satisfaction, contract compliance, and revenue. Driver-level on-time tracking reveals patterns — specific drivers who consistently run late, routes where schedule expectations are unrealistic, or behaviours such as extended breaks that create cascading delays.
Building an Effective Driver Scorecard Framework
Driver scorecards transform raw telematics data into actionable performance feedback. Effective scorecards present metrics clearly, benchmark against relevant peers, and drive behaviour change through regular review.
01
Metric Selection and Weighting
Select metrics that align with fleet priorities — fuel efficiency for cost-focused fleets, safety events for high-risk operations, on-time performance for customer-service-focused fleets. Assign weights to reflect strategic importance. A balanced scorecard might weight safety events at 40 percent, fuel efficiency at 25 percent, idle time at 20 percent, and on-time performance at 15 percent. Weighting signals what matters most.
02
Performance Benchmarking
Compare each driver against relevant peers — drivers on similar routes, operating similar vehicles, covering similar distances. Raw performance comparisons across different route types penalize drivers assigned to challenging routes. Normalised benchmarks adjust for route gradient, traffic density, load weight, and vehicle type, ensuring fair comparisons that drivers accept as legitimate.
03
Trend Versus Snapshot
Present both period performance and trend direction. A driver with below-average fuel efficiency who improved 15 percent over three months deserves recognition. A driver with above-average efficiency who declined 10 percent needs coaching before reaching below-average territory. Trends provide context that single-period snapshots miss and motivate continuous improvement.
04
Visual Presentation and Accessibility
Scorecards should be visually clear, easy to understand, and accessible to drivers with varying data literacy. Use colour coding — green for exceeding targets, yellow for meeting expectations, red for below standard. Present data as simple charts rather than dense tables. Deliver scorecards through driver mobile apps, printed handouts, or email based on driver preference and technology access.
Deploy Driver Scorecards Across Your Fleet
FleetRabbit's driver performance module tracks fuel efficiency, idle time, safety events, and on-time performance — delivering individual scorecards that enable targeted coaching and measurable improvement. Book a demo to see how scorecards work for your fleet.
The Driver Behaviour Metrics That Drive Cost Reduction
Not all driver behaviour metrics deliver equal cost impact. Fleet managers should prioritize metrics with direct correlation to operating expense and clear coaching pathways for improvement.
Harsh Braking Events
Sudden deceleration events exceeding configurable g-force thresholds, typically 0.3 to 0.5g. Harsh braking indicates following too closely, distracted driving, or poor speed management. Each harsh braking event increases brake wear, reduces tyre life, and correlates with accident risk. Coaching focus: following distance, anticipation of traffic flow, speed reduction before corners and stops. Industry benchmark: fewer than three harsh braking events per 1,000 miles for well-trained drivers.
Rapid Acceleration Events
Sudden acceleration events exceeding configurable g-force thresholds. Rapid acceleration increases fuel consumption significantly — heavy throttle application consumes 30 to 50 percent more fuel than gradual acceleration to the same speed. Rapid acceleration also increases drivetrain wear and correlates with aggressive driving patterns that predict other safety events. Coaching focus: smooth acceleration from stops, anticipation of speed changes, fuel-efficient driving techniques.
Speeding and Speed Compliance
Time spent exceeding posted speed limits, typically tracked as percentage of driving time over limit and maximum speed excursions. Speeding increases fuel consumption exponentially above 55 mph, dramatically increases accident severity, and generates traffic violations that escalate insurance costs. Coaching focus: cruise control use, speed awareness, schedule management to reduce speeding pressure. Progressive alerts recommended before violations occur.
Excessive Idle Duration
Engine-on time without vehicle movement, excluding necessary idling for traffic, loading, or warm-up in extreme cold. Idle time thresholds typically configurable from three to ten minutes. Excessive idling wastes fuel — one hour of idling consumes one to two gallons of diesel depending on engine size — and adds unnecessary engine hours between service intervals. Coaching focus: automatic engine shutdown protocols, auxiliary power unit use, route planning to minimize waiting periods.
Implementation Roadmap for Driver Performance Tracking
Successful driver performance tracking requires systematic deployment across technology, process, and people. The roadmap below provides a structured approach for fleets implementing scorecards for the first time or improving existing programmes.
Phase One
Telematics Deployment and Baseline Collection
Ensure telematics hardware captures driver behaviour metrics — acceleration, braking, cornering, speed, idle time. Many basic GPS devices track location but not behaviour. Upgrade or replace hardware if behaviour metrics unavailable. Collect baseline performance data for 30 to 90 days, establishing current performance distribution and identifying top, middle, and bottom quartiles for each metric. Baseline data provides reference for improvement measurement.
Phase Two
Scorecard Design and Target Setting
Select metrics and assign weights based on fleet priorities. Set performance targets using baseline distribution — top quartile performance as stretch target, median as acceptable standard. Define improvement goals for bottom quartile drivers: reduce harsh braking by 30 percent over three months, reduce idle time by 25 percent. Configure scorecard templates with driver name, metrics, period performance, trend, and comparison to peers and targets.
Phase Three
Coaching Protocol Development
Establish coaching cadence — typically weekly scorecard review for low performers, monthly for average performers, quarterly recognition for top performers. Train supervisors on scorecard interpretation and coaching techniques focused on specific behaviours rather than general complaints. Develop corrective action thresholds: verbal coaching after two consecutive weeks below target, written plan after four weeks, progressive discipline if improvement not sustained after six weeks.
Phase Four
Recognition and Incentive Integration
Link driver performance to recognition and incentives where appropriate. Top quartile drivers qualify for monthly or quarterly bonuses, preferred route assignments, or public recognition. Most improved drivers receive coaching awards. Ensure incentive structure rewards sustained improvement, not just high baseline performance, to motivate progress across all drivers. Monitor for unintended consequences — drivers who sacrifice safety for fuel efficiency or vice versa.
Effective Driver Coaching Techniques Using Performance Data
Data without coaching changes nothing. Fleet managers and supervisors must translate scorecard metrics into specific, actionable coaching conversations that change driver behaviour.
Coaching Technique
Specific Behaviour Identification
Replace general coaching statements with data-specific feedback. Instead of "you need to drive more smoothly," show the driver their harsh braking events map with timestamps and locations. Instead of "you idle too much," show idle duration by day and location. Specific data makes the problem concrete and solvable while preventing defensive responses to vague criticism.
Coaching Technique
Root Cause Discovery
Ask questions that identify why behaviour occurs rather than assuming cause. Excessive harsh braking may result from following too closely, but may also result from unrealistic schedule pressure, unfamiliar routes, or vehicle mechanical issues. Rapid acceleration may indicate aggressive driving or may indicate driver compensating for underpowered vehicles. Discover root causes before prescribing solutions.
Goal Setting With Driver Input
Set improvement goals collaboratively rather than imposing targets. Ask drivers what specific behaviour they will change next week and by how much. Document the goal and review progress at the next coaching session. Drivers who participate in goal setting show higher commitment and better improvement than drivers receiving imposed targets. Goals should be specific, measurable, achievable, relevant, and time-bound.
Positive Feedback and Recognition
Balance corrective coaching with positive recognition for improvement. Drivers who reduced harsh braking by 20 percent deserve acknowledgment even if still below fleet average. Drivers who maintained top-quartile performance deserve recognition that reinforces continued effort. Positive reinforcement is more effective than punishment for sustaining long-term behaviour change.
Driver Performance Tracking ROI Calculation
Quantifying the return on driver performance tracking investment helps justify technology spend and demonstrate programme value to senior management.
ROI Component
Annual Impact Per Vehicle
Typical Improvement Range
Fuel Cost Reduction
$1,200–$2,500
8-15% fuel efficiency improvement for bottom quartile drivers
Maintenance Cost Reduction
$400–$1,200
Extended brake and tyre life from reduced harsh events
Insurance Premium Impact
$300–$800
Reduced claims frequency and severity
Accident Cost Avoidance
$500–$2,000
Fewer collisions from improved driver behaviour
Annual Savings Total
$2,400–$6,500
Combined impact across all categories
Overcoming Common Driver Performance Tracking Objections
Driver resistance is the most common barrier to successful performance tracking implementation. Addressing objections thoughtfully improves adoption and programme effectiveness.
Privacy Concern: Tracking my driving feels like surveillance. Why should I trust how this data will be used?
Common Objection
Address privacy concerns through transparent policies. Tracking monitors vehicle operation, not personal activities. Data is used only for coaching and improvement, never for punishment without prior warning. Establish clear data access rules — supervisors can view aggregated scores but not continuous real-time location unless responding to safety events. Drivers who see performance data as protection against false complaints and evidence of good driving typically become programme advocates.
Fairness Concern: My routes are harder than other drivers. Comparing raw scores is unfair.
Common Objection
Implement route-normalised comparisons that adjust for route characteristics — urban versus highway, loaded versus empty, hilly versus flat terrain. Normalised scores compare drivers against expected performance for their specific route type, not raw averages across all routes. Communicate the normalisation methodology clearly and update models as new data becomes available. Fair comparisons are essential for driver acceptance of scorecards.
Trust Concern: Management will use this data to fire drivers rather than help them improve.
Common Objection
Earn trust through demonstrated use of data for coaching rather than punishment. Establish clear progressive protocols — data triggers coaching, not termination. Share success stories of drivers who improved through coaching. Allow drivers to view their own scorecards before supervisors see them during pilot phases. Trust takes time to build but can be destroyed quickly by punitive use of performance data without prior coaching opportunity.
Integrating Driver Performance Tracking with Broader Fleet Management
Driver performance data delivers maximum value when integrated with other fleet management functions. Understanding integration opportunities improves ROI and operational efficiency.
Integration Point
Maintenance systems receive driver behaviour data to predict component wear. Vehicles assigned to drivers with high harsh braking frequency may require more frequent brake inspections. Vehicles assigned to drivers with high rapid acceleration may need earlier transmission service. Integration enables condition-based maintenance tailored to actual usage patterns.
Integration Point
Route planning systems consider driver capability when assigning routes. High-performing drivers may receive challenging routes with tight windows. Drivers in coaching receive routes with buffer time. Integration reduces schedule pressure that drives unsafe behaviour while matching driver capability to route difficulty.
Integration Point
Fuel management systems correlate fuel purchases with driver efficiency metrics. Inconsistent fuel economy despite consistent driver scores may indicate fuel theft, fuel quality issues, or mechanical problems. Integration provides early warning of fuel-related anomalies requiring investigation.
Integration Point
Safety and compliance systems use driver performance data to target training resources. Drivers with high safety event frequency receive additional training before incidents occur rather than after. Integration shifts safety programmes from reactive to proactive, reducing accident rates and associated costs.
Transform Driver Behaviour With Data-Driven Scorecards
FleetRabbit's driver performance module tracks fuel efficiency, idle time, safety events, and on-time performance — delivering individual scorecards that enable targeted coaching and measurable improvement. Book a demo to see driver scorecards for your fleet.
Frequently Asked Questions About Driver Performance Tracking
What driver behaviour metrics should I track first?
Start with metrics that have direct cost impact and clear coaching pathways: fuel efficiency (distance per gallon or litre), idle time percentage, harsh braking frequency, and speeding events. These metrics affect fuel cost, maintenance expense, and accident risk. Add rapid acceleration, cornering, and seatbelt usage once basic metrics are established. Avoid tracking too many metrics initially — drivers and supervisors can become overwhelmed, reducing focus on the most impactful behaviours.
How do I ensure drivers accept performance tracking?
Driver acceptance requires transparent policies, fair comparisons, and demonstrated use for coaching rather than punishment. Communicate why tracking matters — reducing fuel cost keeps the company competitive and preserves jobs, not surveillance. Share scorecards with drivers before supervisors see them during pilot phases. Use data for positive recognition as often as corrective coaching. Drivers who receive specific, actionable feedback and see improvement typically become advocates for data-driven coaching.
How frequently should driver scorecards be reviewed?
Review cadence depends on driver performance tier and fleet culture. Bottom quartile drivers benefit from weekly scorecard reviews with specific improvement goals. Middle quartile drivers typically require monthly reviews to maintain awareness and prevent backsliding. Top quartile drivers need quarterly recognition to reinforce continued effort. Daily scorecard reviews for all drivers create feedback fatigue and reduce impact. Focus coaching intensity where improvement opportunity is greatest.
Can driver performance tracking reduce insurance premiums?
Yes. Commercial auto insurers increasingly offer premium discounts for fleets with documented driver monitoring and coaching programmes. Discounts typically range from 5 to 15 percent depending on programme maturity and documented results. To qualify, fleets must demonstrate active use of data for coaching, not just collection. Make telematics data available to underwriters during renewal negotiations. Some insurers offer telematics-based policies with premiums tied directly to measured driver behaviour.
How does FleetRabbit's driver performance tracking compare to basic telematics reporting?
Basic telematics typically provides raw event data without driver attribution, normalisation, or coaching workflow integration. FleetRabbit's driver performance module delivers driver-attributed metrics with route-normalised comparisons, configurable scorecards, automated report delivery, and coaching protocol tracking. The platform also tracks improvement trends over time and generates exception alerts when drivers fall below thresholds. For fleets serious about changing driver behaviour, the difference between raw data and decision-ready scorecards is substantial.
Book a demo to see the difference for your fleet.
Start Tracking Driver Performance Today
FleetRabbit's driver performance module delivers individual scorecards, exception alerts, and improvement tracking that reduce fuel costs, extend component life, and lower accident risk. Start your free trial or book a demo to see driver scorecards for your fleet.
Fleet Driver Performance Tracking
Driver Behaviour Monitoring
Fleet Driver Scorecard
Driver Safety Tracking
Fleet Analytics
Fuel Efficiency Coaching
April 29, 2026
By Jason Smith
All Posts