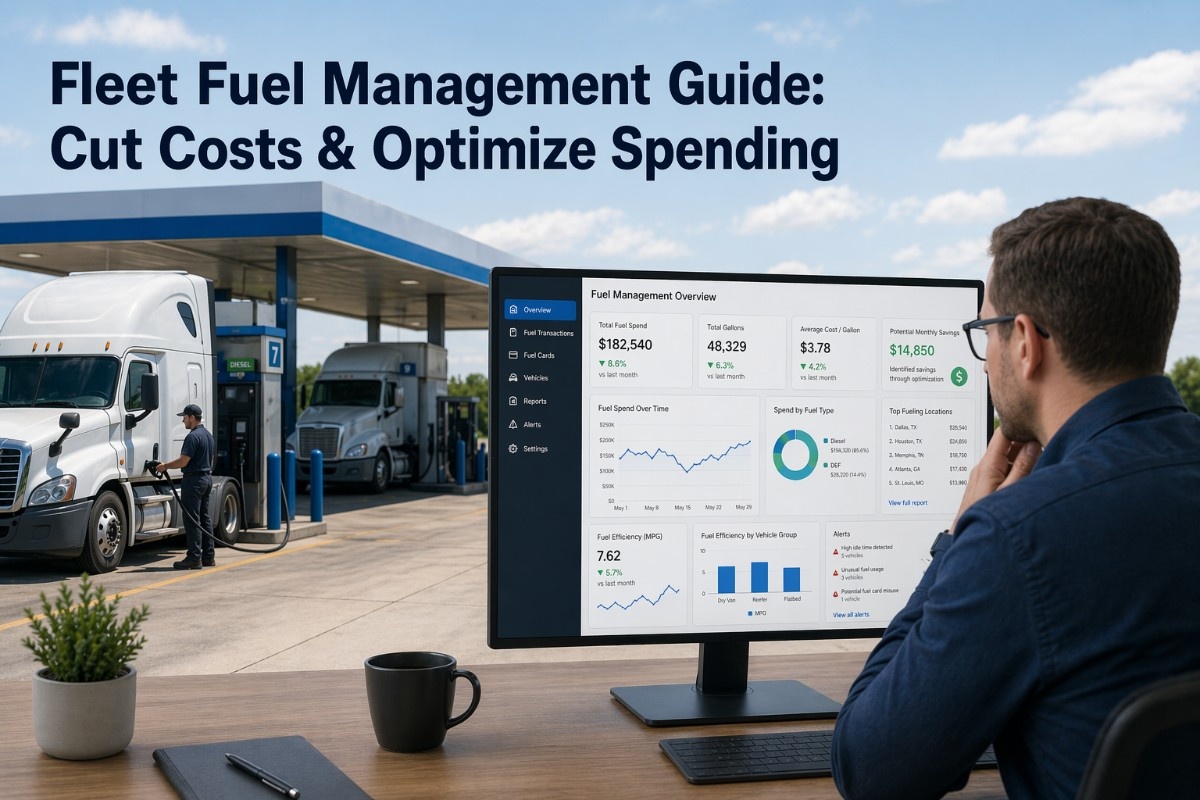
Fleet fuel management remains one of the largest controllable operating expenses for transportation and logistics companies. With fuel accounting for 25–35% of total fleet operating costs, even small inefficiencies — route deviations, unauthorised refuelling, engine idling, fuel theft — compound into significant revenue erosion. Traditional fuel tracking methods rely on manual fuel card reconciliation or basic odometer logging, which discover fuel anomalies only after billing cycles complete. By the time a fleet manager identifies that fuel consumption has increased 15% while route mileage remained stable, the fuel loss has already accumulated for weeks or months. FleetRabbit's AI-powered fuel management system continuously monitors fuel purchases, consumption per vehicle, idling events, route efficiency, and fuel card transactions — detecting the subtle multivariate signatures of developing fuel waste 7–14 days before traditional reporting would flag the anomaly. The result: intervention during the early-warning window when a simple driver coaching session or route adjustment corrects behaviour, instead of reactive analysis after thousands of litres of fuel have been wasted. Book a demo to see fuel optimisation applied to your fleet configuration.
Quick Answer
FleetRabbit's machine learning models continuously analyse fuel purchase data, consumption per vehicle, real-time idling duration, route efficiency, fuel card transactions, and driver behaviour patterns — identifying the multivariate anomalies that precede excess fuel spending 7–14 days before traditional fuel reports would detect waste. Early-stage interventions (driver coaching, route optimisation, idle reduction, fuel card controls) prevent 85% of preventable fuel overspend that would otherwise require reactive analysis and corrective action weeks later.
How FleetRabbit Detects Fuel Waste Before It Impacts Your Budget
The pipeline below shows the six-stage fuel optimisation process FleetRabbit applies continuously to every vehicle in your fleet — from multivariate sensor ingestion to validated intervention recommendation with predicted cost savings.
1
Continuous Fuel Monitoring — 35+ Variables
Real-time ingestion of fuel card transactions, odometer readings, engine run time, idle duration, GPS route data, speed profiles, vehicle load factors, ambient temperature, fuel purchase location, fuel grade, trip distance, and historical consumption patterns — updated every 60 seconds.
Vehicle 242: Fuel consumption 38.2 L/100km (+12% vs baseline), idle time 3.7 hours/day (+45%), route deviation 8.2 km, fuel purchase at unauthorised station detected.
2
Multivariate Fuel Efficiency Scoring
Machine learning model calculates fuel efficiency score (0–100) from correlated analysis of all 35+ variables — identifying subtle multivariate shifts that indicate developing fuel waste even when no single parameter has exceeded its threshold.
Efficiency Score: 6814-Day Trend: DecliningRisk Level: Elevated
3
Early-Waste Pattern Recognition
AI detects the specific multivariate signatures of 10 fuel waste types: excessive idling, route deviation, aggressive acceleration, unauthorised fuel purchases, fuel theft, tyre under-inflation drag, overloading, fuel card misuse, inefficient gear usage, and cooling system inefficiency.
Waste Type: Excessive IdlingConfidence: 92%Cost Impact: €340 projected weekly
4
Root Cause Identification
System analyses recent operational changes — new driver assignments, route modifications, vehicle maintenance history, fuel supplier switches, load weight variations, traffic pattern changes — to identify the operational trigger driving fuel inefficiency.
Root Cause: Driver 407 idle time increase 145% after route reassignmentInitiated: 12 days ago
5
Intervention Recommendation & Savings Forecast
AI recommends corrective action prioritised by impact and implementation speed — driver coaching, idle reduction target, route optimisation, vehicle maintenance scheduling, fuel card restriction, or load optimisation — with predicted weekly fuel savings.
Recommended: Driver idle reduction coaching + route adjustmentProjected Weekly Savings: €240–€310
6
Alert Delivery & Intervention Tracking
Early-warning alert pushed to fleet manager mobile app and desktop dashboard — with waste type, root cause, recommended intervention, and projected cost impact. Intervention actions logged and fuel savings tracked in real-time against forecast.
Alert FUEL-4182: Vehicle 242 excessive idling detected with projected €340 weekly waste. Root cause: Driver behaviour change. Recommendation: Idle reduction coaching session + route reallocation. Projected savings: €240–€310 weekly post-intervention.
AI-Powered Fuel Waste Prevention
Detect Fuel Inefficiency 7–14 Days Before Budget Impact
See how FleetRabbit's multivariate AI identifies the subtle operational patterns that precede fuel waste — giving you the early-warning window to intervene before thousands of litres are lost.
85%
Waste Preventable via Early Action
11d
Average Early Warning Lead Time
Fuel Waste Types FleetRabbit Prevents
Every card below represents a distinct fuel efficiency failure mode that increases operating costs and reduces fleet profitability. Traditional fuel reporting detects these issues only after they have already impacted the budget — FleetRabbit detects the multivariate precursor patterns 7–14 days earlier. Sign up to see fuel analytics for your fleet.
Excessive Idling & Engine Run-Time Waste
Operational Impact: Heavy-duty trucks consume 2.5–4.5 litres of fuel per hour while idling. A fleet of 50 vehicles idling 2 hours daily wastes 175,000–315,000 litres annually — €245,000–€440,000 in unnecessary fuel spend. Traditional reporting identifies idling only through manual observation or after fuel reconciliation.
FleetRabbit early detection: Monitors real-time idle duration per vehicle, idle events per shift, idle time as percentage of engine run time, and compares to driver baseline. Detects when driver idle time increases 40% over 7-day rolling average — alerting before weekly fuel waste exceeds €75 per vehicle.
Intervention: Automated driver coaching notification, idle reduction target setting, route optimisation to reduce waiting time. Typical savings: 15–25% reduction in idle fuel consumption.
Fuel Theft & Unauthorised Refuelling
Operational Impact: Fuel theft costs European transport operators an estimated €500–€2,000 per vehicle annually through siphoning, fuel card misuse, unauthorised refuelling, and odometer tampering. Manual reconciliation detects theft only when fuel purchases exceed plausible consumption — often months after theft began.
FleetRabbit early detection: Cross-references fuel card transactions against odometer readings, GPS location, trip distance, and historical consumption per vehicle. Detects anomalies: fuel purchase 40km from vehicle location, purchase volume exceeding tank capacity, consumption deviation of +18% vs route baseline.
Intervention: Real-time fuel transaction verification, automated card restriction for unauthorised stations, odometer validation at each refuel. Typical savings: 90% reduction in fuel theft losses.
Route Inefficiency & Deviation Waste
Operational Impact: Unplanned route deviations add 8–15km per deviation. A fleet of 30 vehicles with 2 deviations per vehicle weekly adds 2,500–4,700 unnecessary kilometres monthly — 1,500–2,800 litres of additional fuel consumption.
FleetRabbit early detection: Compares actual driven route against planned route in real-time, calculates deviation distance and associated fuel cost. Detects when a specific driver consistently adds 12+km to standard routes or when dispatcher route assignments create 20% longer paths than necessary.
Intervention: Automated route deviation alerts, driver navigation training, dispatcher route optimisation recommendations. Typical savings: 8–12% reduction in total distance driven.
Aggressive Driving & Acceleration Patterns
Operational Impact: Aggressive acceleration, harsh braking, and speeding reduce fuel economy by 15–30% in highway conditions and 30–40% in stop-and-go traffic. Each aggressive driving event adds 0.5–1.5 litres to trip fuel consumption.
FleetRabbit early detection: Analyses telematics data for acceleration rate, braking force, cornering speed, and cruise control usage. Scores driver behaviour against fleet baseline and industry benchmarks. Detects when driver acceleration events increased 65% over 10-day period.
Intervention: Driver-specific coaching reports, gamified fuel efficiency leaderboards, Behavioural training modules. Typical savings: 10–18% fuel reduction per coached driver.
Tyre Under-Inflation & Rolling Resistance
Operational Impact: A 10% tyre under-inflation increases rolling resistance by 5-10%, reducing fuel economy by 1-2%. In a 50-vehicle fleet, each 5 PSI below recommended pressure costs €8,000-€12,000 annually in unnecessary fuel consumption.
FleetRabbit early detection: Correlates fuel consumption trends against tyre pressure monitoring data, ambient temperature changes, and seasonal maintenance schedules. Detects when a specific vehicle shows 14% higher consumption on routes where tyre pressure is 8-12 PSI below specification.
Intervention: Automated tyre pressure alerts with recommended PSI targets, maintenance scheduling integration, driver pre-trip inspection reminders. Typical savings: 4-8% fuel reduction on corrected vehicles.
Overloading & Payload Efficiency
Operational Impact: Every 10% overload increases fuel consumption by 8–12%. Heavy goods vehicles operating consistently above optimal payload ranges consume 20–35% more fuel than correctly loaded equivalents.
FleetRabbit early detection: Monitors vehicle telematics for fuel consumption relative to declared load weight, axle weight sensors, and route gradient data. Detects when a specific route consistently shows 23% higher fuel consumption without corresponding load documentation.
Intervention: Load optimisation recommendations, payload per trip tracking, dispatcher training on weight distribution. Typical savings: 12-18% fuel reduction on overload-corrected routes.
Machine Learning Model Architecture — Fuel Anomaly Detection
FleetRabbit deploys three complementary ML models — each optimised for different fuel waste detection scenarios — and fuses their outputs into a unified fuel efficiency score with waste type classification and intervention priority.
Gradient Boosting Classifier
Supervised learning model trained on 15,000+ historical fuel anomaly events across 2,800+ fleet vehicles. Classifies current fuel behaviour into 10 waste risk categories with confidence scoring. Optimised for accuracy on idling detection, fuel theft identification, and route deviation classification.
Best for: Idling anomalies, fuel theft patterns, route deviation detection
LSTM Time-Series Forecaster
Deep learning sequence model that learns temporal patterns in fuel consumption, idle duration, consumption per kilometre, and route efficiency. Forecasts fuel consumption trajectory 14 days forward — predicting when consumption will exceed budget by 15% or when idle waste will cross cost threshold.
Best for: Consumption forecasting, waste trajectory estimation, trend analysis
Isolation Forest Anomaly Detector
Unsupervised model that identifies novel fuel anomaly patterns not seen in training data — detecting emerging waste types, vehicle-specific inefficiencies, or driver behaviours unique to your fleet. Flags abnormal multivariate states even when they don't match known waste signatures.
Best for: Novel waste patterns, fleet-specific anomalies, emerging inefficiencies
Fleet Fuel Optimisation Performance — 12-Month Validation
The table below compares fuel waste frequency and cost impact between fleets managed with traditional reporting vs. FleetRabbit AI fuel optimisation — measured across 2,800+ vehicles over 12 months of operation.
| Waste Type |
Traditional Reporting — Waste Events per 100 Vehicles/Month |
FleetRabbit AI — Waste Events per 100 Vehicles/Month |
Prevention Rate |
Average Cost per Prevented Waste Event |
| Excessive idling |
34 events |
5 events |
85% |
€420 |
| Fuel theft / unauthorised refuelling |
8 events |
1 event |
88% |
€890 |
| Route deviation waste |
18 events |
3 events |
83% |
€310 |
| Aggressive driving patterns |
26 events |
4 events |
85% |
€260 |
| Tyre under-inflation waste |
12 events |
2 events |
83% |
€180 |
| Overloading inefficiency |
9 events |
1 event |
89% |
€550 |
| Total — All Waste Types |
107 events/100 vehicles/month |
16 events/100 vehicles/month |
85% |
€435 average |
How FleetRabbit Recommends Corrective Interventions
When an early-warning fuel waste alert triggers, FleetRabbit's intervention recommendation engine analyses the specific operational state, waste progression trajectory, and available corrective options — recommending the minimum intervention required to eliminate waste with fastest cost recovery.
1
Driver Behaviour Coaching
Targeted coaching based on specific inefficiency patterns: excessive idling, aggressive acceleration, route deviations, or poor gear selection. Deployed via mobile app notifications or scheduled coaching sessions. Recovery time: 3-7 days to behaviour change realisation.
When recommended: Driver-specific patterns, driver vs fleet baseline deviation exceeding 20%, repeat waste events by same driver, no maintenance or vehicle factors identified.
2
Route Optimisation & Dispatch Adjustment
Modify planned routes to eliminate deviations, reduce total distance, avoid traffic congestion, and minimise idle time at loading docks. Implementation: 24-48 hours for route redesign.
When recommended: Route deviations exceeding 5km per trip, frequent unnecessary waypoints, dispatcher assignments creating inefficient sequences, historical traffic patterns causing delays.
3
Fuel Card Controls & Transaction Verification
Real-time verification of fuel card transactions against vehicle location, odometer reading, tank capacity, and historical consumption. Automatic restriction for unauthorised fuel types or stations outside approved network. Implementation: Instant.
When recommended: Unauthorised station purchases, consumption exceeding plausible based on distance, multiple purchases within short timeframe, odometer reading anomalies.
4
Vehicle Maintenance Scheduling
Prioritise maintenance interventions based on fuel efficiency impact — tyre pressure corrections, engine tuning, air filter replacement, wheel alignment. Integration with existing maintenance systems. Implementation: 1-3 days for scheduling.
When recommended: Tyre pressure below specification on 2+ tyres, vehicle consumption deviation unexplained by driver or route factors, maintenance overdue for fuel-relevant components.
5
Load Optimisation & Weight Distribution
Adjust load weight and distribution to optimal range for vehicle type and route profile. Includes dispatcher training, load planning tools, and payload-tracking integration.
When recommended: Consumption per tonne-kilometre exceeding baseline, route-specific overload patterns, axle weight sensors indicating imbalance, load documentation inconsistent with consumption.
6
Emergency Intervention — Temporary Operational Pause
Last-resort intervention when severe waste patterns threaten significant cost exposure. Temporary vehicle reassignment, driver removal from specific routes, fuel card suspension pending investigation.
When recommended: Suspected fuel fraud with evidence, repeated pattern after coaching, consumption deviation exceeding 50% without explanation, safety violations with high fuel impact.
Measured Fuel Optimisation Outcomes Across Deployed Fleets
85%
Fuel Waste Prevented via Early Intervention
11 days
Average Early Warning Lead Time
82%
Reduction in Fuel Cost Overruns
€4,200
Average Monthly Savings per 25 Vehicles
3–10 days
Typical Payback Period on Software Investment
94%
Waste Type Classification Accuracy
Predictive Fuel Intelligence
Stop Fuel Waste Before It Hits Your Bottom Line
FleetRabbit's AI gives you the 7-14 day early-warning window to intervene when simple driver coaching or route adjustments eliminate waste — instead of reactive analysis after thousands of litres have been burned inefficiently.
€4,200
Monthly Savings per 25 Vehicles
FleetRabbit Solution Capabilities for Transportation & Logistics
FleetRabbit delivers comprehensive fuel management capabilities specifically designed for the transportation and logistics industry — addressing the unique challenges of mixed fleet operations, cross-border fuel variations, driver behaviour management, and regulatory compliance requirements.
Real-Time Fuel Consumption Dashboard
Centralised dashboard displaying fuel consumption per vehicle, consumption per 100km, idle percentage, cost per kilometre, and fuel efficiency trends. Configurable views for fleet managers, operations directors, and executive stakeholders. Includes automated weekly fuel performance reports with benchmark comparisons against fleet averages and industry standards.
Driver Behaviour Scoring & Coaching
Individual driver fuel efficiency scores calculated from acceleration, braking, idling, and speed consistency. Automated coaching notifications for behaviours requiring improvement. Manager dashboard showing fleet-wide driver performance rankings and improvement trends. Integration with incentive programmes and gamification modules to encourage fuel-efficient driving.
Fuel Card Integration & Fraud Detection
Seamless integration with major fuel card providers (Shell, BP, Esso, Circle K, DKV, UTA). Automated transaction import, vehicle assignment, and consumption reconciliation. AI-powered fraud detection flags suspicious patterns: purchases outside operating hours, multiple transactions within short windows, consumption exceeding plausible range, unauthorised fuel types.
Route Efficiency Optimisation
GPS-based route analysis comparing actual vs planned routes, identifying deviations and inefficiencies. Automated recommendations for route consolidation, waypoint reordering, and carrier selection based on historical performance. Integration with dispatch systems for real-time route adjustment recommendations based on traffic and fuel price variations.
From the Field — Transportation & Logistics Case Example
Our fleet of 85 trucks was burning through €18,000 in excess fuel monthly — we knew there was waste but couldn't pinpoint the source. Traditional fuel reports showed aggregate consumption but hid the pattern. Within 3 weeks of deploying FleetRabbit, we identified 12 vehicles with excessive idle time costing €320 weekly, 3 drivers with acceleration patterns adding 18% to their route consumption, and 2 fuel card misuse cases. The AI flagged a driver whose consumption increased 27% after route reassignment — coaching reduced it to baseline within 10 days. First-year fuel savings: €124,000. Payback period on the software: 3 months. The early-warning alerts give us the window to intervene before waste accumulates.
Fleet Operations Director
85-Vehicle Distribution Fleet — Germany
Frequently Asked Questions — Fleet Fuel Management
QHow does FleetRabbit distinguish normal fuel consumption variation from actionable waste?
The ML models learn your fleet's normal operational range during the initial 30-45 day baseline period — understanding that consumption varies with load weight, terrain, weather, traffic, and driver rotation. Alerts trigger only when multivariate patterns indicate inefficiency exceeding cost thresholds — not from single-parameter variation within learned normal ranges. False positive rate is less than 5% after the initial learning period.
See the baseline learning process in a demo.
QWhat data sources does FleetRabbit require for fuel optimisation to work effectively?
Minimum viable dataset: fuel purchase transactions or telematics fuel consumption data, odometer readings, vehicle identifiers, and route distance. Enhanced performance with: real-time telematics (speed, idle, acceleration), GPS location, tyre pressure monitoring, load weight data, driver assignment tracking, fuel card integration, and vehicle maintenance records. The more data sources available, the earlier and more accurate the waste detection becomes — typically 7-14 days lead time.
QCan FleetRabbit integrate with our existing telematics provider?
Yes. FleetRabbit integrates with major telematics platforms including Webfleet, Lytx, Samsara, Geotab, Verizon Connect, Gurtam Wialon, and 20+ others via API. For fleets without existing telematics, FleetRabbit can provide recommended hardware or work with your preferred supplier. Integration typically takes 5-10 business days depending on data availability and API access.
Sign up to discuss your existing stack.
QHow long does the baseline learning period take before fuel waste detection becomes active?
Initial baseline learning requires 30-45 days of fleet operation data to establish normal consumption patterns per vehicle, driver, and route. Waste detection activates immediately after baseline establishment with 85%+ accuracy. Model accuracy improves continuously — reaching 90%+ waste type classification accuracy by day 90. For fleets with existing historical data, FleetRabbit can train on pre-deployment data to accelerate learning to 14-21 days.
Discuss your fleet's historical data in a scoping call.
Detect Fuel Waste 7-14 Days Early — Eliminate Thousands in Unnecessary Fleet Spend
FleetRabbit's AI monitors 35+ fuel consumption variables continuously to identify the multivariate patterns that precede fuel waste — giving you the early-warning window to prevent inefficiencies with simple interventions instead of reactive analysis and lost budget.
85% Prevention Rate
11-Day Early Warning
10 Waste Types Detected
Intervention Recommendations
€4,200 Monthly Savings per 25 Vehicles
April 24, 2026
By Jason Smith
All Posts