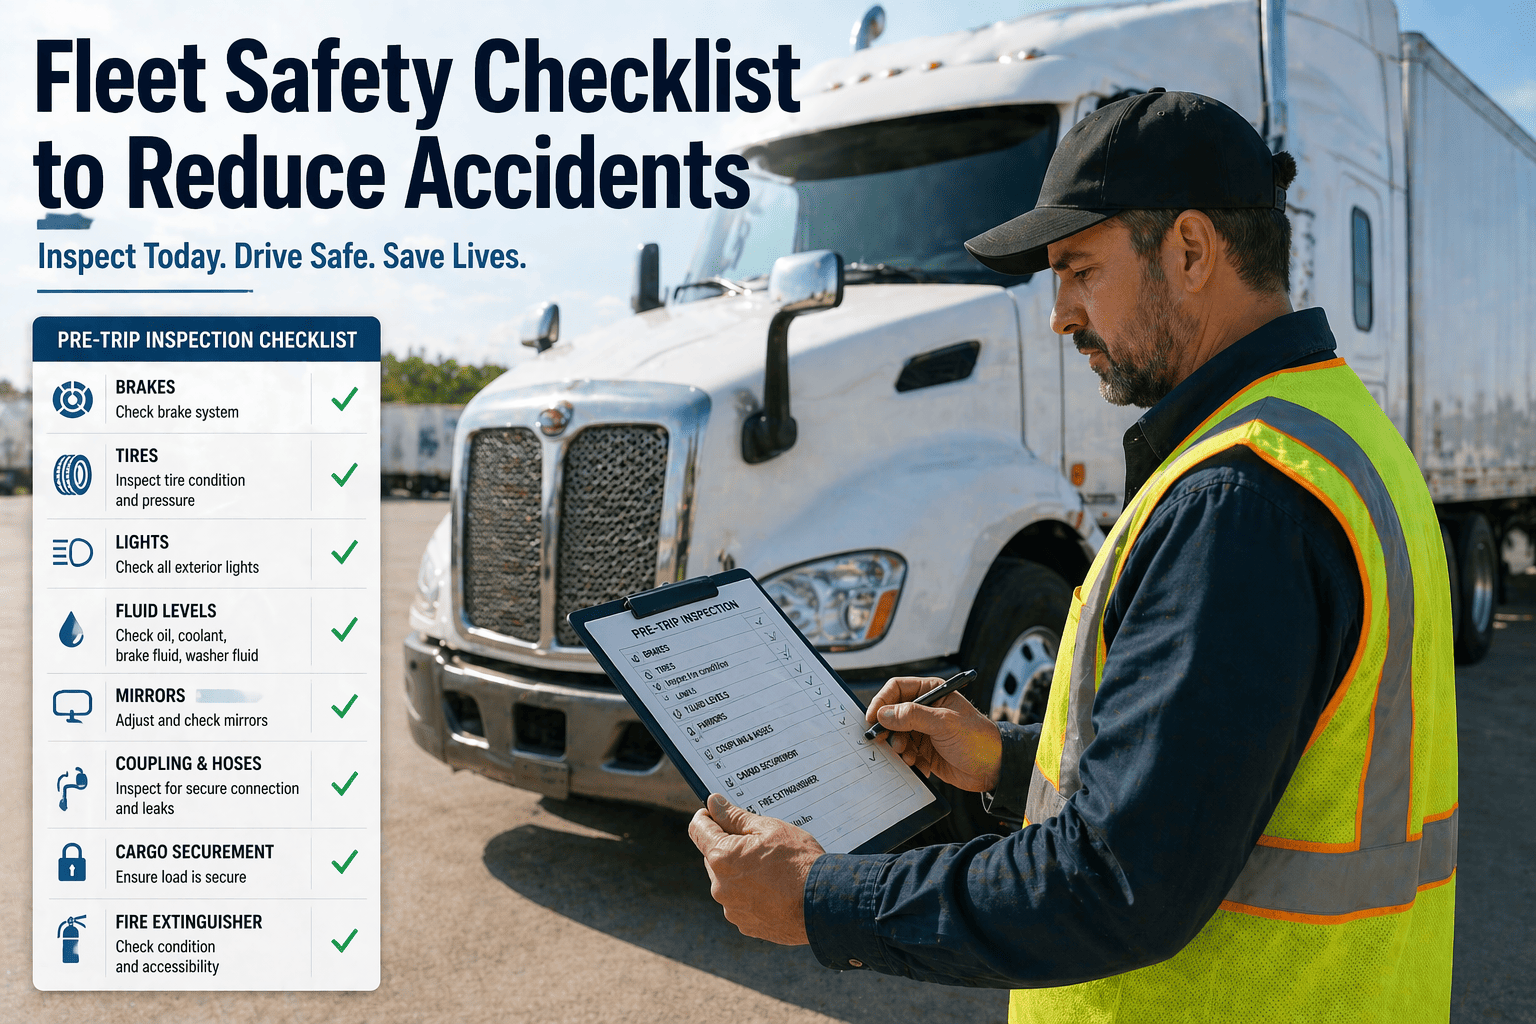
Fleet safety is not a static policy document filed away after annual training meetings. It is a continuous operational discipline that requires systematic attention to driver behavior, vehicle condition, route planning, and regulatory compliance. Accidents cost fleets more than repair bills and insurance premium increases. A single serious crash involving a commercial motor vehicle can result in six-figure liability settlements, catastrophic injury claims, CSA score elevations that trigger compliance reviews, and in the worst cases, criminal charges against drivers and safety directors. This fleet safety checklist provides safety managers, fleet owners, and driver trainers with a complete framework for reducing accident frequency, protecting drivers from preventable injuries, and building a fleet culture where safety drives every operational decision. FleetRabbit integrates this entire safety framework into a digital platform that connects driver training records, vehicle inspection results, accident investigation documentation, and corrective action tracking in a single system that produces auditable safety program evidence on demand.
Fleet Safety Checklist
Complete Framework for Accident Prevention and Driver Protection
Why Proactive Fleet Safety Protects Drivers and Your Operating Authority
Fleets with documented safety programs experience up to 40 percent fewer preventable accidents compared to fleets operating without formal safety management systems. Beyond accident reduction, a complete safety program lowers insurance premiums, improves driver retention, reduces CSA scores, and strengthens legal defense when accidents do occur. This checklist builds a safety framework across driver qualification, vehicle inspection, crash prevention, post-accident response, and continuous improvement.
Fleet Safety by Category: 7-Point Protection Framework
Systematically evaluate each area of fleet safety responsibility from driver hiring through accident investigation and corrective action. The framework below organizes safety requirements by operational function.
Critical Fleet Safety Requirements for Accident Prevention
FMCSA regulations establish minimum safety standards, but accident prevention requires exceeding those minimums in specific high-risk areas. The requirements below represent fleet safety best practices proven to reduce crash rates.
Handheld device use while driving increases crash risk by seven times. The fleet policy must prohibit all handheld device use, require hands-free systems for any phone communication, and include consequences for violations discovered through camera review or telematics data. Policy enforcement requires regular auditing of camera footage and telematics for cell phone use indicators.
At highway speeds, a fully loaded tractor trailer requires over 300 feet to stop under ideal conditions. Fleet policy should require minimum following distance of at least four seconds in good conditions, increasing to eight seconds in rain or snow. Speed management includes governed speed settings, route-specific speed reductions in construction zones and urban areas, and progressive discipline for repeated speeding events.
Backing accidents account for a significant percentage of fleet property damage and pedestrian strikes despite occurring at low speeds. The fleet policy should require drivers to walk around the vehicle before any backing maneuver, use a spotter whenever visibility is obstructed, and avoid backing whenever an alternative pull-through maneuver exists. Backing accidents warrant review regardless of damage severity because patterns predict serious future events.
Driver authority to delay or cancel trips due to hazardous weather conditions must be explicit in fleet policy with no retaliation for weather-related delays. The safety program should include wet weather braking procedures, winter driving chains and tire requirements, and a wind speed threshold for empty or light load operations. Dispatchers must receive training on weather threat assessment and driver support during adverse conditions.
Lane change and merge crashes often result from blind spot misjudgment or failure to signal adequately before movement. The fleet safety procedure must require signal activation at least five seconds before any lane change, mirror and head check of the adjacent lane, and speed matching when merging onto highways. Camera systems with side object detection reduce lane change crash risk but do not replace driver attention to blind spots.
Unsecured cargo shifts during transit can cause rollover accidents, especially during cornering or evasive maneuvers. The safety program must include cargo securement training for each cargo type, pre-trip verification of securement devices, and in-transit checks at each stop. Drivers must understand that cargo securement is their responsibility regardless of who loaded the vehicle.
Leading vs. Lagging Safety Indicators for Fleet Performance
Traditional safety management focuses on lagging indicators such as accident frequency and severity. Leading indicators predict future accident risk and enable proactive intervention before crashes occur. The table below compares both measurement approaches for fleet safety programs.
| Safety Metric Type | Examples | What It Measures | Intervention Timeline |
|---|---|---|---|
| Leading Indicators | Hard braking events per 1000 miles, following distance violations, distracted driving alerts, near-miss reports, training completion rates, safety meeting attendance, hazard reports submitted | Driver behaviors and operational conditions that predict future crash risk before accidents occur | Weekly monitoring with driver coaching within 48 hours of behavioral event |
| Lagging Indicators | Preventable accident frequency per million miles, accident severity measured by repair cost, injury rates, fatality rates, DOT reportable crash count | Historical accident outcomes that measure past performance but do not predict individual future events | Quarterly and annual reporting with year over year trend analysis |
Scroll horizontally on mobile to view all columns
Build Your Fleet Safety Program with FleetRabbit
FleetRabbit integrates driver safety training records, vehicle inspection results, accident investigation documentation, and leading indicator tracking into a single safety management platform. The system generates automated safety alerts when leading indicator thresholds are exceeded, tracks corrective actions from root cause analysis through resolution, and produces safety committee reports with trend analysis and improvement tracking.
Preventable vs. Non-Preventable Accident Determination
Accident preventability determination affects CSA scoring, insurance premiums, driver employment status, and corrective action requirements. The comparison below shows how fleets should evaluate accident preventability based on FMCSA guidance and industry standards.
| Accident Type | Preventable Indicators | Non-Preventable Indicators |
|---|---|---|
| Rear End Collision | Driver following closer than safe following distance, driver distracted, driver failed to anticipate slowing traffic | Driver stopped legally and struck from behind while stationary, cut off with insufficient warning |
| Lane Change Crash | Driver failed to check blind spot, insufficient signal duration, driver moved into occupied lane | Other vehicle changed lanes into driver's lane without warning, other vehicle traveling at excessive relative speed |
| Backing Accident | Driver failed to walk around vehicle before backing, no spotter used when required, driver backed without clear view | Pedestrian or vehicle moved into backing path after driver established clear view, spotter gave incorrect instruction |
| Rollover | Excessive speed in curve, improper cargo securement causing shift, off-road recovery overcorrection | Other vehicle forced driver off road, road surface failure, struck object that fell from other vehicle |
Scroll horizontally on mobile to view all columns
Frequently Asked Questions
1. What are the most common causes of preventable truck accidents?
The most common preventable accident causes in fleet operations include following too closely for conditions, failure to check blind spots during lane changes, distracted driving including handheld device use, speeding in curves or construction zones, improper backing without spotters, driver fatigue exceeding HOS limits, and failure to adjust speed for weather conditions. Fleet safety programs targeting these specific behaviors show the largest accident reduction results.
2. How often should driver safety training be refreshed?
New drivers require safety orientation before first dispatch. Annual refresher training is the minimum standard for all active drivers, but leading fleets provide quarterly safety modules focused on high-risk areas identified in their own data. Drivers involved in preventable accidents require immediate remedial training on the specific skills that failed during the accident event, regardless of when prior training occurred.
3. What safety technology provides the best return on investment for fleets?
Forward collision warning with automatic emergency braking provides the strongest crash reduction ROI for highway fleets, reducing rear-end collisions by over 40 percent in FMCSA studies. For backing and low-speed maneuvers, side object detection and reverse cameras prevent the frequent low-speed accidents that drive up insurance claims frequency. Video-based safety systems with event recording enable coaching on specific driver behaviors before they cause crashes.
4. How are fleet safety incentives structured to reward safe driving?
Effective safety incentive programs reward safe behaviors rather than accident-free periods alone because accident-free periods can reward luck as much as skill. Programs that combine bonuses for zero preventable accidents with positive reinforcement for observed safe behaviors such as smooth braking, proper following distance, and thorough pre-trip inspections produce better safety outcomes than programs that only penalize accidents.
5. What documentation is required to defend a fleet safety program in litigation?
When a fleet accident results in litigation, plaintiff attorneys request all safety program documentation including driver training records, vehicle inspection reports, maintenance records, safety policy manuals, safety committee minutes, driver discipline records, and any camera or telematics data from the accident vehicle. Fleets with complete, organized, and consistently applied safety documentation defend more successfully than fleets with missing records or inconsistent policy enforcement.
6. How do fleet safety programs reduce insurance premiums?
Insurance underwriters evaluate fleet safety programs through applications, loss runs, and sometimes onsite safety audits. Fleets with documented safety programs including driver training tracking, vehicle inspection records, accident investigation procedures, and safety technology deployment receive lower experience modification factors and qualify for preferred risk programs. Insurers consider safety program quality as predictive of future loss experience.
7. What is the difference between a safety policy and a safety culture?
A safety policy is a written document that establishes rules and procedures. A safety culture exists when safety rules are consistently followed because drivers and staff believe in their importance, not because they fear punishment. Safety culture develops when leadership models safe behavior, drivers participate in safety decisions through committees and hazard reporting, and safety performance carries the same weight as productivity metrics in performance reviews.







