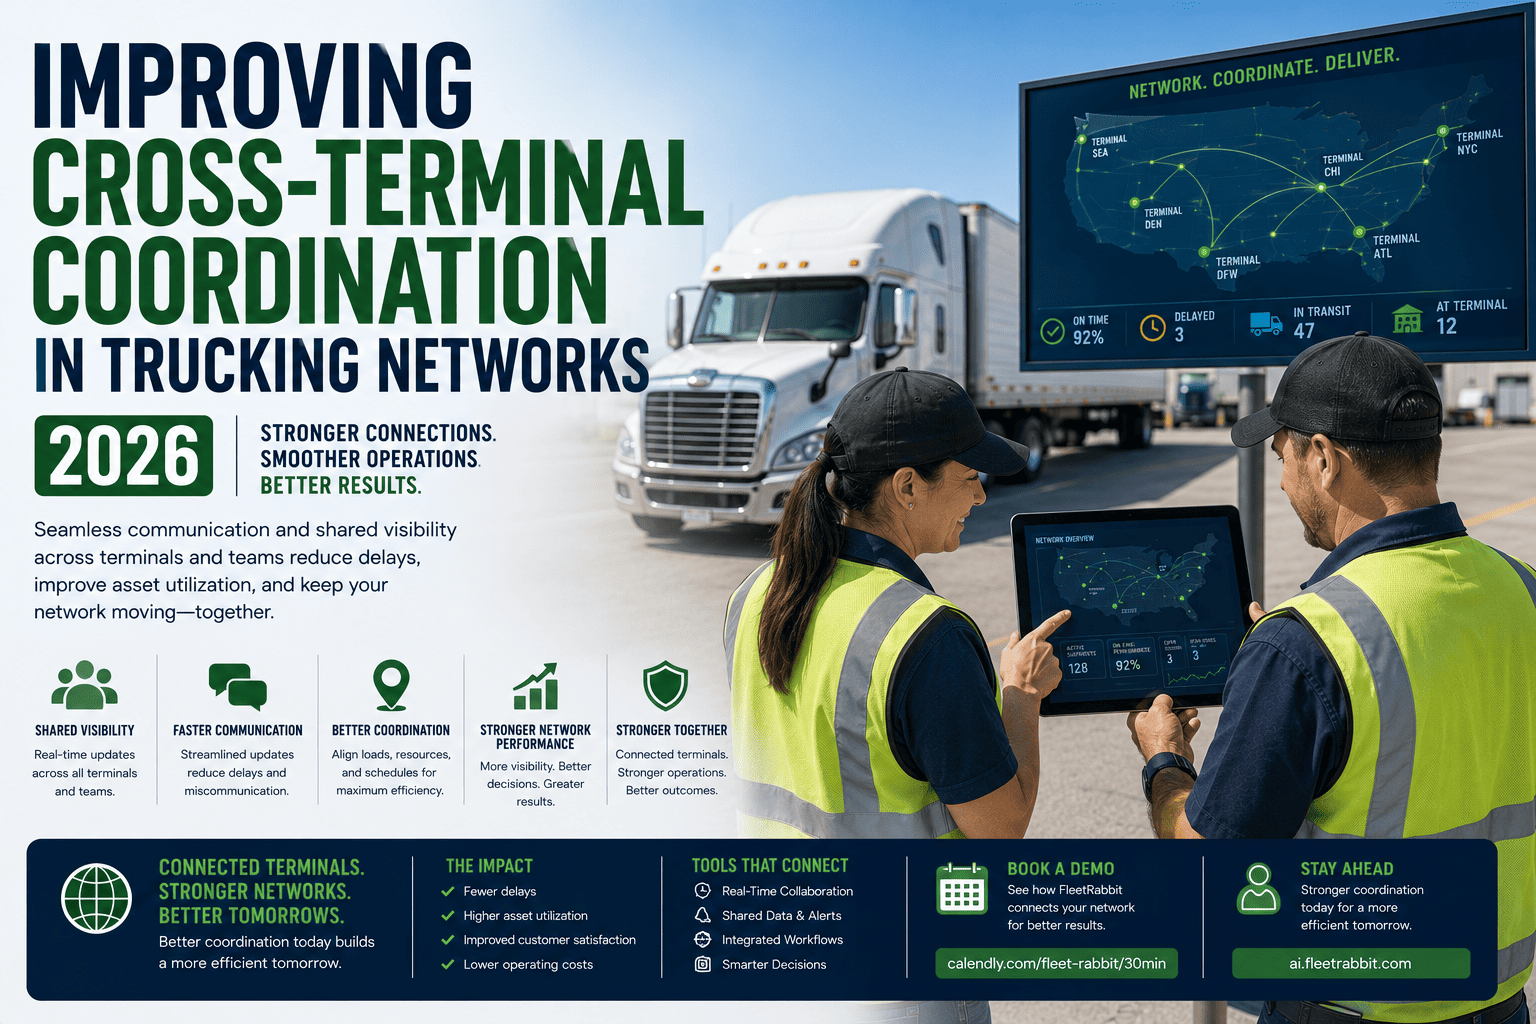
Run a fleet out of a single yard and visibility is simple. Add a second terminal, then a third, and something quietly breaks. The same truck count, the same freight volume, the same drivers, yet nobody can answer a simple question fast: which trailers are sitting idle two cities over, which terminal has a mechanic free this afternoon, or why one location runs lean on drivers while another sits overstaffed. Multi-terminal operations do not fail because of bad people or bad trucks. They fail because each location quietly becomes its own island of data.
A fleet averaging 85 percent utilization network-wide can still hide individual terminals running well below 50 percent, invisible until asset data is centralized. Real-time trailer visibility across terminals typically recovers 20 to 35 percent more detention revenue simply from accurate dwell-time data. Fleets connecting terminal data into one platform consistently outperform those running each location as its own silo.
What A Siloed Terminal Network Actually Looks Like
Picture four terminals, each running its own spreadsheet, its own maintenance log, and its own sense of which trailers belong where. No line connects them. A dispatcher at Terminal A has no visibility into an idle trailer sitting at Terminal C, so freight gets delayed while a perfectly good asset sits unused two hours away. This is the default state for most growing carriers, and it is more common than most operators realize until someone finally asks where every unit actually is right now.
Where Coordination Breaks Down First
The gap between siloed and centralized operations shows up in a handful of predictable places, and each one carries a real cost that compounds the longer it goes unaddressed.
| Operational Area | Siloed Terminal Network | Centralized Coordination |
|---|---|---|
| Trailer Visibility | Location known only by calling drivers or dispatchers at each site | Live location and status visible from any terminal, instantly |
| Maintenance Scheduling | Each terminal manages its own shop queue independently | Shared maintenance calendar routes trucks to the nearest available bay |
| Driver Assignment | One terminal short-staffed while another sits overstaffed | Cross-terminal driver visibility balances assignments network-wide |
| Detention Billing | Dwell time estimated manually, revenue frequently uncollected | Accurate dwell-time data captured automatically at every location |
| Utilization Reporting | Fleet-wide average hides which specific terminal is underperforming | Per-terminal, per-asset utilization visible in one dashboard |
FleetRabbit centralizes trailer location, maintenance scheduling, and driver assignment across every terminal in your network into a single live dashboard. You can sign up for a free trial and see your full network on one screen within a day.
Four Capabilities That Actually Connect A Terminal Network
Centralizing a multi-terminal operation does not require ripping out every system your terminals already use. It requires a small set of shared capabilities that every location feeds into and every location can see.
Shared Asset Location
Every trailer and truck visible on one map, whether hooked up, dropped, or in transit between terminals.
Unified Maintenance Calendar
A truck due for service gets routed to whichever terminal has bay availability first, not just its home yard.
Cross-Terminal Driver Visibility
Managers at every location see driver availability network-wide, not just within their own terminal roster.
Centralized Analytics
Utilization, cost per mile, and compliance reporting broken down by terminal, lane, and asset, in one dashboard.
Why This Order Matters
Shared asset location is almost always the fastest win because it touches every other capability. Once every terminal can see where a trailer or truck actually is, maintenance routing and driver balancing become far easier problems to solve on top of that same data foundation.
Benchmarks Worth Comparing Your Network Against
Top-performing mixed fleets target 85 percent utilization or better network-wide, but that number only means something once it is measured per terminal and per asset rather than as one blended average. A network averaging 85 percent can still be quietly carrying a terminal running at 40 percent, consuming fixed costs while contributing almost nothing to revenue. The fleet management software market itself has grown past 30 billion dollars in 2026, reflecting how central this kind of centralized visibility has become to logistics operations of every size.
A Fast Way To Test Your Own Network
Ask any manager at any one terminal to name the exact location and status of a specific trailer assigned to a different terminal, right now, without a phone call. If they cannot answer within a minute, your network is still running as separate islands rather than one connected operation. Fleets that book a demo often use this exact test as their starting benchmark.
FleetRabbit connects trailer location, maintenance scheduling, driver assignment, and utilization reporting across every terminal into a single live dashboard. Stop treating each location as its own island and start running one connected network.







