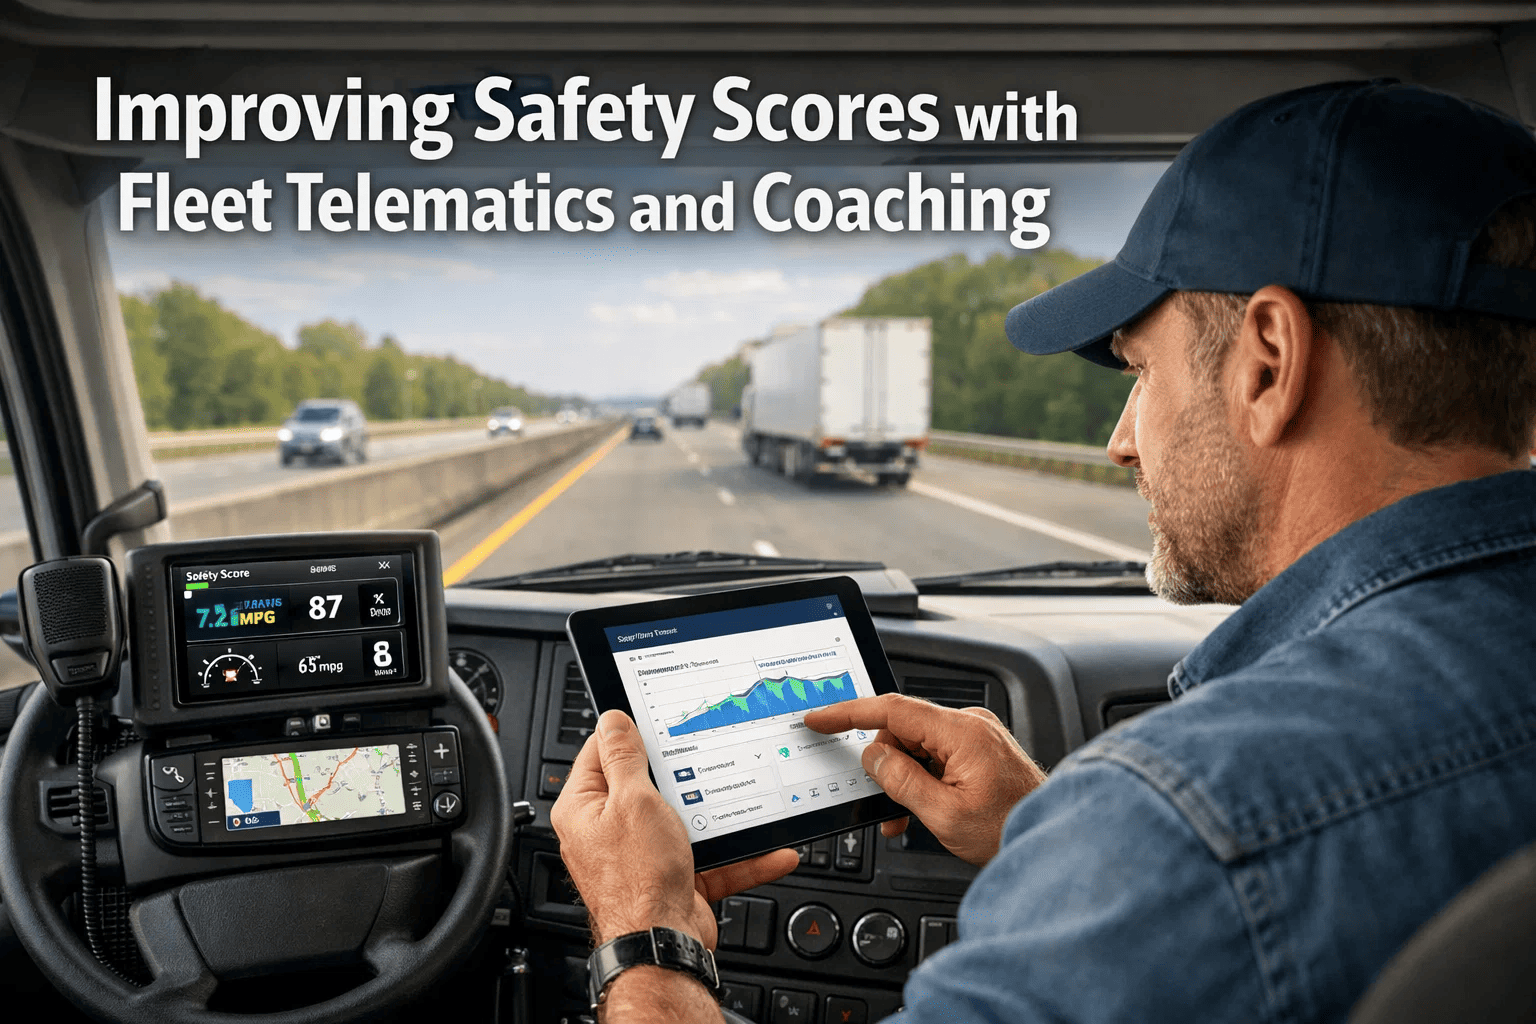
Improving Safety Scores with Fleet Telematics and Coaching

improving-safety-scores-fleet-telematics

Safety scores in commercial trucking are not abstract compliance benchmarks — they are the operational metrics that determine insurance premiums, customer contract eligibility, FMCSA intervention risk, and ultimately the financial viability of the carrier. A fleet with a deteriorating CSA Unsafe Driving BASIC score is not merely a carrier with compliance paperwork to address; it is a carrier that will face higher insurance renewal quotes at the next renewal, lose eligibility for safety-sensitive freight contracts that require carriers to demonstrate current score compliance, and risk progressive FMCSA intervention up to and including an enforcement action that threatens operating authority. For fleet executives — including VPs of Safety, COOs, and fleet directors — the commercial fleet safety score represents a continuously updated public valuation of the carrier's safety culture, driver management discipline, and compliance infrastructure, visible to every shipper, broker, and insurance underwriter who chooses to review it. This guide examines how CSA scores are constructed, which BASIC categories pose the highest risk for typical trucking operations, how fleet telematics data from FleetRabbit provides the safety manager with the visibility needed to identify and address score risk before roadside violations enter the SMS system, and how a structured driver coaching program built on telematics data rather than general safety policy produces measurable, sustained safety score improvement for fleets of all sizes. Book a demo to see how FleetRabbit's safety analytics and driver coaching tools support CSA score improvement for your fleet.

Why CSA Scores Matter to Fleet Leadership
Insurance underwriters review CSA BASIC percentiles at renewal — carriers in the 70th percentile or higher in key BASICs face surcharges of 15 to 40 percent above clean-score carriers in the same risk tier
Large shipper RFPs increasingly include minimum CSA score requirements — carriers above defined thresholds are disqualified from responding regardless of capacity and pricing
FMCSA uses BASIC percentile thresholds as investigation and intervention triggers — carriers above threshold in multiple BASICs face increased probability of Compliance Review
Freight broker risk assessment algorithms increasingly factor carrier CSA scores into load matching and rate negotiation, with deteriorating scores reducing load access below threshold levels
7
CSA BASIC categories, each measured independently against peer carriers with similar operational volume
24 mo
rolling window for CSA violation data — older violations age out, but current violations accumulate rapidly
Guide Coverage
How CSA BASIC scores are calculated and which categories pose highest risk
The telematics data types that predict roadside violation risk before citations occur
FleetRabbit safety analytics capabilities for fleet-wide and driver-level risk identification
Building a data-driven driver coaching program that produces sustainable safety score improvement
Pre-trip inspection discipline and DVIR compliance as a Vehicle Maintenance BASIC score driver
Executive safety dashboard design for VP of Safety and CFO stakeholder reporting

Understanding How CSA BASIC Scores Are Calculated

The Compliance, Safety, Accountability system scores carriers across seven Behavior Analysis and Safety Improvement Categories, each of which measures a different dimension of carrier safety performance using data from roadside inspections, crash reports, and investigation findings. Each BASIC is measured independently, and a carrier can have a problematic score in one BASIC while performing well in others — though carriers with deteriorating scores in multiple BASICs simultaneously face compounding intervention risk that is greater than the sum of individual BASIC risks.

Unsafe Driving
Speeding, reckless driving, improper lane change, inattention
Alert Threshold: 65th percentile for passenger-carrying, 65th for freight
Telematics flag: Speed over posted limit, harsh braking events, rapid acceleration patterns
Hours of Service
HOS violations, false logs, operating beyond 11 or 14-hour limits
Alert Threshold: 65th percentile — one of the most heavily weighted BASICs
Telematics flag: FleetRabbit HOS monitoring near-limit alerts before violation occurs
Driver Fitness
Operating with expired CDL, medical certificate issues, disqualified driver
Alert Threshold: 80th percentile
Telematics flag: FleetRabbit DQF expiration alerts for CDL and medical certificate tracking
Vehicle Maintenance
Brake defects, tire violations, lighting defects, improper cargo securement
Alert Threshold: 80th percentile
Telematics flag: DVIR defect patterns, PM overdue status, inspection finding trends
Controlled Substances / Alcohol
Positive drug or alcohol tests, refusals, violation citations at roadside
Alert Threshold: 80th percentile — zero tolerance framework
Telematics flag: Indirect indicators — behavior pattern anomalies, schedule deviations
Hazardous Materials
Hazmat documentation, placarding, packaging violations
Alert Threshold: 80th percentile — applies only to hazmat carriers
Telematics flag: Not directly addressable by telematics — documentation and training programs required
Crash Indicator
Reportable crashes in DOT-reportable categories weighted by severity
Alert Threshold: 65th percentile
Telematics flag: Harsh braking, near-miss events, following distance alerts as leading indicators

How Fleet Telematics Data Predicts Roadside Violation Risk

The fundamental insight underlying telematics-based safety score management is that roadside violation events — the data points that enter the CSA BASIC calculations and affect carrier scores — are almost always preceded by measurable driver behavior patterns that appear in telematics data before the violation occurs. A driver who is speeding in telematics data is the same driver who will receive a speeding citation at the next roadside inspection. A driver whose HOS monitoring shows repeated near-limit operation is the same driver at elevated risk for an HOS violation at a scale site or DOT checkpoint. A vehicle whose DVIR inspection history shows recurring brake lining findings is the vehicle most likely to be placed out of service for a brake defect at a CVSA inspection blitz.

This predictive relationship between telematics behavior data and subsequent roadside violations is the operational rationale for investing in fleet telematics analytics as a safety score management tool. By systematically reviewing telematics behavior data for leading indicators of violation risk — and intervening with targeted coaching, training, or maintenance action before the violation occurs — fleet safety managers can prevent the CSA score events that would otherwise accumulate over the 24-month rolling window and drive the percentile rank upward into intervention threshold territory.

Telematics Leading Indicators by CSA BASIC Category
Unsafe Driving BASIC
Speed events above posted limit — frequency, magnitude, and geographic pattern
Harsh braking events — frequency per 1,000 miles, correlation with following distance
Rapid acceleration events — aggressive throttle pattern associated with aggressive driving style
Lane change telematics flags in equipped vehicles — correlation with inattention complaints
HOS BASIC
Hours remaining versus dispatch schedule — identifying drivers operating close to limit before departure
Frequency of pre-dispatch near-limit events — pattern of scheduling drivers with inadequate remaining hours
Personal conveyance usage pattern anomalies — geographic or time correlation flags
ELD edit frequency — high edit volume in driver records suggests HOS recording discipline issues
Vehicle Maintenance BASIC
DVIR defect finding frequency by vehicle — vehicles with repeat defect categories approaching inspection point
PM overdue status — vehicles operating beyond scheduled maintenance interval for brake, tire, or lighting service
Driver defect reporting rate — low reporting drivers may be underreporting conditions visible at roadside
DTC fault code frequency from engine telematics — fault codes on systems subject to roadside inspection
Crash Indicator
Harsh braking event frequency and severity — primary telematics predictor of crash risk
Speed in excess of road conditions — events flagged at road speed above weather-adjusted safe speed
Roll stability system activation history in equipped vehicles — activation events indicate stability-threatening maneuvers
Night driving proportion for high-incident drivers — elevated night driving percentage correlates with fatigue-related risk
FleetRabbit Safety Analytics for CSA Score Improvement
FleetRabbit's driver performance analytics provide fleet safety managers with driver-level telematics behavior data, safety score risk rankings, and coaching workflow tools — all in one platform used for daily fleet operations. No separate safety analytics subscription required.

FleetRabbit Safety Analytics: From Data to Score-Improving Action

The gap between having telematics data and improving safety scores is the gap between data availability and data-driven action. Fleet managers who have access to detailed telematics reports but lack the structured workflow to convert those reports into targeted coaching conversations, vehicle maintenance actions, and scheduling interventions will see little score improvement despite high data visibility. FleetRabbit's safety analytics are designed not only to surface the data, but to organize it in a way that makes the required action immediately apparent and executable within the same platform rather than requiring export, analysis in a separate system, and manual re-entry into a coaching workflow.

Driver Safety Risk Dashboard
FleetRabbit ranks all drivers by composite safety risk score, calculated from weighted telematics behavior events including speed violations, harsh braking frequency, HOS proximity events, and DVIR reporting rate. Safety managers can see at a glance which drivers are in the bottom quartile of safety performance and require priority coaching attention — without manually reviewing individual telematics reports for each driver in the fleet. The dashboard updates continuously as new telematics data is processed.
Safety Event Alert Configuration
Fleet managers configure specific telematics event thresholds in FleetRabbit that trigger automatic safety alerts — for example, any speed event exceeding 15 mph over the posted limit triggers an immediate notification to the driver's manager with the event details, location, and video clip if forward-facing dashcam footage is integrated. These real-time alerts enable same-day coaching conversations after significant safety behavior events rather than waiting for the weekly telematics report review cycle.
DVIR Compliance Tracking for Maintenance BASIC Risk
FleetRabbit tracks DVIR completion rate by driver and by vehicle, displaying the percentage of required pre-trip and post-trip inspections that were completed on time versus skipped. Low DVIR compliance rate for specific drivers is a coaching flag — a driver who consistently skips or shortcuts DVIR inspections is the driver most likely to operate a vehicle with a defect that a CVSA inspector will cite at roadside. DVIR trend reporting also shows which vehicles are generating the highest defect finding rates, supporting proactive maintenance scheduling decisions that remove defect-prone vehicles from service before they generate Vehicle Maintenance BASIC citations.
HOS Near-Limit Proximity Monitoring
FleetRabbit's HOS monitoring module tracks not only actual violations but near-limit events — instances where a driver approached the 11-hour, 14-hour, 60-hour, or 70-hour limit within a configurable proximity threshold before going off-duty. High near-limit event frequency for specific drivers or specific routes indicates systematic scheduling pressure that, if not addressed, is leading to actual violations at an increasing rate. This near-limit data provides safety managers with the evidence needed to have scheduling adjustment conversations with operations management before drivers cross into violation territory.
Fleet Safety Trend Analysis for Executive Reporting
FleetRabbit's analytics module generates fleet-wide safety trend reports for VP of Safety and CFO stakeholder audiences, showing the trajectory of key safety behavior metrics — speed event frequency per 100,000 miles, harsh braking rate, DVIR compliance rate, and near-HOS-violation frequency — over rolling 90-day and 12-month periods. These trend lines are the leading indicator data that allow safety executives to assess whether the carrier's actual safety performance trajectory is improving or deteriorating before the CSA score data — which reflects a prior-period snapshot — confirms the direction.

Building a Driver Coaching Program That Produces Sustained Safety Score Improvement

Driver coaching programs that rely on periodic policy review meetings, general safety reminders at driver briefings, and reactive corrective interviews after specific incidents consistently produce temporary behavioral compliance during the period of heightened scrutiny immediately following the coaching event, followed by regression toward baseline behavior as the scrutiny recedes. Fleet managers who have invested in safety coaching over the years without achieving sustained score improvement are almost always running this model — the general policy model — rather than a data-specific, individually-accountable coaching model built on telematics evidence.

The coaching model that produces sustained safety score improvement has three structural characteristics that distinguish it from general policy messaging. The first is individual specificity: every coaching conversation references a specific driver's specific behaviour data from a specific time period — not general fleet statistics or examples from other drivers' experience. When a driver sees their own speed event record, their own harsh braking frequency, and their own near-HOS-limit pattern presented in a coaching conversation, the level of engagement and accountability is qualitatively different from a general discussion about fleet safety policy. The second characteristic is regular frequency: effective safety coaching occurs at intervals short enough that drivers maintain continuous awareness that their performance is monitored and discussed — typically monthly or bi-weekly for the highest-risk drivers, quarterly for mid-tier performers, and semi-annually for drivers consistently performing above the fleet average. The third characteristic is documented follow-through: coaching conversations that are documented in a driver's performance record, with specific improvement targets and a follow-up review date, produce better outcomes than undocumented conversations that leave no accountability trail and no clear expectation of improvement measurement.

FleetRabbit-Supported Driver Coaching Workflow
Phase 01
Weekly Risk Triage
Every week, the safety manager reviews FleetRabbit's driver safety risk dashboard to identify the 10 to 15 percent of drivers with the highest composite risk scores from the prior week's telematics data. These drivers are flagged for coaching priority in the following week. The triage takes 15 to 20 minutes when the dashboard is designed for rapid scanning — which FleetRabbit's ranking view supports.
Phase 02
Data-Specific Coaching Preparation
For each priority driver, the safety manager pulls the driver's specific telematics event report from FleetRabbit — showing the speed events with location and magnitude, the harsh braking events with context, the DVIR completion rate, and any HOS proximity events — and prepares the coaching conversation around specific, documentable evidence rather than general safety concerns. The driver cannot dispute the data; the conversation focuses on understanding the context and establishing improvement commitments.
Phase 03
Documented Coaching Conversation
The coaching conversation is conducted by the driver's direct manager or the safety manager, with the specific performance data visible during the conversation. Outcomes — including the specific improvement targets agreed upon, any training assigned, and the follow-up review date — are documented in FleetRabbit's driver compliance record and reviewed at the next coaching interval. Documentation creates the accountability loop that general policy conversations cannot provide.
Phase 04
Progress Tracking and Recognition
At each subsequent coaching interval, FleetRabbit's driver performance comparison view shows the driver's metrics from the current period against their baseline from the pre-coaching period. Drivers showing measurable improvement receive recognition — which FleetRabbit supports through driver performance acknowledgment records that can be communicated to the driver and documented in the personnel file. Recognition of improvement is as important as feedback on underperformance for sustaining a culture where safety performance is a valued and measured dimension of the driver's professional identity.
Phase 05
Executive Safety Program Review
Monthly, the safety manager presents FleetRabbit's fleet-wide safety trend report to the VP of Safety and operations leadership — showing the trajectory of key safety metrics, the coaching program completion rate, and the correlation between coaching activity intensity and safety behavior improvement. This executive review creates organizational accountability for safety program investment and ensures that operational pressure on drivers does not systematically undermine the coaching program gains.

Pre-Trip Inspection Discipline as a Safety Score Driver

The Vehicle Maintenance BASIC is one of the most directly controllable CSA score components for fleet operators because the violation events that populate it — brake defects, lighting defects, tire violations, coupling device issues — are almost entirely detectable through a properly executed pre-trip DVIR inspection before the vehicle encounters a roadside inspector who will cite the same defects. A fleet with high DVIR completion rates and a documented defect-resolution process for findings recorded in pre-trip inspections will have materially fewer Vehicle Maintenance BASIC violations than a fleet where DVIR inspections are treated as a paperwork formality completed without physical inspection of the components they purport to cover.

DVIR Compliance Framework: From Inspection to Score Protection
01
Consistent DVIR Completion
FleetRabbit's mobile DVIR application is accessible from a driver's smartphone or the vehicle's tablet, eliminating the paper log booklet that drivers frequently complete from memory in the cab rather than during a physical walk-around. The digital DVIR requires category-by-category sign-off that mirrors the physical inspection sequence — lights, brakes, tires, coupling, cargo securement — making shortcut completion more difficult and more visible in the audit record.
02
Defect Recording with Evidence
When a driver records a defect in FleetRabbit's DVIR module, the finding includes the inspection category, the specific defect description, and optionally a photo taken at the time of discovery. This photo evidence is valuable in two operational contexts: it confirms that the defect was physically observed rather than invented, and it provides the maintenance technician with a view of the specific defect before the vehicle arrives in the shop — reducing diagnostic time and enabling parts pre-staging.
03
Defect Resolution Documentation
FMCSA regulations require that defects recorded on DVIRs be reviewed by a qualified mechanic, repaired or certified as not requiring repair before the vehicle departs, and signed off by the mechanic with a return-to-service certification. FleetRabbit's defect resolution workflow captures this certification digitally, creating the complete documentation chain — from driver finding to mechanic review to return-to-service — required to demonstrate compliance in a DOT audit or Compliance Review.
04
DVIR Compliance Rate Monitoring
FleetRabbit tracks DVIR completion rate by driver, by vehicle, and by terminal — showing what percentage of required pre-trip and post-trip inspections were completed digitally within the required time window. Fleet managers can set minimum DVIR completion rate thresholds and receive alerts when individual drivers fall below the threshold. Driver managers use completion rate data in coaching conversations as a measurable safety discipline indicator alongside driving behavior metrics.

How Transportation Executives Use Safety Score Data for Strategic Decision-Making

Beyond the operational-level application of telematics data for driver coaching and vehicle maintenance risk management, the CSA score framework provides transportation executives with strategic information that should inform decisions about fleet composition, driver hiring standards, terminal management accountability, and customer freight selection. Executives who treat CSA scores as a compliance output rather than a strategic management metric are missing the operational intelligence embedded in the score trajectory that, when surfaced correctly, would allow them to allocate safety investment resources more effectively, hold terminal-level leadership accountable for safety culture outcomes, and make freight selection decisions that reduce the probability of crash events in the highest-risk operating contexts.

Executive-Level Safety Intelligence Framework
VP of Safety Applications
BASIC Trend Projection
FleetRabbit safety trend data allows the safety director to project whether current telematics behavior patterns are on a trajectory to push specific BASIC scores above alert thresholds before the violation data reports in the SMS system — enabling preventive investment rather than reactive program overhaul.
Terminal Safety Comparison
For multi-terminal carriers, FleetRabbit's analytics support safety KPI comparison across terminals — identifying which terminals consistently produce higher safety event rates and require targeted management or coaching program intervention versus terminals operating at or above the safety benchmark.
Safety Program ROI
Correlating coaching program activity in FleetRabbit's driver record system with telematics behavior trend data over the following 90 days quantifies the safety program's measurable impact — providing the ROI data needed to maintain safety investment when operational cost pressure creates pressure to reduce coaching program resources.
COO and CFO Applications
Insurance Premium Projection
Safety score trajectories are the primary predictor of insurance renewal pricing. FleetRabbit's BASIC risk trend data allows finance leadership to model the insurance renewal scenario — where deteriorating safety trends lead to premium increases — before the renewal, enabling proactive carrier-underwriter conversations about improvement program status.
Customer Contract Risk Assessment
Large shipper contracts increasingly include CSA score compliance provisions. Monitoring the carrier's score trajectory against contract threshold requirements allows operations leadership to identify contracts at risk before a score event triggers a default provision — and to have proactive customer communications about remediation programs in progress.
Hiring Standard Validation
FleetRabbit's driver safety performance data, correlated with hiring cohort characteristics such as experience level and prior violation history, allows fleet operators to validate whether their driver hiring standards are producing the expected safety performance outcomes or whether standards require adjustment to avoid the CSA score consequences of repeatedly onboarding high-risk drivers.

Safety Score Improvement Timeline: What Fleet Managers Can Expect

Fleet managers deploying a telematics-based safety analytics and driver coaching program through FleetRabbit for the first time commonly ask for a realistic timeline from program launch to measurable CSA score improvement. The honest answer is that telematics behavior improvements appear in FleetRabbit analytics data within 30 to 60 days of consistent coaching program execution. The translation of those behavior improvements into CSA score percentile improvement takes longer, because the CSA calculation uses a 24-month rolling window — meaning that previous violation events continue to influence the score until they age out of the calculation period even as new violation frequency declines.

Safety Improvement Program Timeline
Days 01 to 30
Program launch, data baseline establishment, initial driver risk ranking, first coaching conversations with highest-risk drivers conducted with specific telematics evidence
Days 31 to 90
Telematics behavior metrics begin improving in FleetRabbit analytics — speed event frequency declines, harsh braking rate drops, DVIR completion rate increases. Some highest-risk drivers show rapid improvement, others require additional or progressive coaching intervention. Fleet-wide safety score not yet reflecting full improvement.
Month 4 to 6
Roadside inspection citations in the categories addressed by coaching begin declining as the improved driver behavior reaches the road. The reduced citation frequency begins to counteract the weight of prior violations in the CSA calculation. CSA score percentile improvement becomes visible in the BASIC data for carriers who had recent violation concentrations in the relevant categories.
Month 7 to 12
Sustained telematics behavior improvement is reflected in CSA score percentile movement across the primary BASICs targeted by the coaching program. Fleets with previously elevated Unsafe Driving and Vehicle Maintenance BASIC scores typically see the clearest improvement in this window. HOS BASIC improvement may require parallel scheduling process changes to produce full effect.
Month 13 to 24
As older violation events age out of the 24-month rolling window and are replaced by the lower violation frequency of the coached period, CSA score percentile improvement accelerates. Carriers who have maintained consistent program discipline for 12 months consistently report reaching below-threshold percentile positions in previously elevated BASICs during this phase.

Frequently Asked Questions: Safety Scores, Telematics, and Fleet Coaching

How much does FleetRabbit's safety analytics and driver coaching infrastructure actually cost versus hiring additional safety staff?
The comparison that fleet safety executives consistently find compelling is the cost of the platform against the cost of a single insurance premium increase driven by CSA score deterioration. For a 100-truck fleet, a 15-point premium increase at renewal — which is achievable from a score deterioration of 10 to 15 percentile points — adds $150,000 or more to the annual insurance budget depending on the base premium structure. FleetRabbit's fleet management platform, which includes safety analytics alongside all other fleet management capabilities, is typically a fraction of that exposure at scale. Many FleetRabbit customers describe the platform investment as self-funding within the first year through insurance outcome improvement alone, before accounting for reduced accident costs, reduced citation fines, and customer contract accessibility gains from improved CSA scores.
Can a carrier challenge or dispute CSA violation data that appears to be due to factors outside the driver's or carrier's control?
Yes. FMCSA's DataQs system allows carriers to challenge inspection records and crash data that they believe contain errors or attributions that are factually incorrect. However, successfully challenging a violation requires documentary evidence — dashcam footage, maintenance records, inspection documentation — demonstrating that the citation was unwarranted or that the vehicle condition was due to a cause outside the carrier's control. FleetRabbit's DVIR records, maintenance work order history, and telematics data provide the documentary foundation for DataQs challenges that carriers without organized documentation systems typically cannot assemble. Carriers who challenge successfully have those events either corrected or flagged as not the carrier's fault in the SMS calculation, reducing the BASIC score impact.
What is the most common mistake fleet managers make in deploying safety coaching programs supported by telematics data?
The most common failure mode is deploying telematics data without a structured coaching workflow that converts data visibility into documented, accountable coaching conversations. Fleet managers who receive excellent telematics reports but conduct coaching informally — verbal discussions without documented outcomes, improvement targets, or follow-up review commitments — produce brief behavioral improvements that regress within weeks of the coaching event. FleetRabbit's driver record system supports structured coaching documentation that creates the accountability loop required for sustained improvement: specific event discussion, specific improvement targets, documented acknowledgment by the driver, scheduled follow-up review date. Managers who use this structure consistently report faster and more durable behavior improvement than those who treat coaching as an informal conversation.
How does FleetRabbit handle safety analytics for carriers operating mixed fleets with different vehicle types and operating contexts?
FleetRabbit supports fleet segmentation in the analytics module — allowing safety managers to create separate performance groups for different vehicle classes, operational contexts, or terminal assignments and compare safety event rates within peer groups rather than against a mixed-fleet average that may not be meaningful for any specific driver subpopulation. A temperature-controlled delivery driver operating in an urban multi-stop route, for example, is evaluated against other drivers in the same route type rather than against long-haul drivers whose speed event context and driving environment are fundamentally different. This segmentation capability produces coaching conversations grounded in relevant peer comparison rather than cross-operational averages that drivers correctly perceive as unfair.

Safety Scores Improve When the Right Data Reaches the Right People at the Right Time

FleetRabbit gives fleet safety managers, VP of Safety executives, and driver managers the telematics analytics, driver safety risk rankings, coaching workflow documentation, and DVIR compliance monitoring required to build and sustain the kind of data-driven safety program that produces measurable CSA score improvement — not in 24 months, but in 90 to 180 days of consistent, evidence-based driver coaching supported by the fleet's own operational data.


CSA Score Improvement Fleet Telematics Safety Driver Coaching Programs DVIR Compliance HOS Monitoring Insurance Premium Reduction

April 18, 2026 By Jason Smith
All Posts

Share This Story, Choose Your Platform!

Latest Posts

Scroll





