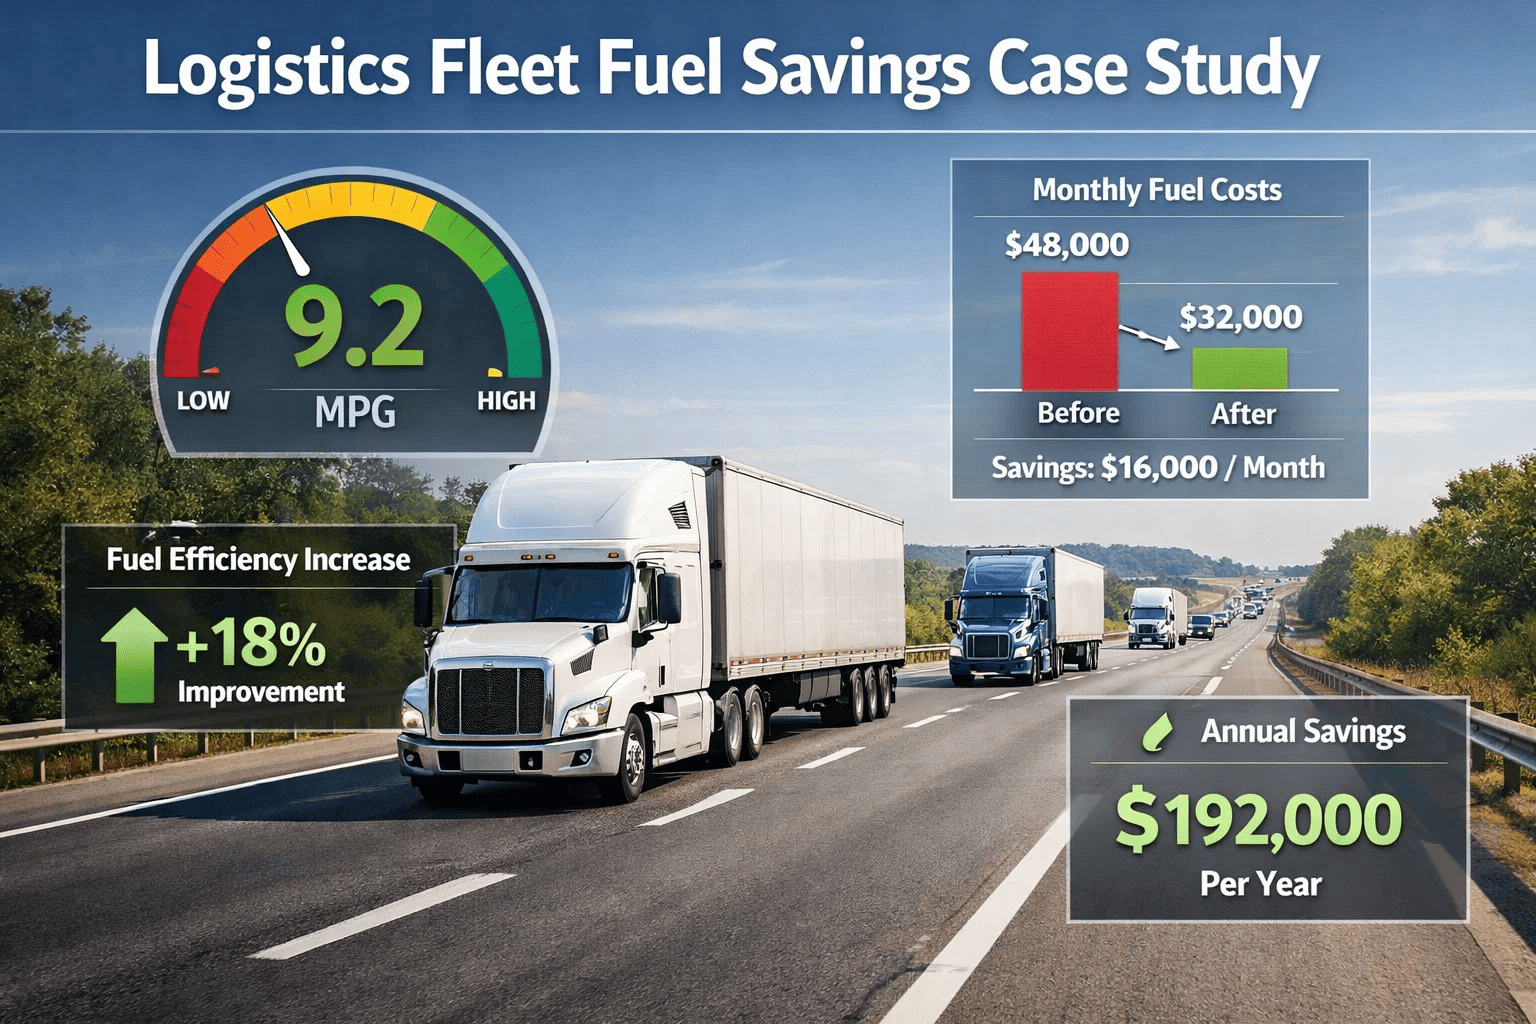
Fuel is the single largest controllable expense in commercial trucking operations — accounting for 24 to 28 cents of every revenue dollar in a typical long-haul fleet. For a logistics company operating 80 trucks averaging 125,000 miles per vehicle annually, a one-cent-per-mile improvement in fuel efficiency generates more than $100,000 in annual savings without adding a single load to the schedule. This case study documents how a regional logistics fleet of 84 vehicles operating across the Southeast and Midwest achieved a 19.4% reduction in fuel cost per mile within nine months of deploying FleetRabbit's fleet management platform — eliminating fuel waste from idle behavior, route inefficiency, maintenance-related consumption increases, and unauthorized fuel use across their entire operation. Book a demo to see how FleetRabbit's fuel management tools work.
Before deploying FleetRabbit, this logistics fleet operated without real-time fuel consumption visibility. Fuel cards provided transaction-level data, but that data arrived 24–48 hours after the transaction and contained no context — no route, no vehicle health status, no driver behavior correlation. Fleet managers could see that fuel costs were high but had no structured way to diagnose why or where to intervene.
Excessive Idle Time Fleet-Wide
Drivers averaged 4.7 hours of daily idle engine time — burning fuel at approximately $0.82/hour without generating revenue miles. No systematic idle monitoring was in place, and drivers had no feedback on their idle behavior between shifts.
Estimated Annual Waste: $187,000
Suboptimal Routing — Deadhead Miles
Without route optimization, dispatchers assigned loads using experience and proximity estimates rather than data-driven routing. Empty return miles averaged 22% of total mileage — significantly above the target threshold of 12%.
Estimated Annual Waste: $214,000
Maintenance-Driven Fuel Consumption Increase
Deferred tire maintenance, under-inflated tires, and overdue air filter replacements were degrading fuel economy across multiple vehicle units. Vehicles past service thresholds consumed an estimated 8–12% more fuel than properly maintained equivalents.
Estimated Annual Waste: $142,000
Aggressive Driving Behavior — Speed & Hard Acceleration
Speeding above 65 mph and hard acceleration events increased fuel consumption by 7–14% depending on vehicle load. Without driver behavior scoring, fleet managers had no visibility into which drivers were generating the highest fuel burn per mile.
Estimated Annual Waste: $98,000
The FleetRabbit Implementation — Four-Module Deployment
FleetRabbit was deployed across the full 84-vehicle fleet in a phased rollout over six weeks. The implementation covered four core modules directly tied to fuel consumption: real-time GPS and driver behavior monitoring, route optimization, predictive maintenance, and fuel card integration with anomaly detection.
Weeks 1–2
GPS Telematics & Driver Behavior Activation
FleetRabbit telematics activated across all 84 vehicles. Real-time idle time monitoring, speed profiling, and hard acceleration/braking event tracking enabled from day one. Fleet manager dashboard configured with baseline metrics for all drivers.
FleetRabbit's route optimization module integrated with the fleet's existing dispatch workflow. Load assignments began routing through AI-optimized planning that minimized deadhead miles and sequenced multi-stop routes for maximum loaded mile percentage.
Predictive Maintenance for Fuel-Impacting Components
Maintenance module deployed with focus on fuel-efficiency-impacting service items: tire pressure monitoring, air filter service intervals, fuel injector health, and DPF condition tracking. Vehicles with outstanding maintenance items flagged for priority service scheduling.
TPMS Monitoring LiveService Alerts Active12 Priority Work Orders Created
Weeks 5–6
Fuel Card Integration & Anomaly Detection
Fuel card data integrated with GPS location records. Every fuel transaction cross-referenced with vehicle location, odometer readings, and fuel tank capacity — automatically flagging purchases inconsistent with vehicle position, volume anomalies, or out-of-route transactions.
4.7 hrs/day → 3.2 hrs/day average (31% improvement)
Within 30 days of idle monitoring activation and driver scorecard visibility, fleet-wide average idle time dropped from 4.7 hours to 3.8 hours per day — without any policy changes or coaching conversations. Drivers could see their own idle scores in the app, and the visibility itself drove behavior change. By month three, after the fleet introduced a structured driver coaching program using FleetRabbit idle data, the fleet average reached 3.2 hours — 31% below the baseline and within the fleet's 3-hour target threshold.
$57,970
Annual Fuel Savings from Idle Reduction
1.5 hrs
Daily Idle Reduction per Vehicle
31%
Idle Time Improvement
Deadhead Mile Reduction
22% empty miles → 13.8% (37% improvement)
Route optimization delivered the most significant financial impact of the four deployed modules. By month six, FleetRabbit's AI routing had driven empty mile percentage from 22% to 13.8% of total mileage — a reduction of 8.2 percentage points. The system achieved this through improved backhaul identification, multi-stop route sequencing optimization, and real-time rerouting when appointment changes occurred mid-trip. Total loaded miles per vehicle increased by 6.8% without adding route hours.
$193,400
Annual Savings from Reduced Empty Miles
8.2 pts
Deadhead Percentage Reduction
6.8%
Increase in Loaded Mile Percentage
Maintenance-Driven Fuel Recovery
3.1% MPG improvement from maintenance catch-up
In the first two weeks after predictive maintenance activation, FleetRabbit identified 12 vehicles with tire pressure deviations exceeding 8 PSI below specification and six vehicles with overdue air filter replacement service. Correcting these items across the affected units immediately improved MPG on those vehicles. By month four, systematic maintenance adherence across the full fleet had contributed a 3.1% fleet-wide fuel economy improvement — translating to measurable cost reduction at scale.
$112,800
Annual Fuel Recovery from Maintenance
3.1%
Fleet MPG Improvement
18
Vehicles Identified & Serviced in Month 1
Driver Behavior Score Improvement
2.1% average MPG gain from speed and acceleration coaching
FleetRabbit's driver scorecard surfaced the top 15 fuel-inefficient drivers based on speed profile, hard acceleration events, and hard braking frequency. The fleet's safety manager conducted scored coaching sessions with each flagged driver using FleetRabbit data as the basis for the conversation — replacing subjective discussions with objective, timestamped behavioral data. By month seven, the 15 flagged drivers had improved their combined fuel efficiency score by 22%, contributing a 2.1% improvement in fleet-wide MPG.
$73,800
Annual Savings from Driving Behavior
22%
Fuel Score Improvement (Flagged Drivers)
2.1%
Fleet MPG Gain from Coaching
FleetRabbit Fuel Management
Calculate Your Fleet's Fuel Savings Potential With FleetRabbit
A fleet of 84 trucks achieved $618,000 in annual fuel savings. Your fleet's savings potential depends on current idle rates, route efficiency, and maintenance adherence — all quantifiable with FleetRabbit's fleet intelligence platform.
The savings documented in this case study were produced by six specific FleetRabbit platform capabilities working in combination. Each capability addresses a distinct fuel loss vector — and together, they create a compounding efficiency improvement that scales with fleet size.
Real-Time Idle Monitoring & Driver Alerts
Engine idle time is tracked per driver, per route, and per location. Fleet managers receive daily idle summaries with driver rankings and location hot-spots. Drivers receive in-cab alerts after configurable idle thresholds — creating real-time accountability without supervisor intervention. Idle-reduction coaching sessions use FleetRabbit data as the factual basis for structured performance conversations.
AI Route Optimization
FleetRabbit's routing engine calculates multi-stop load sequences, minimizes deadhead miles, identifies backhaul opportunities, and updates routes in real time when appointment changes occur. Dispatch receives optimized route recommendations for every load assignment.
Fuel Card Integration & Fraud Detection
Every fuel purchase is cross-referenced with GPS location, tank capacity, and odometer readings. Transactions that don't match vehicle position, exceed tank capacity, or occur at unauthorized locations trigger immediate anomaly alerts to fleet managers.
Driver Fuel Efficiency Scorecards
Speed profiles, hard acceleration events, hard braking events, and MPG per route are combined into a driver efficiency score updated after every trip. Fleet managers see which drivers are underperforming and have objective data for structured coaching conversations.
We had been trying to address fuel costs for two years with fuel card reports and driver meetings, but without real-time data we were always reacting to last month's numbers. FleetRabbit changed the dynamic entirely. Within the first 60 days, we had visibility into idle time by driver, route efficiency by lane, and maintenance items that were costing us MPG on specific units. Our fuel cost per mile dropped from $0.412 to $0.332 over nine months. For a fleet our size, that's not a rounding error — that's a transformational financial result. We're now planning our next fiscal year with fuel efficiency targets that would have seemed unreachable before FleetRabbit.
Beyond Fuel — Additional Operational Improvements from the Same Deployment
$94,200
Reduction in Unplanned Maintenance Costs
Predictive maintenance prevented 14 roadside breakdowns in the 9-month period, avoiding towing, emergency repair premiums, and missed delivery penalties.
18 min
Faster Delivery ETA Accuracy
Real-time GPS tracking and FleetRabbit's delivery ETA updates reduced customer-facing delivery window inaccuracies by 63%.
94%
On-Time Delivery Rate (up from 86%)
Route optimization and real-time rerouting improved on-time delivery performance, directly improving customer retention and renewal rates.
28 min
DOT Audit Preparation (down from 4 days)
Digital DVIR and maintenance records generated a complete DOT audit package in under 30 minutes during a spot compliance check in month seven.
Frequently Asked Questions — Fleet Fuel Savings with FleetRabbit
QHow quickly can a fleet expect to see measurable fuel savings after deploying FleetRabbit?
In this case study, meaningful results were visible within 30 days of idle monitoring and driver scorecard activation — before route optimization or maintenance modules were fully integrated. Most fleets using FleetRabbit see measurable fuel cost improvement within the first four to six weeks of deployment. Full results from all four fuel-impacting modules typically compound over 90–180 days as driver behavior changes become habitual and maintenance catch-up is completed.
QWhat fuel card providers does FleetRabbit integrate with?
FleetRabbit integrates with major commercial fuel card providers including Comdata, WEX, EFS, Fuelman, and Love's Fleet Cards — enabling automatic transaction import and GPS cross-reference without manual data entry. For fleets using fuel card providers not on the standard integration list, FleetRabbit supports custom data import configurations. Book a demo to confirm your fuel card provider compatibility.
QDoes FleetRabbit's route optimization work for both dedicated and spot/brokered loads?
Yes. FleetRabbit's route optimization handles both dedicated route fleets with fixed customer stops and fleets mixing dedicated and brokered loads. For brokered loads, the system factors backhaul opportunities into load sequencing recommendations — identifying available lanes near planned destinations that can reduce empty return miles before a load is accepted.
QCan FleetRabbit's fuel tools be deployed on a mixed fleet with different vehicle types?
Yes. FleetRabbit supports mixed fleets with vehicle-class-specific fuel efficiency benchmarks — so a dry van's MPG performance is compared against dry van benchmarks, not reefer or flatbed vehicles. This prevents misleading comparisons and ensures driver scorecards reflect the actual efficiency of each vehicle type's operational profile.
QHow does FleetRabbit help fleet executives quantify ROI for budget presentations?
FleetRabbit's reporting module includes dedicated ROI and savings tracking views that compare current period fuel costs against baseline — calculated using pre-deployment averages. Fleet managers can export formatted savings reports showing total fuel cost reduction, MPG improvement, idle cost savings, and anomaly prevention totals for any date range — providing the financial narrative needed for executive and board-level presentations. Start your free trial to see the ROI reporting tools.
Your Fleet's Fuel Cost Is a Solvable Problem. FleetRabbit Is the Solution.
This logistics fleet reduced fuel cost per mile by 19.4% and saved $618,000 in year one with FleetRabbit. The same combination of real-time idle monitoring, AI route optimization, predictive maintenance, and driver efficiency scoring applies to any trucking fleet losing money to preventable fuel waste.