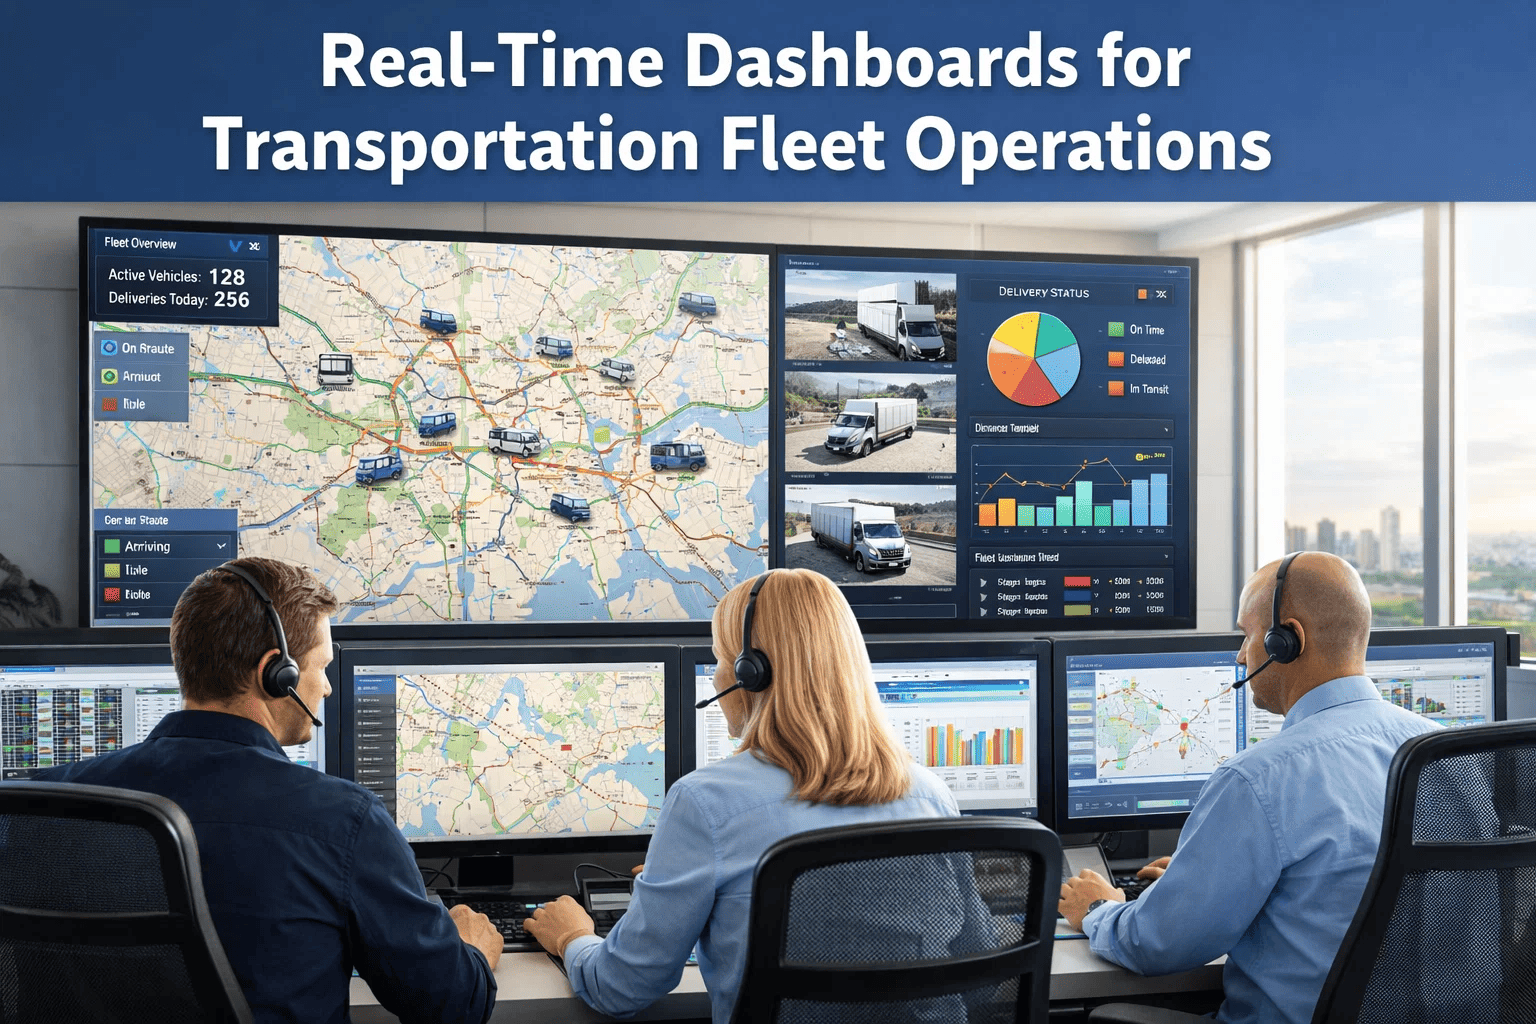
Transportation and logistics fleets generate enormous volumes of operational data — every mile driven, every fuel transaction, every inspection, every driver status event. The challenge is not data collection; it is transforming raw telemetry into decisions that reduce costs, prevent violations, and improve asset utilization before problems escalate. Real-time fleet dashboards solve this challenge by consolidating multi-system data into intuitive visual displays that fleet managers and executives can act on immediately, without waiting for end-of-month reports or manual spreadsheet analysis.
According to industry research, fleets using real-time operational dashboards reduce decision lag by 78% and identify cost-saving opportunities 4.2× faster than fleets relying on manual reporting. This guide covers the architecture of effective fleet dashboards, the metrics that matter most for transportation and logistics operations, and how FleetRabbit's analytics and reporting platform provides the real-time visibility that modern fleet management demands.
Real-Time Dashboards for Transportation Fleet Operations
Transform Fleet Data Into Decisions That Reduce Costs and Prevent Costly Violations
Why Real-Time Data Changes Everything for Fleet Executives
The difference between a real-time fleet dashboard and a weekly report is not just timing — it is the ability to intervene before a situation becomes a cost. A driver approaching HOS limits at 6 PM can be routed to a rest facility before a violation occurs. A vehicle showing brake system pressure anomalies can be taken out of service before a roadside inspection failure. A fuel consumption spike on a specific route can be investigated before a monthly fuel bill reveals the full impact. Real-time visibility converts reactive management into proactive operations.
Proactive Intervention
Act on anomalies before they become violations, breakdowns, or accidents. Real-time alerts enable same-day course correction rather than post-incident analysis.
Executive-Level Visibility
Fleet directors and CFOs gain consolidated, boardroom-ready performance metrics without waiting for manual reports to be assembled across multiple systems.
Time-Sensitive Compliance
HOS windows, DVIR completion deadlines, and driver document expirations all require same-day visibility to prevent violations that are completely avoidable with adequate notice.
Multi-Location Coordination
Transportation operations spanning multiple terminals, regions, or states require centralized visibility that eliminates information silos and enables enterprise-level optimization.
The 7 Core Dashboard Views Every Fleet Manager Needs
Effective fleet dashboards are not generic data displays — they are purpose-built views designed around specific decision contexts. These seven dashboard configurations address the most critical management needs for transportation and logistics fleet operations.
The command center view. Displays current vehicle status (in transit, idle, in maintenance, out of service), active driver HOS windows, today's pending DVIRs, and real-time alerts requiring immediate action. Designed for fleet managers starting their shift and dispatchers managing active loads.
Preventive maintenance schedule adherence, upcoming PM due dates sorted by urgency, open work orders by status and age, recurring failure pattern identification, and parts inventory levels for critical components. The primary view for maintenance managers and shop supervisors.
Real-time compliance health across all six FMCSA audit areas. Document expiration tracking with 90/60/30-day warning bands, HOS violation rate trends, DVIR completion rates by driver and location, and Clearinghouse query schedule status. Essential for Safety Directors and DOT compliance officers.
Fleet-wide fuel consumption trends, cost-per-mile tracking by vehicle and route, idle time analysis with cost quantification, fuel card transaction anomaly detection, and MTD vs budget performance. The financial intelligence view for operations managers and finance teams.
Individual driver performance scoring based on HOS compliance, DVIR completion, fuel efficiency, and inspection results. Comprehensive view for identifying coaching opportunities, recognizing top performers, and building objective documentation for performance management processes.
Vehicle utilization rates, revenue miles vs. total miles (deadhead ratio), asset availability percentage, and lifecycle stage by vehicle. Identifies chronically underutilized assets, supports fleet right-sizing decisions, and informs capital expenditure planning for replacement cycles.
Board-ready KPI summary combining financial performance, safety metrics, compliance status, and operational efficiency into a single consolidated view. Designed for fleet owners, VPs of Operations, and CFOs who need strategic visibility without operational detail.
See FleetRabbit's Real-Time Dashboards in Action
FleetRabbit gives transportation fleets a unified analytics platform with real-time operations monitoring, compliance tracking, and executive reporting — all in one system.
Critical Metrics Transportation Fleets Must Track in Real Time
Not all fleet metrics are created equal. High-impact operations require tracking the specific KPIs that drive costs, safety outcomes, and compliance status simultaneously. These metrics represent the essential monitoring layer for any transportation operation serious about data-driven management.
Hours of Service Remaining
Real-time HOS availability for every active driver. Approaching-limit alerts at 2-hour and 1-hour warn thresholds. Automatic flagging of unassigned driving events that require resolution within 24 hours.
DVIR Completion Status
Pre-trip and post-trip DVIR completion rate by driver and fleet-wide. Immediate alerts for uncertified defects and vehicles dispatched without completed pre-trip inspections.
Fuel Consumption vs Baseline
Per-vehicle and route-level fuel efficiency compared to established baseline. Daily variance flagging identifies idle time, route inefficiency, or potential fuel theft requiring investigation.
Compliance Document Expirations
Rolling 90-day view of all expiring compliance documents across the fleet. Color-coded urgency tiers (red: expired, amber: <30 days, yellow: <60 days) for immediate visual prioritization.
PM Schedule Adherence
Percentage of vehicles currently on PM schedule with days-overdue tracking for any missed service intervals. Overdue PM vehicles linked directly to work order creation workflow with one click.
Cost Per Mile Trend
Rolling 30/60/90-day cost-per-mile trend by vehicle, driver, route, and fleet aggregate. Upward trends trigger investigation workflows linking maintenance history, fuel data, and driver performance in context.
How FleetRabbit's Analytics Platform Delivers Real-Time Visibility
FleetRabbit's analytics and reporting module is designed specifically for transportation and logistics operations that need consolidated, actionable data without the complexity of enterprise BI tools or the limitations of single-function telematics platforms. Here is how the platform delivers real-time fleet intelligence across every operational area.
Unified Multi-System Data Consolidation
FleetRabbit integrates GPS and telematics data, ELD logs through HOS monitoring, fuel card transactions, maintenance work orders, DVIR records, and compliance documents into a single analytics layer. Managers no longer toggle between 5+ disconnected systems to build a complete operational picture. All data streams update in real time with 5-minute maximum latency from source systems.
Role-Based Dashboard Configuration
Different roles need different data. Fleet managers see the complete operations view with vehicle status and compliance alerts. Maintenance supervisors see PM schedules and work order queues. Executives see financial KPIs and safety rating summaries. FleetRabbit supports configurable role-based dashboards so every user sees the metrics relevant to their decisions — without information overload or security gaps from over-sharing sensitive data.
Intelligent Alert & Escalation Engine
Configurable alert thresholds for HOS limits, compliance expirations, fuel anomalies, and maintenance overdue events. Alerts route to the appropriate manager via dashboard notification, email, or mobile push — with escalation logic that triggers supervisor notification if primary alert recipients do not acknowledge within specified timeframes. No violations go unnoticed due to absent personnel.
One-Click Audit Package Generation
When FMCSA audit notices arrive, FleetRabbit generates complete documentation packages for any compliance area in seconds. The same analytics infrastructure that powers daily dashboards can produce formatted audit-ready reports covering HOS records, DVIR logs, maintenance history, driver qualification status, and accident registers — organized exactly as auditors expect to receive them.
Mobile-First Field Access
Fleet managers, safety directors, and executives access FleetRabbit analytics from any device. Mobile dashboards designed for field use provide the same real-time data as desktop views with touch-optimized interfaces. Drivers complete DVIRs, report defects, and receive dispatch updates through the mobile app — feeding real-time data directly into dashboard views.
Trend Analysis & Predictive Indicators
FleetRabbit analytics extend beyond current status to identify emerging patterns. Vehicles with increasing maintenance frequency, drivers showing upward HOS violation trends, and routes with deteriorating fuel efficiency are flagged before they escalate. Historical trend visualization allows managers to verify whether interventions are producing measurable improvements over time.
Building a Data-Driven Fleet Operations Culture
Technology alone does not create operational improvements — adoption does. Transportation executives who successfully leverage real-time fleet dashboards build structured processes around the data, not just access to it. These practices ensure analytics investments deliver measurable operational outcomes.
Daily 15-Minute Operations Huddle
Start each operational day with a structured dashboard review: active alerts, vehicles due for PM, HOS status of planned drivers for the day, and any compliance items requiring same-day action. Consistency builds the habit of data-driven decision making.
Driver Performance Reviews Using Dashboard Data
Monthly individual driver reviews using objective dashboard data — HOS compliance rate, DVIR completion percentage, fuel efficiency score, and inspection results. Data-backed performance conversations are more productive and defensible than subjective evaluations, especially for disciplinary documentation.
Monthly Executive KPI Reviews
Structured monthly review with operations leadership using the executive dashboard summary. Track cost-per-mile trends, PM compliance rates, compliance document status, and safety metrics against established targets. Tie dashboard performance directly to budget planning and investment decisions.
Quarterly Fleet Performance Benchmarking
Compare quarterly dashboard KPIs against industry benchmarks and prior-year performance. Identify which operational areas are improving and which require additional investment or process changes. Use benchmarked data to support insurance negotiations, customer SLA reporting, and fleet investment proposals.
Frequently Asked Questions: Fleet Dashboards & Analytics
Get Full Fleet Visibility in Real Time
FleetRabbit's analytics platform consolidates every operational data stream into real-time dashboards, automated alerts, and one-click audit reports — giving your team the visibility to make faster, smarter decisions every day.
Free for 3 vehicles | $3/vehicle/month | No contracts







