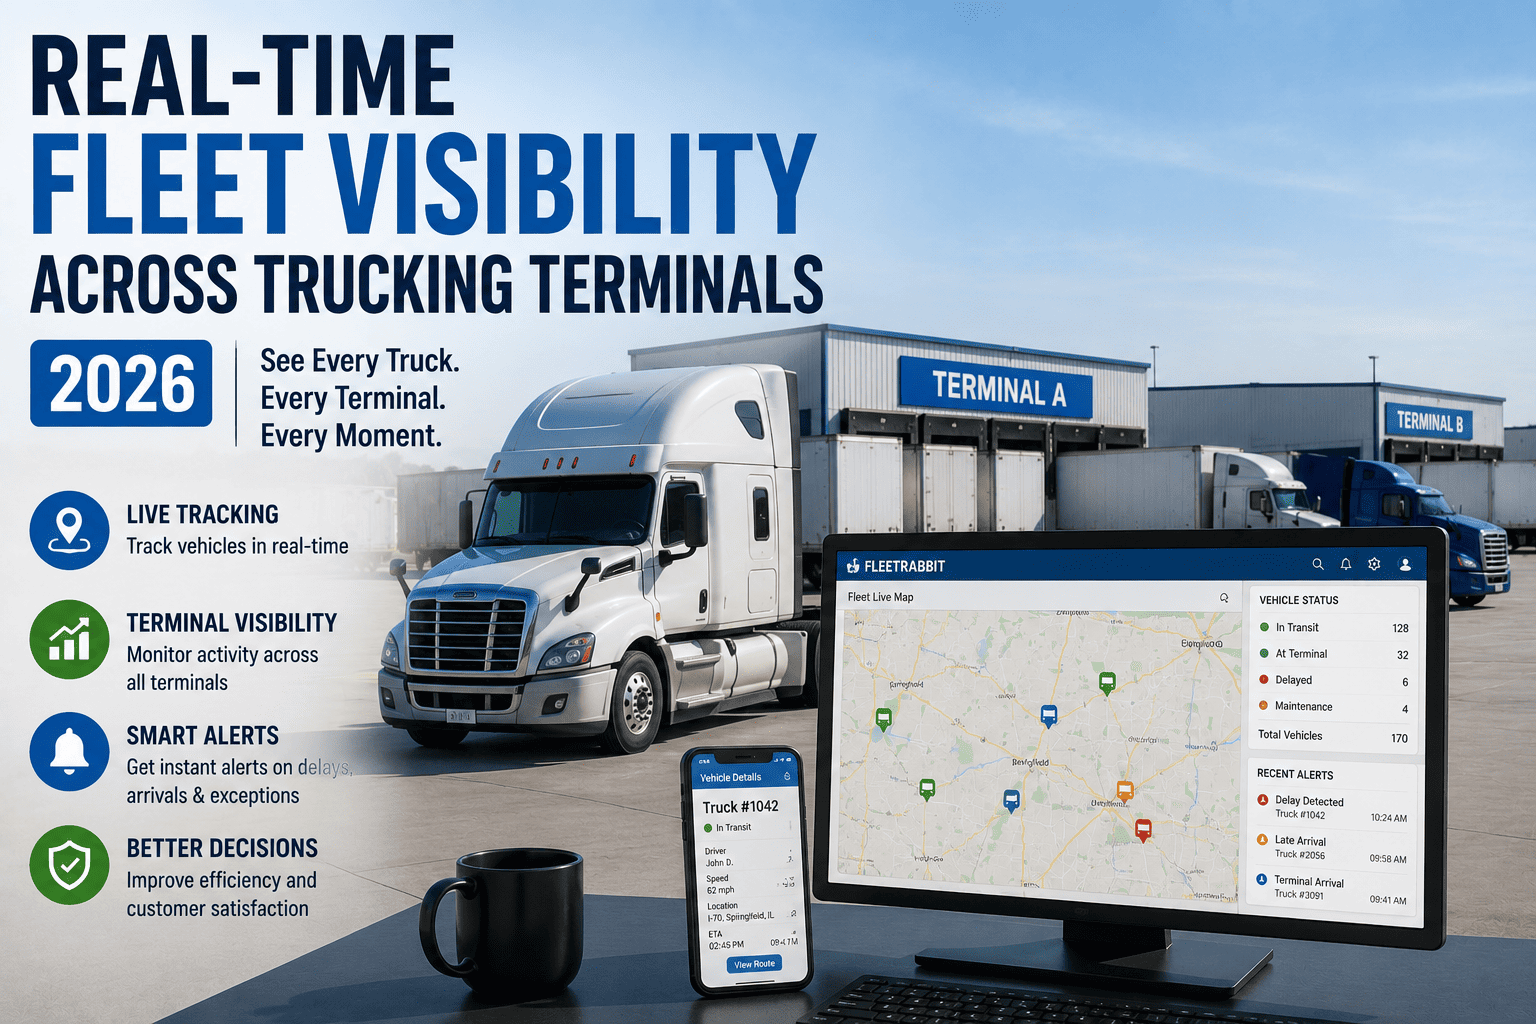
Ask a dispatcher at a single-terminal operation where a truck is right now, and they can usually tell you in seconds. Ask the same question about a fleet spread across three or four terminals, and the answer often turns into a round of phone calls. Multi-terminal trucking operations lose real-time awareness the moment vehicles, drivers, and freight start moving across regions, because the data each terminal generates rarely reaches anyone outside its own four walls. In 2026, that blind spot is directly costing fleets money, since eight out of ten fleet professionals now run GPS fleet tracking and the operations still relying on phone calls and spreadsheets are visibly falling behind on dispatch speed, customer service, and cost control.
Fleets gain real-time visibility across terminals by connecting GPS tracking, HOS data, DVIR completion, fuel, and maintenance status into one unified dashboard instead of separate terminal-level systems. Fleets running modern telematics report 30 to 40 percent efficiency improvements and 12 percent reductions in fuel and labor costs, with most operations reaching full ROI within 60 to 90 days of a structured rollout.
Why Multi-Terminal Fleets Lose Visibility First
A single-terminal operation can survive on tribal knowledge. Everyone works out of the same yard, sees the same trucks, and hears the same radio chatter. That model breaks down the moment a fleet adds a second or third terminal, because each location tends to build its own habits, its own spreadsheet, and its own version of "where things stand." The result is not a lack of data. Most fleets have plenty of data. The problem is that it lives in disconnected silos that nobody at headquarters can see all at once.
What Real-Time Visibility Actually Changes
Real-time visibility is not just a live map with dots on it. It is the ability to connect GPS location, hours of service, inspection status, fuel data, and maintenance alerts into one continuously updating picture that every terminal and every role can see. Fleets that implement this properly report 30 to 40 percent efficiency improvements, 12 percent reductions in fuel and labor costs, 19 percent lower accident costs, and 15 percent lower maintenance spend. For a 50-truck operation, those gains commonly translate into 750,000 to 1.2 million dollars in annual savings, with most fleets recovering their technology investment inside 12 months.
From Reactive to Proactive Dispatch
When a dispatcher can see every available truck across every terminal on one live map, assigning the nearest vehicle to an urgent load takes seconds instead of a round of phone calls. This shift alone commonly cuts response times from hours to minutes and turns dispatch from a reactive scramble into a proactive, data-driven decision.
Why proximity-based dispatch matters at scale
A dispatcher working from memory can name the trucks near one terminal, but not across four. A unified dashboard removes that limitation entirely, so every dispatch decision is based on real position data rather than which terminal happens to answer the phone first.
FleetRabbit unifies GPS, HOS, DVIR, fuel, and maintenance data from every terminal into a single live dashboard, updating within minutes of every change. Start your free trial and see your whole fleet on one screen today.
The KPIs That Belong On Every Terminal Dashboard
Not every metric deserves equal attention. High-impact fleet operations track a focused set of KPIs that reveal costs, safety outcomes, and compliance status at the same time, across every terminal, on the same dashboard.
| KPI | What It Tracks | Why It Matters Across Terminals |
|---|---|---|
| Live HOS Availability | Hours of service remaining per driver | Prevents violations and enables cross-terminal load reassignment |
| DVIR Completion Rate | Pre-trip and post-trip inspections completed | Flags terminals dispatching vehicles without a completed inspection |
| Fuel Efficiency Variance | Per-vehicle and per-route fuel use versus baseline | Identifies idle time, route inefficiency, or fuel theft by location |
| Vehicle Status | In transit, idle, in maintenance, out of service | Gives dispatch an instant view of available capacity fleet-wide |
| Open Work Orders | Maintenance tickets by status and age | Surfaces recurring failure patterns before they spread across terminals |
Dashboards Built For Different Roles
Not everyone in a multi-terminal operation needs the same view. A dashboard that shows everything to everyone quickly becomes noise nobody uses. The fleets getting real value from real-time visibility configure dashboards around the decisions each role actually makes.
The Fleet Manager Command Center
This is the shift-starting view: current vehicle status across every terminal, live HOS windows for all active drivers, today's pending DVIRs, and any alerts requiring immediate action, all on one screen instead of four separate terminal reports.
The Maintenance Supervisor View
Preventive maintenance adherence, upcoming service dates sorted by urgency, open work orders by age, and recurring failure patterns across terminals let maintenance teams catch problems before they become breakdowns anywhere in the network.
The Executive View
Financial KPIs, safety rating summaries, and quarter-over-quarter performance benchmarked against prior periods give leadership the ability to see which terminal is improving and which one needs investment, without digging through operational detail.
Why role-based views prevent alert fatigue
When every user sees only the metrics tied to their decisions, alerts stay meaningful instead of becoming background noise. Configurable thresholds for HOS limits, compliance expirations, fuel anomalies, and overdue maintenance route to the right person, with escalation logic if the first alert goes unacknowledged.
How FleetRabbit Connects Every Terminal
FleetRabbit's dashboard pulls GPS and telematics data, ELD-based HOS monitoring, fuel card transactions, DVIR and maintenance records, and compliance documentation from every terminal into a single unified view, updating with a maximum latency of five minutes. Fleet managers get a complete operations view, maintenance supervisors see PM schedules and work order queues, and executives see financial KPIs and safety summaries, all from the same underlying data instead of separate systems that never talk to each other. If a DOT audit notice arrives, complete documentation packages generate in seconds for any terminal, any vehicle, any date range. To see how a unified dashboard would look across your own terminals, you can book a free demo with the FleetRabbit team.
Frequently Asked Questions
Terminals will always operate in different cities, on different schedules, with different crews. The fleets pulling ahead in 2026 are the ones that stopped letting terminals operate on different information too. When every dispatcher, maintenance supervisor, and executive is working from the same real-time picture, decisions get faster, dispatch gets sharper, and the whole network starts performing like one fleet instead of several disconnected ones.
FleetRabbit connects every terminal into a single real-time dashboard covering GPS, HOS, DVIRs, fuel, and maintenance, so nothing gets lost between locations. Start your free trial with no credit card required, or book a short demo to see multi-terminal visibility in action.







