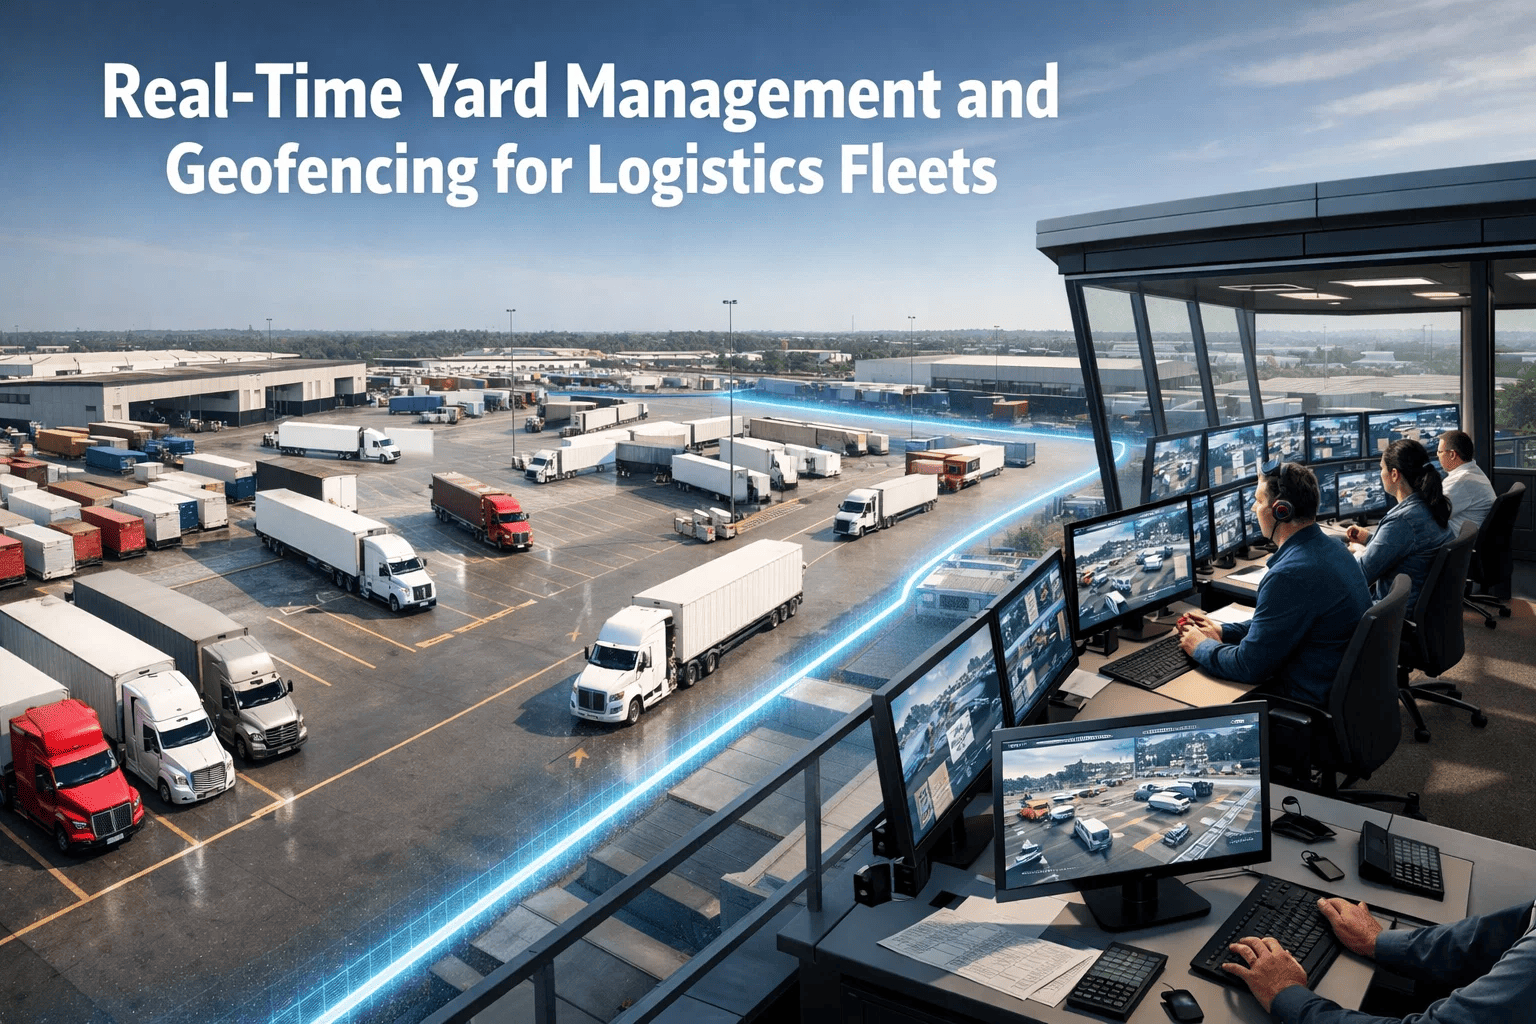
Logistics terminal yards are among the most data-rich operating environments in commercial transportation — and among the most poorly instrumented. At any moment in a functioning distribution terminal, dozens of tractors, trailers, and yard trucks are moving between dock doors, staging lanes, fueling positions, inspection bays, and holding lots in a choreography that determines whether loads depart on time, drivers wait needlessly for equipment, shippers receive their freight on schedule, and operations managers have the visibility needed to manage the yard to peak efficiency. When that choreography lacks real-time data — when the operations team is navigating yard status from memory, radio calls, and walk-the-lot observation — asset utilization drops, dwell times extend, detention obligations accumulate, and the yard becomes the inefficiency that the sophisticated route optimization and load planning systems upstream of it cannot compensate for. This operational guide addresses how real-time yard management, combined with GPS geofencing technology, transforms logistics terminal operations from a managed chaos environment into a structured, data-driven operational function — and how FleetRabbit provides logistics fleet managers and terminal operations executives with the visibility, alerting, and reporting infrastructure required to achieve and sustain those operational improvements at scale. Book a demo to see how FleetRabbit's geofencing and yard management capabilities work in logistics terminal operations.
38 min
average reduction in truck turn time at terminals using real-time geofencing versus manual yard management
23%
reduction in detention pay obligations at facilities with automated arrival and departure timestamp systems
$180K
estimated annual detention cost reduction for a 50-door terminal operating without automated dwell time tracking
15%
improvement in trailer utilization rate when real-time yard visibility replaces periodic manual yard checks
What This Guide Covers
The operational cost drivers of poor yard visibility in logistics terminals
How geofencing works technically and what precision is achievable in yard environments
Yard zone configuration strategies for different terminal layouts
Automated arrival and departure monitoring with driver and dispatcher notification
Dwell time analytics for carrier accountability and customer SLA management
Security applications of geofencing for unauthorized movement detection
How FleetRabbit delivers multi-yard visibility for 3PL and multi-terminal operators
KPI framework for yard management performance reporting to operations executives
The Operational Cost Drivers of Poor Yard Visibility
Logistics terminal managers who have never operated with real-time yard visibility often believe that their teams have adequate situational awareness of yard status — until they deploy geofencing and discover the magnitude of the gap between perceived and actual knowledge of where assets are, when they arrived, how long they have been stationary, and which dock positions and staging lanes are occupied. The discovery is consistently revelatory: dwell times are longer than believed, trailer utilization is lower than reported, detention obligations are accumulating without documentation, and yard truck moves are being made reactively to fill gaps rather than proactively to optimize throughput.
The operational cost of poor yard visibility concentrates in four categories that are individually significant and cumulatively substantial for any terminal processing more than 100 truck movements per day. First, extended dwell time for inbound loads — when drivers arrive and wait for dock assignment because the operations team lacks real-time dock availability information — generates detention obligations and driver HOS consumption that reduces available driving hours for outbound loads. Second, trailer hunting — the practice of dispatching a driver to retrieve a specific trailer whose location has not been tracked precisely enough to know which slot it occupies — generates idle time, fuel cost, and driver frustration that adds 15 to 30 minutes to what should be a 5-minute equipment pull. Third, undetected unauthorized movement of tractors or trailers — equipment leaving the yard without dispatch authorization during the inevitable gaps in manual monitoring — creates both security exposure and operational uncertainty about asset location. Fourth, detention billing disputes — situations where the carrier believes detention time began at one moment and the shipper or receiver disputes the arrival timestamp — are resolved more quickly and favorably for carriers with automated, system-generated timestamped arrival records than for those relying on driver-reported or manually recorded entry times.
Extended Dwell Time
Drivers waiting for dock assignment without real-time dock management consume HOS hours that reduce available driving time for outbound loads. At 45 minutes average unnecessary dwell per inbound load and $75 per hour in driver cost allocation, a 100-door terminal processing 200 daily arrivals generates $1,125 per day in avoidable detention cost.
Target: Reduce average dwell by 40%
Trailer Hunting Labor
Yard truck staff spending 20 to 30 minutes per equipment pull locating trailers whose positions are not tracked in real time generate labor waste that compounds across a full operating day. A yard with 10 pulls per hour generating 15 minutes of average search time per pull wastes 1,600 yard truck hours annually at a medium-size terminal.
Target: Eliminate trailer search time
Unauthorized Asset Movement
Tractors and trailers that leave the yard without dispatch authorization — through driver error, contractor misidentification, or deliberate theft — create asset recovery costs, load disruption, and insurance claim events that far exceed the cost of the geofencing system that would have detected the movement immediately.
Target: Real-time unauthorized exit alerts
Detention Billing Gaps
Without automated arrival timestamps from a geofencing system, carriers in detention billing disputes must rely on driver-reported entry times against shipper or receiver records — a dispute that frequently settles in the customer's favor due to the carrier's inability to produce objective, system-generated arrival documentation.
Target: Automated timestamped arrival records
How Geofencing Works in Logistics Terminal Environments
Geofencing is the technology of defining virtual boundaries around physical geographic areas and using GPS position data from vehicles within those boundaries to trigger automated events — alerts, status changes, timestamp records, and workflow notifications — when vehicles enter, exit, or dwell within defined zones. For logistics terminals, geofencing provides the data foundation for real-time yard management by converting the movement of every GPS-equipped tractor and trailer in the yard into a continuous stream of positional events that the fleet management system can interpret and act upon without requiring manual observation or reporting.
The practical precision of GPS geofencing in logistics terminal environments is a common concern among operations managers evaluating the technology. Modern GPS receivers with augmentation achieve positional accuracy of 1 to 3 meters under open-sky conditions, which is sufficient to distinguish between adjacent dock doors at most standard terminal dock spacings. In enclosed yard environments with limited sky view — areas inside large distribution buildings, under overhead structures, or adjacent to tall warehouse walls — GPS accuracy degrades to 5 to 15 meters, which remains sufficient for zone-level yard position tracking but not for individual dock door identification. FleetRabbit's geofencing configuration supports zone-level and door-level precision settings appropriate to the GPS environment of each terminal area.
Geofence Zone Configuration Framework for Logistics Terminals
Terminal Perimeter Zone
Triggers: Entry and Exit Events
Primary zone encompasses the full terminal property boundary. Every tractor and trailer entry generates an automated arrival timestamp record. Every exit generates a departure record. These records form the objective evidence base for detention billing and unauthorized exit detection.
Check-In and Guard Gate Zone
Triggers: Check-In Queue Dwell Alert
Zone around the inbound check-in area detects when arriving drivers have queued and how long they wait before check-in processing completes. Extended queue dwell triggers alerts to operations staff that check-in capacity may be constraining throughput. Average queue dwell time is a KPI for gate operations efficiency.
Dock Door Zones
Triggers: Dock Assignment, Unloading Duration
Individual or grouped dock door zones at terminals with adequate GPS precision track which dock positions are occupied and for how long. Loading and unloading duration KPIs are generated automatically from dock zone dwell time without requiring manual dock sheet recording. Alerts fire when a dock zone dwell exceeds the configured maximum unload duration.
Staging and Drop Lot Zones
Triggers: Trailer Position Record, Drop Duration
Staging area and drop trailer lot zones provide real-time visibility into where trailers are sitting, how long they have been stationary, and which positions are available for new drops. Staging zone tracking eliminates trailer hunting and enables dispatcher assignment of specific positions to inbound drivers before or during approach.
Fueling Zone
Triggers: Fueling Duration, Queue Length
Fueling area zone tracks vehicle entry and exit to estimate fueling duration and detect queue buildup that may indicate fueling equipment issues or capacity constraints. Extended fueling events trigger alerts to operations staff before the queue creates a broader yard throughput bottleneck.
Inspection and Maintenance Zone
Triggers: Vehicle Assignment, Duration Tracking
Inspection bay zone entries are automatically correlated with FleetRabbit's DVIR and PM work order records, enabling automatic cross-referencing of vehicle arrivals at the inspection bay with outstanding defect records and PM due notifications for the same vehicle without dispatcher manual coordination.
Automated Arrival and Departure Monitoring
The most immediately valuable capability that geofencing delivers to logistics terminal operations is the elimination of manual arrival and departure recording as the source of the timestamp record that drives detention billing, driver HOS tracking, and carrier-customer SLA accountability. Manual recording — whether by gate staff writing on paper, drivers self-reporting via phone or app, or dispatchers querying drivers by radio — introduces both accuracy risk and dispute risk into every transaction that depends on an accurate arrival time. Geofencing-generated timestamps from FleetRabbit are objective, system-generated, and not dependent on any human reporting step whose accuracy might be questioned in a billing dispute or compliance inquiry.
01
Geofence Entry Detection
FleetRabbit detects GPS position crossing the configured terminal perimeter geofence boundary and records the exact timestamp, vehicle ID, and driver assignment at the moment of entry. No driver action required.
02
Automatic Stakeholder Notification
Within seconds of geofence entry, FleetRabbit sends configurable notifications to the receiving dock supervisor, dispatcher, and customer portal indicating that the load has arrived at the facility — along with the shipment identifier, driver name, and arrival time.
03
Dock Assignment and Zone Tracking
As the vehicle moves from the entry zone to the dock zone, FleetRabbit tracks the zone transitions and records dock arrival time separately from terminal entry time. Detention billing start time, check-in queue time, and dock wait time are all captured as distinct, documented intervals.
04
Dwell Time Monitoring and Alerts
FleetRabbit monitors how long the vehicle has been in each zone and fires configurable dwell time alerts when configured thresholds are exceeded. A trailer sitting in a dock zone for more than the configured unloading window triggers an alert to the dock manager before the situation becomes a throughput bottleneck.
05
Departure Timestamp and Trip Record Close
When the vehicle exits the terminal perimeter geofence, FleetRabbit records the departure timestamp and calculates total terminal dwell time as the interval between entry and exit timestamps. This calculation is applied to detention billing records, driver HOS accounting, and terminal throughput KPI reporting.
Security Applications of Geofencing in Logistics Operations
Cargo theft from logistics terminals and truck yards is a persistent and growing problem for the transportation industry. According to industry insurance data, cargo theft claims increase markedly when sophisticated organized theft rings target high-value freight at staging lots and distribution facilities — with tractors and trailers moved without authorization, freight transferred to non-carrier vehicles, and valuable loads disappearing during the periods of lowest active monitoring, typically overnight and on weekends. Geofencing does not prevent determined theft, but it dramatically reduces the window between unauthorized asset movement and detection — and time-to-detection is the primary variable that determines whether stolen cargo can be recovered before it disappears into the distribution chain.
Unauthorized Exit Alert
Real-Time
When a tractor or trailer exits the terminal geofence during hours when no authorized departure is dispatched in FleetRabbit, the system generates an immediate alert to terminal security and operations management — enabling response within minutes of the unauthorized movement rather than hours later when the vehicle and load are beyond recovery range.
After-Hours Movement Detection
Configurable Windows
FleetRabbit supports configurable authorized movement windows by terminal location. Any vehicle movement detected within the terminal perimeter zone outside the authorized window triggers an alert regardless of whether the vehicle exits the terminal — detecting unauthorized trailer repositioning or tractor movement within the yard before cargo transfer occurs.
Route Deviation Detection
Continuous Monitoring
For high-value loads that have departed the terminal, FleetRabbit's route monitoring compares actual GPS track against the planned route and generates deviation alerts when the vehicle departs from the expected route corridor — enabling early detection of driver diversion events or unauthorized stop patterns that may indicate an internal theft collaboration.
Trailer Status History
Auditable Record
FleetRabbit maintains a complete timestamped movement history for every trailer registered in the fleet — every zone entry, exit, and dwell event. In the event of a cargo theft claim, this history provides law enforcement with an objective timeline of the trailer's location and movement sequence that substantially improves investigation efficiency and insurance claim resolution speed.
Deploy FleetRabbit Geofencing Across Your Terminal Network
FleetRabbit's geofencing and yard management capabilities require no new hardware beyond the GPS telematics already installed on your tractors and trailers. Configuration of terminal zones takes hours, not weeks, and real-time visibility begins from the moment the first vehicle enters the configured geofence boundary.
How FleetRabbit Delivers Multi-Yard Visibility for 3PL and Multi-Terminal Operators
Third-party logistics providers and large transportation companies operating multiple terminal locations face a yard visibility challenge that single-terminal operators do not encounter: the need for coordinated situational awareness across a network of facilities simultaneously, with fleet assets constantly moving between locations and the operational decisions at any one terminal affecting load planning, driver scheduling, and equipment availability across the network. Without centralized multi-terminal yard visibility, operations leadership at the network level is managing by exception reports and phone calls from terminal managers — a reactive posture that by definition cannot prevent problems, only respond to them after the fact.
FleetRabbit's multi-site architecture provides 3PL operators and network transportation companies with a consolidated dashboard showing real-time yard status, asset position, and dwell time KPIs across all configured terminal locations from a single management interface. A VP of Operations can see in one view which terminals have excessive dock zone dwell times, which staging lots are approaching capacity, which tractors have been stationary in a staging area for more than the configured maximum, and which terminals have active unauthorized exit alerts — without requiring individual site logins or coordination calls with terminal managers for situational awareness.
Network Asset Map
Real-time map view showing the geographic position of all tractors and trailers across all terminal geofenced areas — color-coded by asset status (at dock, in staging, in transit, idle) and dwell duration (within threshold, approaching threshold, exceeding threshold).
Terminal Throughput Comparison
Side-by-side KPI comparison across terminal locations showing average truck turn time, dock utilization rate, detention event frequency, and unauthorized exit alert count — enabling network-level identification of terminals performing below benchmark.
Active Alert Feed
Consolidated feed of all active geofence alerts across the terminal network — dwell time exceedances, unauthorized movements, dock capacity approaching maximum, check-in queue buildup — filterable by location, alert type, and severity.
Detention Liability Summary
Real-time accumulation view showing detention billing obligations actively accruing across all terminal locations — with driver name, carrier, load reference, and current dwell duration for each active detention event — enabling operations management to intervene before detention obligations reach costly thresholds.
Trailer Utilization by Location
Trailer pool utilization rate by terminal — showing the ratio of trailers actively in use versus sitting in staging or drop lots beyond the configured maximum drop duration. Identifies equipment pooling imbalances across the network that can be corrected through targeted repositioning decisions before they create load coverage gaps.
Dwell Time Analytics for Carrier Accountability and Customer SLA Management
Dwell time — the elapsed time a commercial vehicle spends at a specific location from arrival to departure — is the central metric of yard management efficiency and the primary source of the carrier-customer tensions that arise when loading and unloading operations extend beyond contracted or expected durations. For carriers, excessive dwell time at customer facilities represents a direct cost in driver HOS consumption, detention pay obligations, and reduced asset utilization. For shippers and receivers, excessive carrier dwell time at facilities indicates dock efficiency problems, appointment scheduling failures, or freight volume mismatches that create throughput constraints. For 3PL operators managing carrier relationships on behalf of shippers, dwell time data is the evidentiary foundation for carrier accountability conversations, SLA compliance reporting, and rate structure negotiations that reflect the actual time cost of each carrier's yard performance.
Dwell Time Component Analysis with FleetRabbit
Entry to Check-In
Gate Queue Duration
Time from terminal perimeter entry to check-in zone exit. Benchmarks gate operations efficiency independent of dock operations. Alerts when queue exceeds configured maximum — typically 15 minutes for well-managed operations.
Check-In to Dock Arrival
Dock Wait Duration
Time from check-in zone exit to dock door zone entry. Measures the delay between driver check-in completion and dock door assignment — identifying dock assignment process inefficiencies or dock availability constraints separately from actual loading or unloading duration.
Dock Arrival to Dock Departure
Active Loading or Unloading Duration
Time the vehicle spends at the dock door zone — the actual loading or unloading cycle time. This is the interval most directly attributable to freight volume, dock crew efficiency, and equipment availability. Alerts when dock zone dwell exceeds the appointment window contracted duration.
Dock Departure to Terminal Exit
Post-Load Dwell Duration
Time from dock zone departure to terminal perimeter exit. Includes paperwork completion, seal application, yard truck move assistance, fueling, and any secondary inspection requirements. Elevated post-load dwell times indicate administrative or operational process friction that can be addressed with targeted procedure improvements.
Implementing Geofencing: Configuration Steps for Logistics Terminal Managers
Terminal operations managers approaching their first geofencing deployment frequently encounter the same concern: that configuring geofence zones for a complex logistics facility will require significant technical expertise and extended setup time that disrupts ongoing operations. In practice, FleetRabbit's geofencing configuration is a map-based process that does not require IT involvement, can be completed by an operations manager working from a satellite imagery view of the terminal, and produces initial working alert capability within hours of the first zone being drawn. The following implementation framework reflects the sequence used by FleetRabbit customers in their logistics terminal deployments.
01
Map the Terminal Operating Zones
Before drawing geofences in FleetRabbit, document the operational zones you need to track — terminal perimeter, gate area, dock zones, staging lots, fueling area, inspection bay. Identify which zones require individual-position precision versus zone-level tracking and configure GPS accuracy expectations accordingly.
02
Configure Terminal Perimeter First
Begin with the terminal perimeter geofence — the zone that will generate arrival and departure timestamps for every vehicle. This single configuration immediately enables automated timestamp-based detention documentation and unauthorized exit detection, producing the highest-value immediate return before any internal zone configuration is complete.
03
Configure Alert Thresholds by Zone Type
For each zone type, configure the dwell time threshold that triggers an alert. Dock zones typically use the appointment slot duration plus a configured grace period. Staging lot zones use the maximum drop trailer duration. Gate queue zones use the target check-in processing time. These thresholds should be set based on current performance benchmarks, not aspirational targets, to ensure alerts are actionable rather than constant.
04
Assign Alert Routing to Appropriate Staff
Configure each alert type to route to the staff member with the authority and operational responsibility to act on it. Dock zone dwell alerts route to the dock supervisor. Unauthorized exit alerts route to terminal security and the operations manager. Network-wide alerts route to the VP of Operations dashboard. Alert routing that reaches the wrong recipient is received as noise and eventually ignored.
05
Calibrate Thresholds Against First 30 Days of Data
After the first 30 days of geofencing operation, review the alert frequency by zone and threshold. Zones generating alerts more than 30% of the time indicate that the threshold is set below actual operational performance — creating alert fatigue rather than actionable notification. Recalibrate thresholds to reflect realistic performance improvement targets based on the actual data rather than initial assumptions.
Performance KPIs for Yard Management Reporting to Operations Executives
VP of Operations and logistics leadership stakeholders who have invested in geofencing and yard management infrastructure need a reporting framework that converts raw GPS data into the performance indicators that drive operational decisions and investor or customer-facing reporting. The following KPI set reflects the metrics most consistently tracked by FleetRabbit logistics customers in their yard management reporting programs.
| KPI |
Definition |
Industry Benchmark |
FleetRabbit Data Source |
| Average Truck Turn Time |
Mean terminal dwell from perimeter entry to perimeter exit across all arrivals in reporting period |
Under 90 minutes for regional distribution; under 3 hours for cross-dock facilities |
Geofence entry and exit timestamp differential by terminal per period |
| Dock Utilization Rate |
Percentage of available dock-hours during operating window occupied by active loading or unloading activity |
Target 75% to 85% — below 65% indicates scheduling inefficiency, above 90% indicates capacity constraint |
Dock zone occupied-time versus total operating window from geofence dwell data |
| Detention Events per Day |
Number of arrivals per day where terminal dwell time exceeds the contracted loading or unloading window |
Target below 8% of daily arrivals generating detention obligations — high performers below 4% |
Dwell time comparison against appointment window configuration per load record |
| Unauthorized Exit Events |
Count of geofence exit alerts generated outside authorized dispatch windows or for unauthorized vehicles in the reporting period |
Target zero — any unauthorized exit event requires immediate investigation and documentation |
Geofence exit alert log filtered for events outside authorized departure windows |
| Trailer Utilization Rate |
Percentage of trailer fleet in active service (loaded, in transit, or at dock) versus sitting empty in staging or drop lots |
Target above 70% active utilization — below 55% indicates equipment pool imbalance or excessive staging dwell |
Trailer position zone classification (active versus staging) from geofence tracking across fleet |
| Gate Queue Average Duration |
Mean time spent by arriving vehicles in the gate zone before transitioning to dock or staging zones |
Target under 15 minutes for pre-scheduled appointments; under 25 minutes for walk-in arrivals |
Gate zone dwell time from geofence data, filterable by arrival type and time of day |
Frequently Asked Questions: Yard Management and Geofencing for Logistics Operations
Does FleetRabbit's geofencing require hardware installation at the terminal facility, or does it work with existing vehicle GPS systems?
FleetRabbit's geofencing operates entirely from the GPS telematics already installed on vehicles — tractors and trailers equipped with FleetRabbit-compatible GPS devices provide the position data that triggers geofence events without any infrastructure installation at the terminal. The geofence zones are defined in FleetRabbit's cloud-based management interface using a map drawing tool, and the system beginning generating events from those zones immediately for any vehicle that enters the defined boundary. For terminals operating with vehicles that are not yet equipped with GPS telematics, FleetRabbit supports multiple telematics hardware partners for new equipment installation.
How does FleetRabbit handle geofencing for terminals where GPS accuracy is reduced by overhead structures or building proximity?
For terminal areas with reduced GPS accuracy due to overhead structures, large building walls, or covered dock configurations, FleetRabbit's zone configuration supports a buffer distance setting that accounts for positional uncertainty. By configuring a zone boundary buffer that is larger than the expected GPS accuracy degradation in that zone, the system maintains reliable zone transition detection even in environments where pinpoint accuracy is not achievable. For dock-level precision in covered environments, supplementary technologies such as Bluetooth low-energy beacons or Wi-Fi positioning can be integrated as an accuracy enhancement in specific terminal areas where standard GPS is insufficient for the required precision level.
Can FleetRabbit generate detention billing support documentation directly from geofence timestamps for carrier-customer disputes?
Yes. FleetRabbit generates dwell time reports showing the geofence-recorded arrival timestamp, dock zone entry timestamp, dock zone exit timestamp, and terminal departure timestamp for any specific vehicle and visit. These reports are generated from system-recorded GPS data rather than driver-reported or manually recorded information, providing objective, timestamped documentation for detention billing disputes. Many FleetRabbit logistics customers have reported successful detention claim resolution using these reports in situations where the carrier's prior documentation — which relied on driver self-reporting — had insufficient credibility to overcome shipper objections.
How does FleetRabbit's yard management visibility integrate with load planning and dispatch systems?
FleetRabbit's geofencing and yard tracking data is available through the platform's API for integration with transportation management systems and load planning tools. When yard status data — including which trailers are available at which staging positions and which dock doors are occupied — is visible to the dispatch system, load planners can make assignment decisions based on current yard reality rather than planned status. This integration also enables automated load assignment workflows triggered by geofence arrival events, where a confirmed arrival at the terminal can automatically trigger a load record status update without dispatcher manual intervention.
What is the typical timeframe to see measurable yard efficiency improvements after FleetRabbit geofencing deployment?
FleetRabbit logistics customers consistently report measurable yard efficiency improvements within the first 30 to 45 days of geofencing deployment — primarily driven by the behavioral change among dock supervisors and dispatchers who now have visible dwell time data that was previously invisible. The most rapid improvements occur in dock zone assignment efficiency, where the visibility of which doors are occupied allows more assertive dock management decisions. Deeper improvements in trailer utilization and detention frequency typically emerge over the 60 to 90 day horizon as the operations team develops the organizational habits to act consistently on the newly available data.
Real-Time Yard Visibility Is the Most Scalable Logistics Efficiency Investment Available
Every inefficiency that accumulates in a logistics terminal — extended dwell times, trailer hunting, unofficial yard movements, detention billing disputes, dock utilization gaps — exists in the absence of accurate, real-time information about where assets are and how long they have been there. FleetRabbit's geofencing and yard management capabilities resolve that information gap at the scale of a single terminal or a network of dozens, using the GPS telematics already installed on your fleet — without new infrastructure, without new hardware, and without extended implementation timelines that delay the operational improvements you need now.
Yard Management
Geofencing Technology
Detention Billing
Trailer Utilization
Multi-Terminal Visibility
3PL Operations
April 18, 2026
By Jason Smith
All Posts