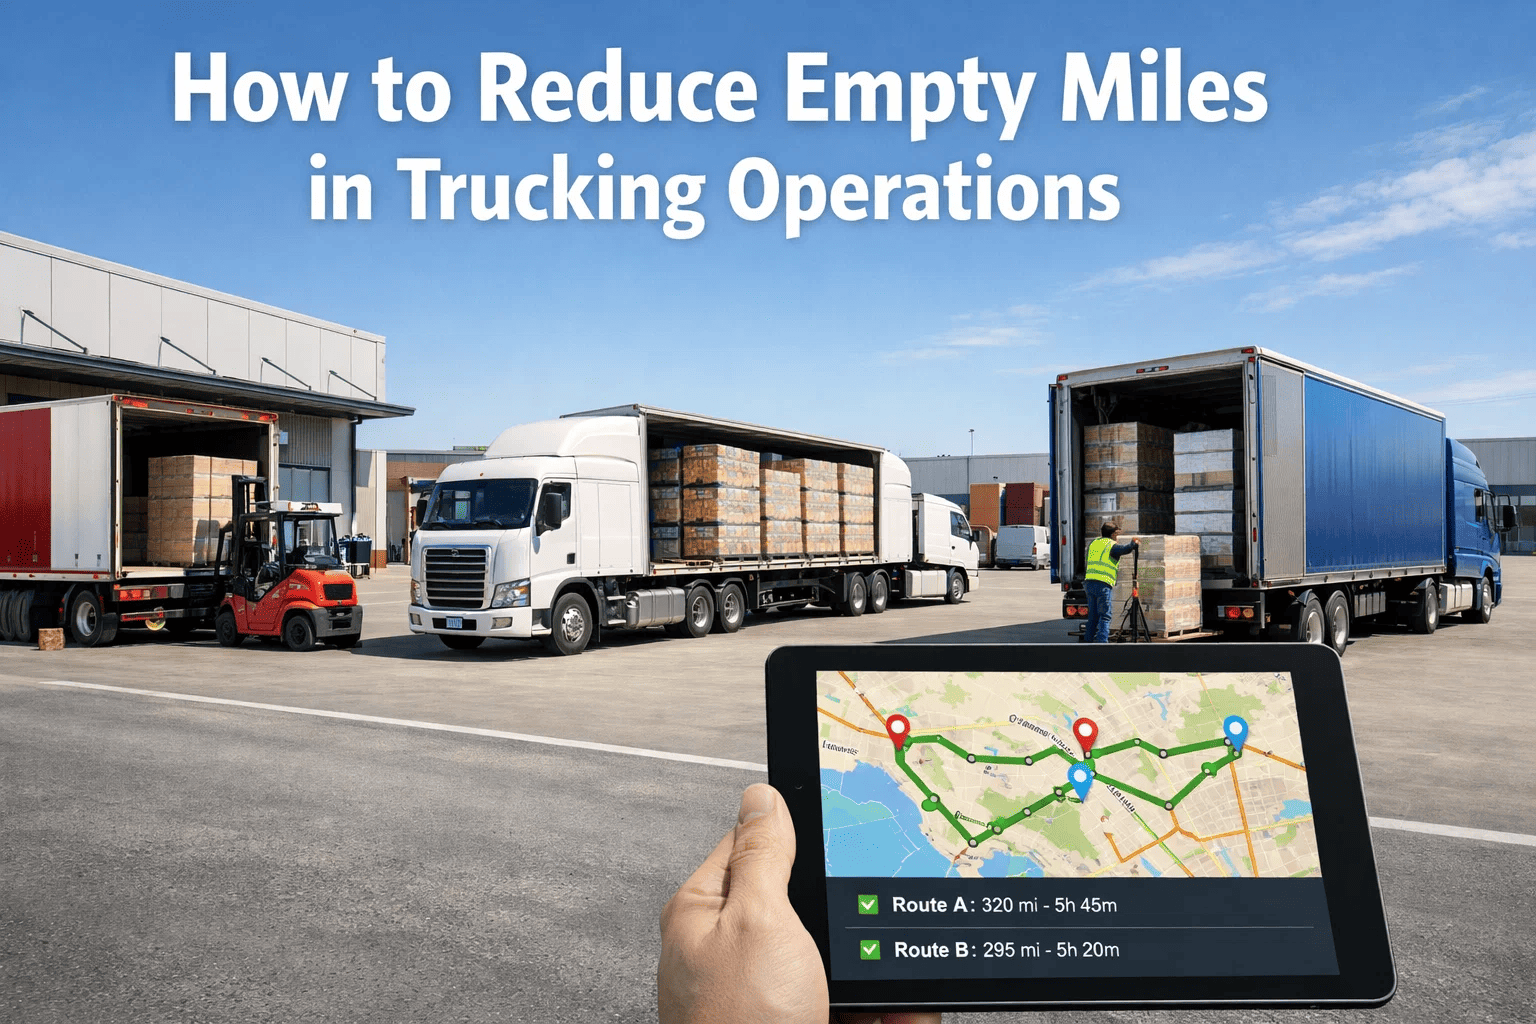
Empty miles — truck movements without revenue-generating freight — represent one of the most significant and persistent sources of operational waste in trucking. For the average truckload carrier, empty miles account for 28 to 35 percent of total vehicle miles traveled. At a fully loaded cost of operation between $1.80 and $2.40 per mile, every empty mile driven represents a direct drain on operating margin that does not generate corresponding revenue. At fleet scale, the aggregate financial impact of unoptimized empty miles frequently matches or exceeds the total annual maintenance budget. Book a demo to see how FleetRabbit's dispatch and analytics tools help carriers identify and systematically reduce empty miles across their network.
Reducing empty miles in trucking operations requires addressing three simultaneous challenges: improving backhaul load procurement, optimizing dispatch intelligence to match available vehicles with nearby freight opportunities, and using real-time data to reduce repositioning mileage between loads. This guide explains the operational mechanics behind empty mile generation, defines the categories of empty miles that are controllable versus inherent in the carrier's business model, and details how FleetRabbit's dispatch, analytics, and route optimization capabilities support systematic empty mile reduction programs for carriers of all sizes.
Understanding Where Empty Miles Actually Come From
Before a carrier can reduce empty miles, their management team needs an accurate understanding of where empty miles are generated within their specific operation. Empty miles are not a single operational phenomenon — they are the aggregate result of multiple distinct operational categories, each with different root causes and different mitigation strategies. Treating all empty miles as a single problem leads to misallocated improvement efforts that address high-visibility causes while leaving structural sources of empty mileage unaddressed.
The four primary categories of empty miles in a typical truckload carrier operation are: deadhead miles between completed deliveries and new load pickup locations, repositioning miles required to rebalance fleet position across the carrier's service geography, bobtail miles driven by tractors separated from trailers for legitimate operational reasons, and terminal return miles driven at the end of shift runs that do not connect with a backhaul load. Each category has different economic characteristics, different data requirements for measurement, and different operational levers for reduction.
The Business Case: What Empty Mile Reduction Is Worth to Your Fleet
Quantifying the financial value of empty mile reduction is the essential first step that separates carriers who invest systematically in optimization from those who treat it as a general improvement objective without measurable targets. The calculation framework is straightforward but requires accurate baseline data that many carriers have not historically tracked with sufficient granularity.
Start with the carrier's current total annual miles traveled. Apply the current empty mile percentage to determine total annual empty miles. Multiply total empty miles by the carrier's fully loaded cost per mile (including driver pay, fuel, maintenance, insurance, depreciation, and overhead allocation). The resulting figure represents the annual cost of the current empty mile rate. Apply a conservative reduction target — a 20 percent improvement is achievable in most carrier operations without network restructuring — to calculate the annual savings opportunity. For a carrier operating 100 trucks at 120,000 miles per truck per year with a 30 percent empty rate and a $2.00 per mile loaded cost, a 20 percent improvement in empty miles represents approximately $1.44 million in annual savings. This figure, presented with accurate baseline data, provides the business case for technology investment and operational program commitment.
Strategy One: Backhaul Load Procurement and Network Design
The most impactful single strategy for reducing deadhead empty miles is improving backhaul load procurement — the process by which carriers identify, qualify, and accept freight loads for the return direction of completed deliveries. For carriers operating primarily in one freight direction (common in produce, building materials, and manufacturing freight markets), the backhaul lane presents a structural opportunity that is not fully exploited when dispatchers rely on manual broker relationships and traditional load board access to find returning freight.
Modern backhaul optimization requires a combination of lane analysis — understanding the freight density and rate environment at each delivery market — and dispatch intelligence that gives dispatchers visibility into vehicle positions, completion times, and nearby load board availability simultaneously. FleetRabbit's dispatch module integrates vehicle location and estimated delivery completion time into the dispatch interface, giving dispatchers the precise data they need to begin backhaul load search at the right moment — before the delivery is fully complete rather than after the driver has parked the truck and called in empty.
The timing dimension of backhaul procurement is critically underestimated. Dispatchers who initiate backhaul search after delivery confirmation add 45 to 120 minutes of deadhead time relative to dispatchers who initiate search one to two hours before anticipated delivery completion. At scale, this timing improvement alone reduces average deadhead mileage per load by 20 to 40 miles depending on the market geography. Book a demo to see how FleetRabbit's dispatch interface supports proactive backhaul management for your carrier operation.
Strategy Two: Smarter Dispatch Intelligence and Vehicle-Load Matching
Even when backhaul freight is available in a delivery market, carriers can generate unnecessary empty miles through suboptimal vehicle-to-load assignment decisions in the dispatch function. Dispatchers working with limited visibility into the positions, completion times, and HOS status of available trucks across the network frequently assign loads to vehicles that are not the geographically closest available unit — because the data required to make the optimal assignment decision is not available in a single interface at the moment the load opportunity must be accepted.
FleetRabbit's dispatch module provides dispatchers with a real-time view of available vehicles with their current GPS position, estimated time to availability (based on in-transit delivery progress), hours-of-service eligibility, and upcoming maintenance status. This consolidated view allows dispatchers to identify not just the nearest available driver, but the operationally optimal driver — considering HOS remaining hours, proximity, and vehicle maintenance schedule — for each load opportunity. The reduction in suboptimal vehicle-load assignments typically produces a 12 to 18 percent improvement in average deadhead miles per load within the first 60 days of deployment.
Strategy Three: Real-Time Tracking and Dynamic Route Adjustment
Empty miles are not only generated in the spaces between loads — they are also generated during loaded operations when route inefficiencies, unplanned detours, and poor traffic response decisions add unnecessary mileage to loaded and transition legs alike. GPS telematics integration with FleetRabbit provides dispatchers and route planners with real-time visibility into actual versus planned route execution, enabling dynamic intervention when vehicles are deviating from optimal paths in ways that increase total miles traveled.
The connection between route optimization and empty mile reduction is often underappreciated. A driver who extends their loaded delivery route by 40 miles due to traffic avoidance or personal inefficiency also extends the distance from their delivery point to the nearest backhaul pickup, increasing deadhead miles on the subsequent leg. Route adherence monitoring is therefore a direct input into empty mile reduction, not a separate operational objective. FleetRabbit's GPS integration surfaces route deviation events in real time, allowing dispatchers to communicate corrective guidance before the deviation compounds into significantly increased deadhead exposure on subsequent legs.
Dynamic route adjustment capabilities are also critical for managing load changes while vehicles are in transit — rerouting drivers to new pickup locations when freight plans change, coordinating relay points between drivers to keep loads moving without deadhead, and identifying opportunities to break a long deadhead run with an intermediate pickup that improves the overall economics of the assignment.
Strategy Four: Trailer Pool Management and Utilization Optimization
For carriers operating drop-and-hook networks, trailer pool management is a major driver of both empty miles and operational efficiency. Trailers parked at customer locations, shipper yards, or receiver facilities without active freight generate no revenue but require tractor movements to retrieve them, reload them, or reposition them to high-demand locations. Suboptimal trailer pool management forces dispatchers to move tractors without freight specifically to retrieve or reposition trailers — a category of empty miles that is entirely avoidable with better trailer location data and utilization analysis.
FleetRabbit's asset registry and GPS integration capabilities allow carriers to maintain real-time visibility into trailer location, dwell time, and utilization status across their entire trailer fleet. Trailers that have been stationary at a customer location for more than the contracted dwell period can be flagged automatically, allowing dispatchers to coordinate retrieval before detention charges accrue and schedule the retrieval movement alongside a nearby backhaul load rather than as a dedicated empty move. Trailer utilization analysis across the pool identifies which trailers are chronically underutilized — sitting at specific locations disproportionately — versus which trailers are cycling efficiently through the loading, transit, and unloading sequence.
Strategy Five: Driver Scheduling and Home-Time Cycle Optimization
For regional and local carriers where driver home time significantly influences routing decisions, the scheduling of driver return-to-domicile trips is a material source of empty miles. When driver home-time cycles are not coordinated with backhaul freight availability, drivers routinely complete deliveries in markets where backhaul is available but cannot be accepted due to driver hours limitations, home-time commitments, or scheduling conflicts with the next morning's dispatch assignment.
FleetRabbit's team management and HOS monitoring modules provide dispatchers with visibility into driver home-time schedules, remaining service hours, and planned next-day assignment requirements simultaneously. This three-variable visibility allows dispatch coordinators to identify situations where a driver's home-time trip can be converted from an empty terminal return into a partial backhaul that drops the driver at a relay point closer to home — converting a fully empty terminal return into a partially loaded run with an empty segment of 40 to 80 miles rather than 200 to 300 miles. At scale, this scheduling coordination discipline produces measurable reductions in the terminal return empty mile category.
Measure Your Empty Mile Rate and Calculate Reduction Potential with FleetRabbit
FleetRabbit's analytics module breaks down empty miles by category — deadhead, repositioning, bobtail, and terminal return — so your operations team can prioritize the highest-value reduction opportunities and measure progress against baseline. Book a demo to review your carrier's empty mile profile and reduction opportunity with the FleetRabbit team.
Strategy Six: Analytics-Driven Lane Analysis and Network Design
The most sophisticated empty mile reduction programs move beyond tactical dispatch optimization to systematic lane analysis and network design — using historical freight data to identify structural imbalances in the carrier's lane portfolio that generate chronic empty mile exposure. A carrier whose top revenue lanes all point toward the same geographic region will always face backhaul challenges on the return direction unless they make deliberate decisions about which freight they accept in the primary direction, what rate differential they require to justify accepting freight with poor backhaul characteristics, and how they structure their trailer pool to support efficient round-trip lane pairs rather than one-way freight patterns.
FleetRabbit's analytics and reporting module enables this type of structured lane analysis by providing drill-down views of loaded miles, empty miles, revenue per mile, and backhaul capture rate by lane pair, origin market, and destination market. Operations directors and fleet executives can use this data to make informed decisions about lane portfolio management — accepting or declining freight categories based on their empty mile implications for the subsequent leg, rather than making lane decisions based solely on rate revenue without accounting for the deadhead cost embedded in the allocation.
| Lane Pair | Loaded Miles | Avg Deadhead | Backhaul Capture | Net Revenue/Mile | Recommended Action |
|---|---|---|---|---|---|
| Chicago to Atlanta | 720 mi | 48 mi | 91% | $2.84 | Expand — strong backhaul market |
| Dallas to Denver | 920 mi | 187 mi | 62% | $2.11 | Optimize — improve backhaul search protocol |
| Los Angeles to Phoenix | 370 mi | 94 mi | 71% | $2.43 | Monitor — evaluate relay pair opportunity |
| Miami to Nashville | 860 mi | 312 mi | 34% | $1.68 | Re-evaluate — high deadhead, poor capture rate |
| Seattle to Portland | 180 mi | 22 mi | 88% | $3.12 | Expand — excellent backhaul structure |
The lane analysis table above illustrates the type of structured view FleetRabbit analytics provides when carriers use operational data to evaluate lane portfolio economics. The Miami-to-Nashville lane with a 34 percent backhaul capture rate and 312 miles of average deadhead presents a radically different economic profile than the Chicago-to-Atlanta lane at 91 percent capture — and this difference is only visible when the data is organized in a format that makes the comparison actionable.
Strategy Seven: Fuel Efficiency During Deadhead Operations
While the primary objective of empty mile reduction programs is to minimize the number of deadhead miles driven, a secondary performance dimension addresses the fuel cost per empty mile driven. Empty bobtail operations are significantly more fuel-efficient than loaded operations on a per-mile basis, but many carriers do not capitalize on this difference with appropriate speed and routing policies for deadhead legs. Drivers who maintain the same highway speed during empty operations as during loaded operations generate fuel consumption that is 15 to 20 percent higher than necessary for the empty movement, reducing the cost advantage of bobtail versus loaded fuel consumption.
FleetRabbit's fuel management integration allows carriers to analyze fuel consumption by loaded versus empty status, identifying drivers whose deadhead fuel consumption significantly exceeds the fleet average empty mile fuel efficiency. Targeted coaching and policy communication for those drivers — reducing highway speed during empty operations, avoiding unnecessary idling during deadhead layovers — typically produces 10 to 15 percent improvement in empty mile fuel efficiency within 60 days of program implementation. While this does not reduce the number of empty miles, it reduces the fuel cost component of each empty mile driven, improving the economics of unavoidable deadhead operations.
Measuring Empty Mile Reduction Progress with FleetRabbit Analytics
An empty mile reduction program without measurement infrastructure is operationally incomplete. Without robust metrics tracking, improvement efforts cannot be validated, successful strategies cannot be identified for replication, and underperforming tactics cannot be identified for revision. FleetRabbit's analytics module provides the measurement framework required to run a disciplined empty mile reduction program — tracking the metrics that matter, at the granularity level that enables operational decisions.
How FleetRabbit Supports Your Empty Mile Reduction Program
FleetRabbit provides the operational data infrastructure that empty mile reduction programs require. The platform is not a standalone route optimization engine — it is a comprehensive fleet management and analytics system that produces the vehicle status, driver availability, maintenance schedule, and fuel consumption data that dispatchers and operations managers need to make consistently better load assignment and backhaul procurement decisions. The empty mile reduction value of FleetRabbit is delivered through better operational visibility, more accurate and timely data at the dispatch decision point, and analytics that enable continuous measurement and improvement of the metrics that drive empty mile performance.
Carriers that deploy FleetRabbit as part of a deliberate empty mile reduction program — establishing baseline metrics, setting improvement targets by category, training dispatchers on the data available in the platform, and reviewing analytics on a weekly basis — consistently achieve reductions of 18 to 30 percent in total empty miles within the first six months of operation. Carriers that deploy FleetRabbit for operational management without a structured reduction program still realize improvements of 10 to 15 percent from the improved dispatch visibility alone. Book a demo to discuss your carrier's specific empty mile profile and the FleetRabbit capabilities most relevant to your reduction opportunities.
Frequently Asked Questions
Reduce Empty Miles. Improve Margin. Build a More Efficient Fleet Operation.
FleetRabbit gives your fleet operations team the dispatch intelligence, analytics, and real-time vehicle visibility needed to systematically reduce empty miles — without adding headcount or complex technology integrations. Start with your current baseline data and build a measurable improvement program from day one.







