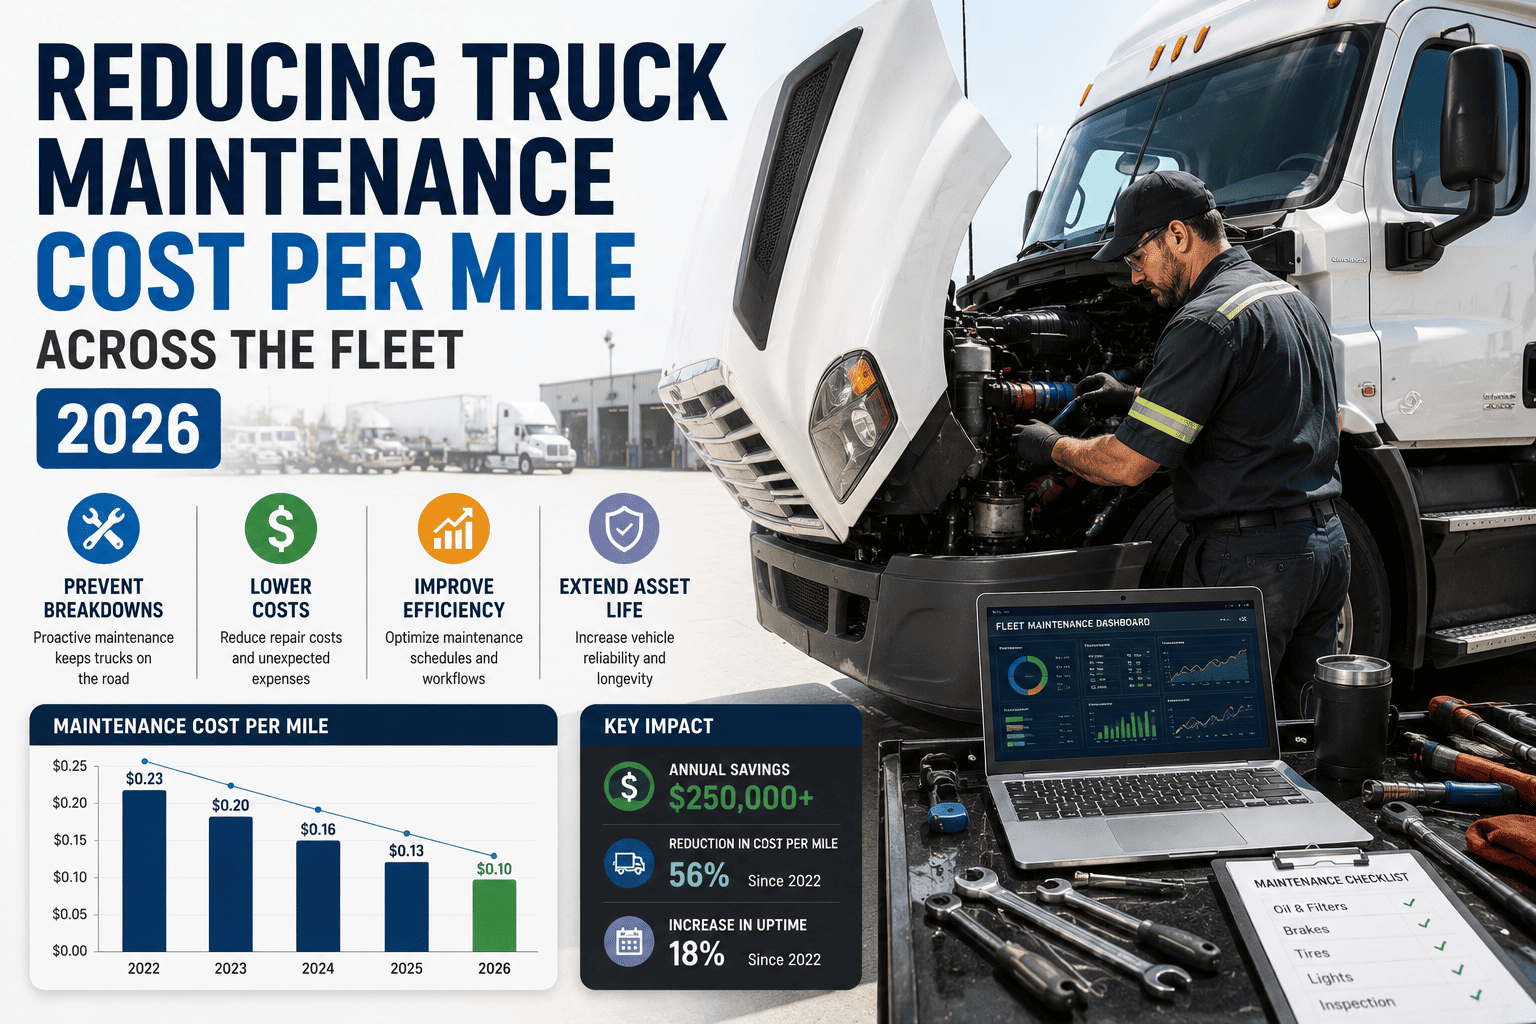
Most fleet managers know their total maintenance bill down to the dollar, yet have no idea whether $0.18 or $0.31 per mile is good or bad for their operation. Cost per mile is the one number that strips away fleet size, route length, and vehicle mix to reveal the truth: is your maintenance program efficient, or is it quietly draining six figures a year? In 2026, the gap between top-quartile and bottom-quartile fleets on this single metric can mean hundreds of thousands of dollars in avoidable spend.
Industry average maintenance cost sits near 20 cents per mile, while top-performing fleets operate between 12 and 18 cents through structured preventive maintenance. Bottom-quartile fleets often exceed 30 cents per mile. On a 100-truck fleet running 80,000 miles a year, that 10 to 15 cent gap translates into 800000 dollars or more in annual waste. Tracking cost per mile by vehicle, not just fleet-wide, is the fastest way to find where the money is leaking.
Why Cost Per Mile Matters More Than Your Total Maintenance Bill
A fleet spending 50000 dollars a year on one truck sounds expensive until you divide it by mileage. A truck running 100000 miles annually at 50000 dollars in maintenance costs 0.50 dollars per mile. Another truck spending only 30000 dollars but running just 40000 miles actually costs 0.75 dollars per mile, making it the more expensive asset per unit of work performed. Without this normalized view, fleet managers compare raw dollar totals and draw the wrong conclusions about which vehicles or routes are actually underperforming.
Cost per mile also acts as an early warning system. A vehicle whose cost per mile climbs steadily month over month is signaling a developing problem long before a major breakdown occurs. Fleets that track this metric at the individual vehicle level, rather than as a single fleet-wide average, catch expensive outliers early and act before small issues become five-figure repairs.
The Three Numbers Every Fleet Manager Should Track
Reducing cost per mile starts with visibility into three core figures: total maintenance cost per vehicle, the ratio of planned to reactive repairs, and miles driven per vehicle per period. Together these numbers reveal whether high spend is driven by vehicle age, deferred maintenance, harsh duty cycles, or simply low utilization spreading fixed costs across fewer miles.
What Drives Maintenance Cost Per Mile Up
Several operational factors push cost per mile above benchmark, and most are fixable once they are measured. Aging vehicles are the single biggest driver, with major component failures clustering between 150000 and 200000 miles or after year six to eight of service. Reactive repair culture is the second major driver. Fleets averaging 45 percent reactive maintenance routinely spend far more than fleets holding that ratio under 20 percent, simply because emergency labor, expedited parts, and overtime premiums stack on top of every unplanned failure.
Outsourced labor is a quieter cost driver. In-house shop labor typically runs 45 to 75 dollars an hour, while third-party shop labor runs 125 to 175 dollars an hour for the same task. Fleets that route a large share of repairable work to outside vendors out of necessity, rather than choice, see their cost per mile climb steadily even when their vehicles are otherwise in good condition. Low vehicle utilization compounds the problem further, since fixed inspection and compliance costs get spread across fewer miles, inflating the per-mile figure even when total spend looks reasonable.
The Hidden Cost Layer Most Fleets Never Track
Direct repair invoices typically represent only 60 to 70 percent of true maintenance expense. The remaining share is made up of downtime value, towing, expedited shipping, and driver hours lost during repairs, none of which show up on a standard parts and labor invoice. A fleet calculating cost per mile from invoices alone is systematically underestimating its real number, often by a wide margin.
FleetRabbit captures labor hours, parts costs, and downtime at every work order close, calculating true cost per mile per vehicle without manual spreadsheets. Sign up free and see exactly which trucks are draining your budget, or book a demo to benchmark your fleet against 2026 industry standards.
Five Levers To Lower Cost Per Mile Across The Fleet
Reducing fleet-wide cost per mile is not about one dramatic fix. It comes from pulling several measurable levers consistently over time, then tracking the result at the vehicle level rather than only at the fleet average.
| Lever | Typical Impact | How It Works | What To Track |
|---|---|---|---|
| Shift Reactive To Planned | 15 to 20 percent total cost reduction per 10 percent shift | Scheduled inspections catch wear items before they fail on the road, avoiding emergency labor and rush parts pricing | Planned vs reactive repair ratio, target under 20 percent reactive |
| Bring Repairs In-House | 40 to 60 percent labor rate savings | In-house labor runs 45 to 75 dollars per hour versus 125 to 175 dollars at outside shops for comparable work | Outsourced versus in-house repair share by job type |
| Right-Size Replacement Timing | 5.5x cost gap avoided on oldest units | Vehicles past the 6 to 8 year or 400000 to 600000 mile mark see costs accelerate 25 to 30 percent annually | Cost per mile by vehicle age, flag units exceeding 40 to 45 percent of fair market value |
| Bulk Parts Purchasing | 15 to 25 percent savings on commodity parts | Negotiated pricing on filters, fluids, and hardware locks in rates and hedges against tariff-driven increases | Parts cost per unit versus negotiated vendor pricing |
| Improve Vehicle Utilization | Spreads fixed costs across more productive miles | Idle or underused vehicles still accrue inspection and compliance costs without generating offsetting mileage | Miles driven per vehicle per period versus fleet average |
Vehicle Age And Cost Per Mile: The Replacement Question
One of the clearest patterns in fleet maintenance data is how cost per mile behaves over a vehicle's life. The first three years are typically the cheapest, with costs limited mostly to routine preventive maintenance, much of it covered under warranty. Years three through five bring a gradual increase as wear items begin needing replacement. After year six, major component failures accelerate quickly, and costs can nearly double between years six and seven before climbing another 25 to 30 percent annually after that.
This pattern means that holding onto an aging truck too long can quietly cost more than financing a replacement, while replacing too early forfeits remaining useful life and depreciation value. The right answer is not a fixed age cutoff. It comes from comparing a specific vehicle's cost trend against the total cost of operating a replacement, including financing, fuel efficiency, and projected downtime.
A Practical Replacement Rule
A widely used guideline is the 40 percent rule: when a vehicle's annual maintenance cost exceeds roughly 40 to 45 percent of its current fair market value, replacement typically becomes the more cost-effective path. Pairing this rule with per-vehicle cost-per-mile tracking turns a subjective replacement debate into a data-backed business case that finance and operations leadership can approve with confidence.
Building A Cost Per Mile Tracking System That Actually Works
Spreadsheets can technically calculate cost per mile, but they break down at scale because they depend on someone manually pulling labor hours, parts invoices, and mileage data from separate systems every month. By the time the report is built, the data is already weeks old, and the vehicle that needed attention may have already failed on the road. A connected system that captures cost data automatically at the moment a work order closes gives fleet managers a live, accurate picture instead of a delayed snapshot.
The most useful systems break cost per mile down by vehicle, by repair category, and by planned versus reactive status, then flag any unit drifting above the fleet's target benchmark. This turns a single lagging number into an early warning dashboard, letting maintenance teams intervene on a specific truck weeks before it becomes the next emergency breakdown.
What Best-In-Class Fleets Do Differently
The gap between a fleet averaging 0.30 dollars per mile and one averaging 0.18 dollars per mile is rarely explained by luck, fleet age alone, or driver quality. It comes down to visibility. Top-quartile fleets know their cost per mile for every individual vehicle, their planned-to-reactive ratio, and exactly which repair categories should move in-house. That visibility lets them act on small problems before they compound, negotiate better parts pricing from a position of data, and build replacement cases that leadership approves without pushback.
For a 100-truck fleet running 80000 miles per vehicle annually, closing a 0.10 to 0.15 dollar gap per mile against the industry benchmark represents 800000 dollars or more in recoverable annual spend. That single insight is often the difference between a maintenance budget that quietly erodes profitability and one that becomes a genuine competitive advantage.
Stop relying on fleet-wide averages that hide which vehicles are bleeding money. FleetRabbit tracks maintenance cost per mile automatically, vehicle by vehicle, so you know exactly where to act. Sign up free and connect your data today, or book a demo to benchmark your fleet against 2026 industry standards.







