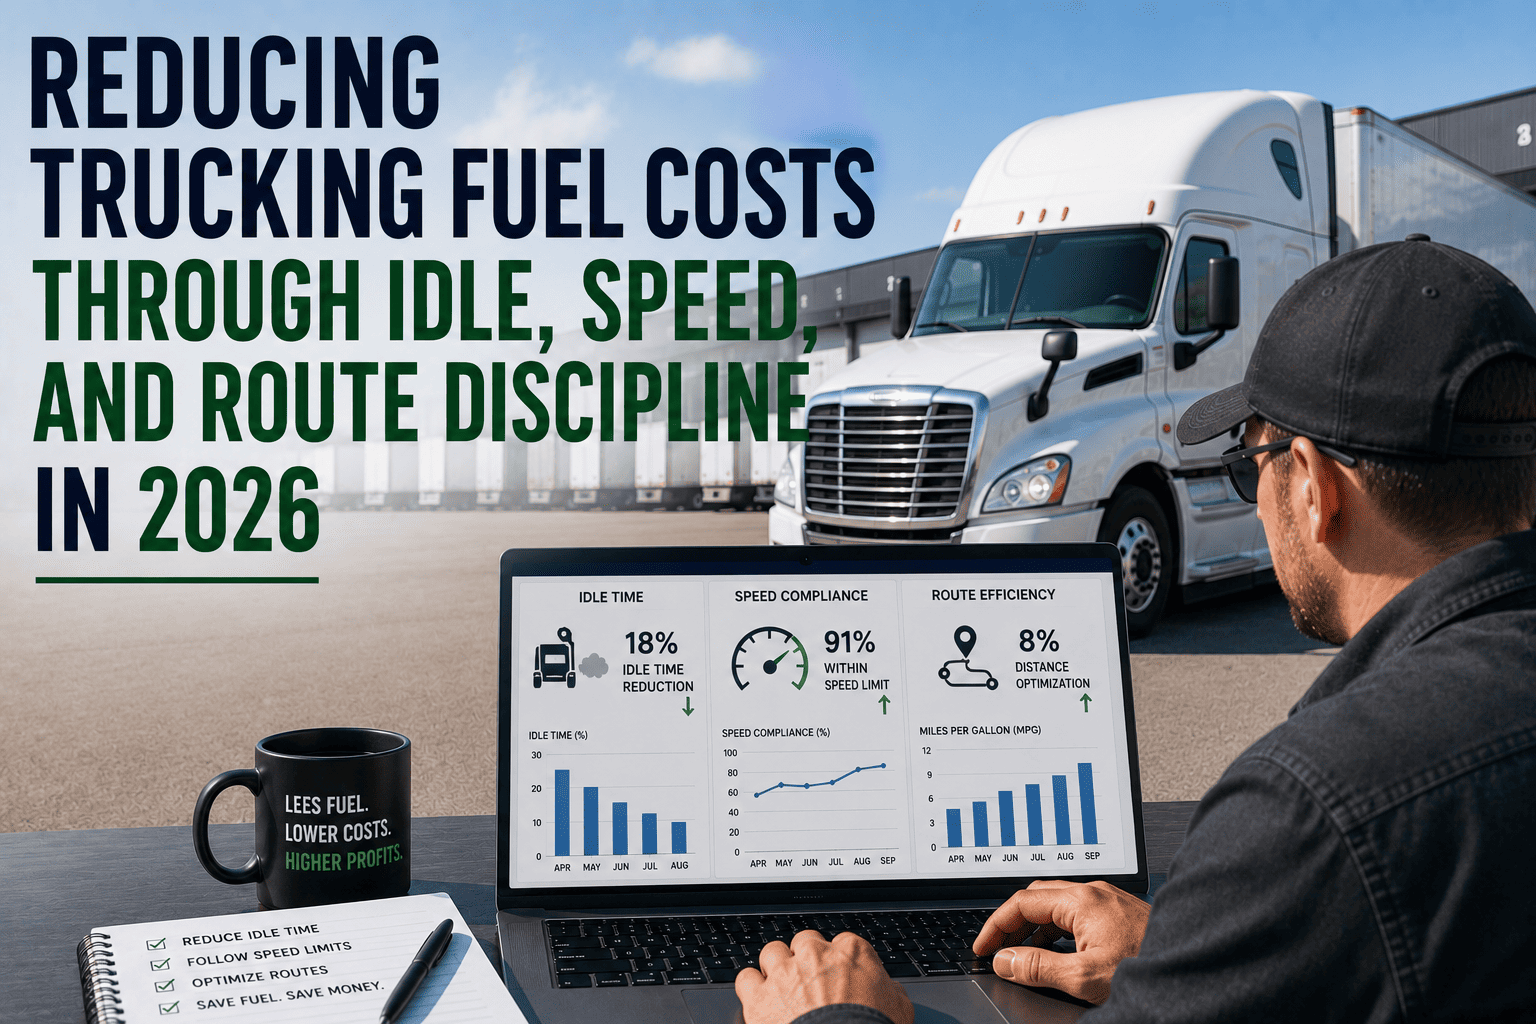
Fuel costs remain one of the largest operating expenses for trucking fleets in 2026, making fuel efficiency a critical business priority. By reducing idle time, controlling speeding, and improving route discipline, fleets can significantly lower fuel consumption and operating costs. Modern fuel management software and telematics tools provide real-time visibility into driver behavior, fuel usage, and route performance. These insights help fleet managers eliminate inefficiencies, improve vehicle productivity, and achieve long-term cost savings while maintaining efficient and profitable fleet operations.
Reducing Trucking Fuel Costs Through
Idle, Speed & Route Discipline
Diesel hit $5.40/gal in April 2026. Fuel now eats 40–60% of your operating budget. Here's exactly how top fleets are fighting back — and winning.
Every gallon of diesel wasted to idling, speeding, or poor routing costs your fleet real money — with zero freight moved. A heavy-duty truck burns 0.8 gallons per idle hour. Driving at 75 mph vs. 65 mph costs an extra $20,000+ per truck annually. Route inefficiency adds 9–15% to your fuel bill. FleetRabbit's fuel management platform gives you complete visibility to fix all three — often recovering $10,000–$30,000 per truck per year.
Why Fuel Costs Are Your Biggest Battle in 2026
Fuel is no longer just a line item — it's the fight for survival in 2026's trucking market. The U.S. Energy Information Administration pegged on-highway diesel at $5.40/gallon in April 2026, with forecasts averaging $4.80/gal for the full year. Non-fuel operating costs hit a record $1.779/mile in 2024, and margins are razor thin.
Here's the uncomfortable truth: most fleets are leaking fuel through three invisible drains — excessive idle time, unchecked speeding, and inefficient routing. None of these require new equipment to fix. They require visibility and discipline. That's exactly what FleetRabbit's fuel management platform delivers.
Idle Time
Wasted per truck annually. 0.8 gal/hr burned with zero freight moved.
Speeding
Extra fuel cost per truck/year driving 75 mph vs. 65 mph over 600 daily miles.
Route Waste
Added to fuel bills from stop-and-go routing, congestion, and deadhead miles.
The 3 Fuel Drains Costing You the Most
Idle Time: The Silent Budget Killer
A long-haul truck idles roughly 1,800 hours per year for rest periods, loading, and waiting. At 0.8 gallons per hour and $4.80/gal diesel, that's $6,912 per truck annually — for zero productive output. The DOE confirms: over 1 million long-haul trucks idle during required rest stops, consuming more than 1 billion gallons of fuel per year.
What's Driving Idle Waste?
Speed Discipline: Every MPH Has a Price Tag
Aerodynamic drag rises exponentially above 65 mph. Research from the DOE is clear: aggressive driving reduces fuel economy by 15–30% on highways and 10–40% in city traffic. A "lead-foot" driver uses up to 20% more fuel than the average driver. Driving at 75 mph vs. 65 mph over 600 daily miles burns roughly 24 extra gallons per day — over $83 daily, or $20,000+ annually per truck.
Speed vs. Fuel Economy — The Real Numbers
| Speed (mph) | Est. MPG (Class 8) | Daily Fuel Cost* | Annual Cost per Truck* |
|---|---|---|---|
| 55–60 | 7.2–8.0 | ~$360 | ~$93,600 |
| 62–65 | 6.5–7.0 | ~$410 | ~$106,600 |
| 70 | 5.8–6.3 | ~$457 | ~$118,800 |
| 75+ | 5.0–5.5 | ~$523 | ~$136,000 |
*Based on 600 daily miles, 260 operating days/year, $4.80/gal diesel
Route Inefficiency: Miles That Don't Pay
Congestion cost the trucking industry $108.7 billion in 2022, averaging $7,588 per truck. Averitt Express reduced fuel usage by 15.9% simply through smarter routing and network design. A regional delivery fleet using traffic-aware routes reduced daily mileage by 9% — delivering six-figure annual savings across 100 vehicles.
Route inefficiency isn't just about distance. It's stop-and-go patterns, congestion zones, poor load consolidation, and deadhead miles. Want to see how much you're losing? Book a demo and we'll run a route efficiency audit on your fleet data.
Route Waste Sources
See Every Gallon. Control Every Dollar.
FleetRabbit monitors idle time, speed patterns, and route efficiency across your entire fleet — in real time. Most fleets see 10–15% fuel savings within 90 days. Start your free trial today or book a personalized demo.
Proven Strategies to Cut Fuel Costs Now
You don't need new trucks to save fuel. The fleets seeing the biggest gains are using what they already have — smarter. Here are the highest-ROI moves in 2026.
Idle Reduction Policy
Set a company-wide idle limit of 10 minutes maximum. Target under 15% fleet idle time. Use telematics alerts for violations. Nussbaum Transportation drove idle to 11% fleet-wide using coaching + analytics — saving thousands per truck.
Speed Governance
Set governed speed at 62–65 mph. Enable cruise control on flat highways. A 10 mph reduction in average speed can improve fuel economy by 7–14%. Even governed drivers show 10–20% variation — coaching closes that gap.
Route Optimization
Use AI-powered routing that factors in traffic, terrain, hours of service, and stop sequences. Avoid congestion zones. Reduce deadhead miles. Fleets using optimized routing save 3–7% MPG improvement in the first quarter.
Smooth Driving Coaching
Aggressive driving cuts economy by 15–30% on highways. Coach gradual acceleration, smooth braking, and proper following distance. In-cab feedback systems improve fuel economy by an average of 6.6% per DOE research.
Tire & Equipment Checks
Every 10 PSI below spec increases fuel consumption by 0.5–1%. 1 in 5 Class 8 tractors run underinflated tires. Skipping oil changes reduces economy by ~4%. Daily DVIR inspection via FleetRabbit catches these before they drain MPG.
Telematics + Fuel Analytics
Fleets using telematics with VIN-level fuel tracking see 3–7% MPG gains in the first quarter. Driver scorecards for speed, idle, and harsh events turn data into accountability. FleetRabbit makes setup take just 15 minutes.
What Top Fleets Are Doing Differently in 2026
The NACFE Run on Less study found 14 participating fleets operating 75,000 trucks saved $512 million compared to average trucks on the road. The difference wasn't the equipment — it was operations and discipline.
How FleetRabbit Controls All Three Fuel Drains
Most fuel problems go undetected because managers lack visibility. FleetRabbit changes that — giving you a real-time window into every truck, every driver, every route. Sign up free and get your first fuel efficiency report within 24 hours.
Idle Monitoring
Real-time alerts when any vehicle exceeds your idle policy. Weekly idle reports by driver and vehicle. Set reduction targets and track progress automatically.
Speed & Behavior Scorecards
Per-driver scorecards tracking speed compliance, harsh events, and MPG trends. Turn coaching from guesswork into data-driven conversations that actually change behavior.
Route Fuel Analytics
VIN-level fuel consumption mapped to routes and stops. Identify which routes burn the most fuel and optimize sequences to reduce stop-and-go and deadhead miles.
Maintenance & DVIR
Digital inspection forms catch underinflated tires, damaged fairings, and filter issues before they silently drain MPG. Integrated maintenance scheduling keeps every truck at peak efficiency.
Fuel Dashboard
One screen shows you exactly where your fuel budget is going — by truck, driver, route, and time period. Weekly trends surface the patterns that cost you most. Setup takes 15 minutes.
ROI Reporting
Track actual fuel savings vs. baseline week over week. Prove the ROI of your fuel program to leadership with automated reports. Most fleets show positive ROI within 60 days.
Calculate Your Fuel Savings Potential
Use this quick reference to estimate what's at stake for your fleet. These figures are based on $4.80/gal diesel, 600 daily operating miles, and 260 operating days per year per truck.
Want a personalized estimate? Book a 30-minute demo and we'll run the numbers for your fleet.
Your Fuel Budget Deserves a Fighting Chance
FleetRabbit is the fuel management platform built for trucking operations that are serious about cutting costs. Real-time idle alerts, driver scorecards, route analytics, and maintenance tracking — all in one dashboard. Sign up free today. No credit card required. Or book a demo and see it live on your own fleet data.
Frequently Asked Questions
The Bottom Line for 2026
Fuel is your fleet's biggest controllable expense — and it's more controllable than most managers realize. The fleets winning in 2026 aren't the ones with the newest equipment. They're the ones with the best visibility into idle, speed, and route discipline.
A single truck improving from 6.0 to 7.0 MPG saves $10,000 per year. Over a 20-truck fleet, that's $200,000 annually — just from driving smarter, not harder. The tools to make it happen cost a fraction of that. Start your free FleetRabbit trial or book a demo to see exactly what your fleet can recover.
Idle time at 28% fleet-wide means you're burning $4,000–$6,000 per truck in fuel that moves nothing.
Every 10 mph above 65 mph costs thousands in aerodynamic drag — and the DOE confirms it's 15–30% fuel economy loss.
Route inefficiency adds 9–15% to your fuel bill through congestion, deadheading, and poor stop sequencing.
You can't manage what you can't see. Real-time fuel analytics is the foundation of every high-performing fleet in 2026.







