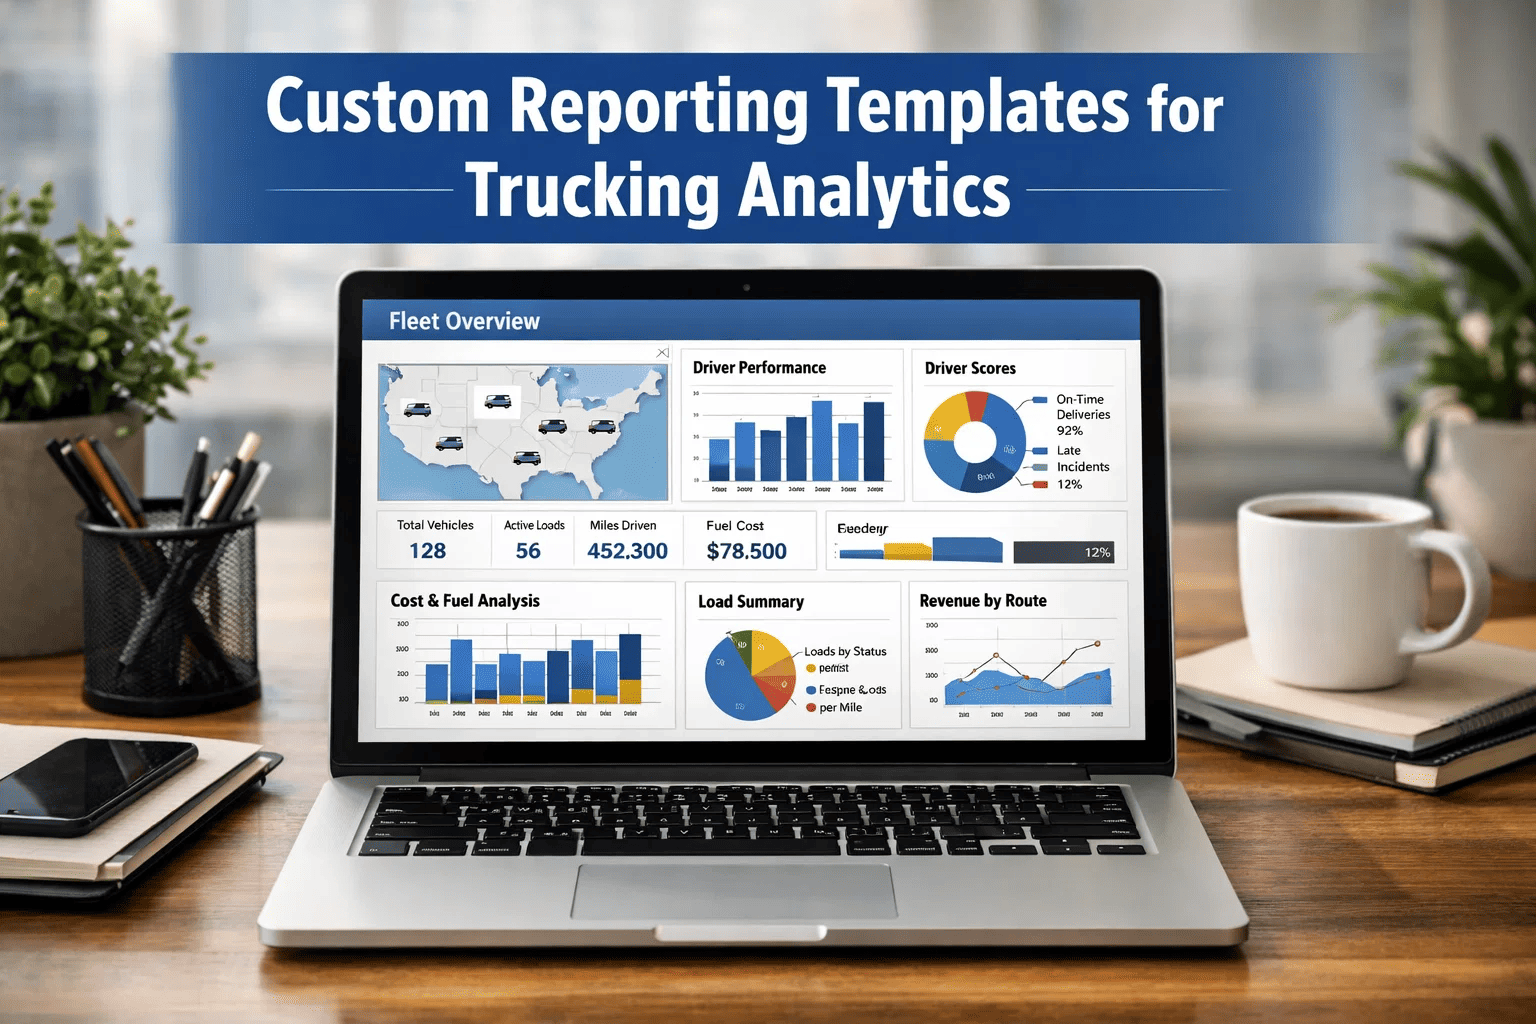
Trucking fleets generate more operational data per day than most industries collect in a quarter — GPS coordinates, fuel transactions, engine diagnostics, HOS logs, inspection results, maintenance records, load completions, and driver behavior events. The fleets winning on profitability aren't the ones with the most data — they are the ones that translate raw data into precise, role-specific reports that drive faster, smarter decisions. Custom reporting separates fleet managers who react to problems from executives who predict and prevent them. FleetRabbit's analytics platform gives every role in your organization the reporting framework it needs — pre-built where standard metrics apply, fully customizable where your operation has unique requirements. Book a demo to explore FleetRabbit's custom reporting capabilities for your fleet.
Free Template Resource
Custom Reporting Templates for Trucking Analytics: Fuel Efficiency, Driver Performance, Compliance, and Cost-Per-Mile Dashboards Built for Fleet Operations
TRUCKING ANALYTICS & REPORTING RESOURCE
Custom Reporting Templates Every Trucking Fleet Needs to Run Smarter Operations
Generic fleet reports answer the questions you thought to ask. Custom reporting frameworks answer the questions that determine whether your fleet is profitable, compliant, and operationally efficient — before problems surface in your P&L. These templates give every role in your organization the analytical foundation to perform at the highest level.
Fuel Efficiency Reports
Driver Performance Analytics
Compliance Tracking
Cost-Per-Mile Analysis
Maintenance Cost Reports
Why Generic Reports Aren't Enough
Standard fleet platform reports show averages across your entire operation. Your operation doesn't have average vehicles, average drivers, or average routes. Custom reports expose the specific variances — the single route consuming 14% more fuel than benchmarks, the three drivers whose behavior patterns account for 60% of accident risk, the five vehicles with maintenance cost profiles that signal replacement decisions. Averages hide the intelligence that drives competitive advantage.
83%
of fleets run only default platform reports
$47K
average annual savings per 50-truck fleet from custom cost reporting
3x
faster regulatory audit preparation with custom compliance reports
Template 1: Fuel Efficiency and Consumption Analysis Report
Vehicle-Level Metrics
Miles per gallon by vehicle vs. fleet average and manufacturer specification
Idle time hours per vehicle per week and idle fuel cost calculation
Speed profile analysis — percentage of miles driven above 65 mph threshold
Engine load factor analysis identifying mechanically inefficient vehicles
Driver-Level Metrics
Fuel economy ranking by driver controlling for load weight and route type
Aggressive acceleration and hard braking frequency — events per 100 miles
Cruise control utilization rate on highway segments
Idle behavior comparison — individual driver idle hours vs. fleet norm
Route and Network Metrics
Fuel consumption per lane — identify routes with structural fuel overuse
Fuel card transaction analysis — location, price paid vs. contract rate
Deadhead mile fuel cost — empty mile fuel spend quantified by route
Seasonal fuel consumption variance — summer vs. winter efficiency deltas
How FleetRabbit Powers This Report
FleetRabbit integrates GPS telematics, ELD engine data, and fuel card transactions into a unified fuel efficiency dataset. Reports refresh automatically as new data arrives — no manual consolidation. Drill-down from fleet summary to individual vehicle to specific shift enables targeted coaching conversations backed by data that drivers cannot dispute.
Template 2: Driver Performance and Safety Behavior Report
Safety Behavior Score
Hard Braking Events
Events per 100 miles — benchmark vs. individual
Rapid Acceleration
Acceleration events exceeding 8 mph/second threshold
Speed Compliance
Percentage of time within posted speed limits by road class
Seatbelt Compliance
Seatbelt deployment rate on ignition-on events
HOS Compliance Score
Violation Rate
HOS violations per 100 logged driving days
Log Edit Frequency
Driver-initiated log edits — ratio to total log events
Pre-Trip DVIR Rate
Percentage of shifts with completed pre-trip inspection
Unassigned Drive Time
Movement without driver log assignment — flag for review
Operational Performance
On-Time Delivery Rate
Percentage of stops arrived within customer window
Idle Time
Non-productive idle hours as percentage of shift time
Fuel Efficiency Rank
MPG percentile ranking controlling for load and route type
Vehicle Condition Reports
DVIR defect report rate and severity distribution
Build Reports That Drive Real Operational Decisions
FleetRabbit's analytics platform delivers pre-built report templates for fuel, safety, compliance, and cost tracking — all customizable to your operation's specific metrics and reporting cadence. Stop managing by averages. Start managing by data. See the full reporting suite in a live demo.
Template 3: Compliance and Regulatory Reporting Dashboard
Driver Qualification File Status
CDL expiration tracking — driver license validity by expiration date
Medical certificate expiration — 60, 30, and 7 day advance alerts
Annual MVR review completion status — all drivers current vs. overdue
Drug and alcohol clearinghouse query status — annual query completion rate
Vehicle Maintenance Compliance
Annual DOT inspection status — current, expiring, expired by vehicle
Open DVIR defects — unresolved defect items by severity and age
Preventive maintenance schedule compliance — overdue services by equipment
Brake inspection intervals — air brake systems within FMCSA interval requirements
HOS and ELD Compliance
HOS violation count by driver and violation type — 30 and 90 day trend
Unassigned drive time — percentage of total fleet drive time unassigned
Log certification rate — percentage of logs certified by driver within requirement
ELD malfunction events — device malfunction log and paper log fallback documentation
FleetRabbit Compliance Report Automation
FleetRabbit's compliance dashboard aggregates ELD data, maintenance records, and driver qualification documents into a single readiness view. Exception alerts triggered 60, 30, and 7 days before expiration events. DOT audit preparation packages generated on demand in FMCSA-standard formats. Safety manager spends time correcting issues — not discovering them.
Template 4: Vehicle Maintenance Cost and Total Cost of Ownership Report
Cost Per Mile Analysis
Maintenance cost per mile by vehicle, by age cohort, by manufacturer — identifies which segments of your fleet carry disproportionate maintenance burden and at what mileage threshold cost curves accelerate.
Planned vs. Emergency Spend Ratio
Tracks the proportion of total maintenance spend resulting from scheduled service versus unplanned breakdown response. Industry benchmark is 80 percent planned, 20 percent reactive. Fleets above 30 percent reactive have systemic predictive maintenance gaps.
Repeat Repair Analysis
Warranty and Quality Control
Identifies components repaired multiple times within 90 days — flagging warranty recovery opportunities, vendor quality issues, and technician training needs before repeat repair costs accumulate undetected.
Vehicle Replacement Trigger Model
Compares individual vehicle total maintenance cost against fleet average and against new vehicle ownership cost including depreciation. Identifies vehicles where continued maintenance investment exceeds replacement cost — flagging replacement decisions 6 to 12 months before financial break-even.
Template 5: Executive Operations Summary Report
Financial Performance
Total fleet operating cost vs. budget — monthly and trailing 12 months
Cost per revenue mile trend — current period vs. prior year comparison
Fuel spend as percentage of revenue — benchmark against industry quartiles
Maintenance cost trend — planned vs. emergency spend ratio improvement over time
Safety and Compliance
DOT recordable accident rate — incidents per million miles vs. industry benchmark
CSA score trend by BASIC category — identify areas approaching intervention thresholds
Compliance status summary — percentage of fleet fully compliant across all regulatory domains
Insurance claim frequency and severity — claims per fleet unit vs. prior period
Operational Efficiency
Fleet utilization rate — revenue miles as percentage of available capacity
On-time delivery performance — percentage of loads delivered within customer commitment
Equipment uptime — vehicle availability rate including planned and unplanned downtime
Driver retention rate — turnover percentage and cost estimation
How FleetRabbit Builds and Automates Custom Reports
1
Select Metrics and Data Sources
FleetRabbit's report builder provides access to every data point the platform captures — GPS, ELD, DVIR, fuel, maintenance, driver behavior, and integration feeds from connected systems. Select the specific metrics relevant to your reporting objective from a structured metric library.
2
Configure Filters and Groupings
Filter by vehicle group, driver cohort, route, region, time period, or any custom attribute your fleet tracks. Group results by the dimensions that matter for your analysis — by terminal, by customer, by equipment type, or by operational division.
3
Set Benchmarks and Alert Thresholds
Define what good performance looks like for your operation specifically. Set benchmark values against which individual results are compared. Configure automated alerts when metrics cross thresholds requiring management attention — so reports proactively surface exceptions rather than requiring manual review to find them.
4
Schedule Automated Delivery
Reports scheduled for automatic delivery to specified recipients on daily, weekly, or monthly cadence. Fleet managers receive operational exception summaries each morning. Executives receive weekly performance summaries. Safety officers receive compliance status reports every Monday. No one needs to log into the platform to get the information they need.
Frequently Asked Questions: Fleet Reporting and Analytics
QCan we create reports for metrics specific to our operation that FleetRabbit doesn't track by default?
FleetRabbit's custom field capability allows fleets to define and track operation-specific data points — contract lane identifiers, customer-specific performance metrics, equipment classification codes, or regional cost centers. Custom fields integrate into the report builder alongside standard platform metrics. Enterprise customers can request custom metric calculations not available in the standard builder.
QHow many reports can we create and schedule simultaneously?
FleetRabbit does not limit the number of custom reports or scheduled deliveries. Enterprise customers typically run 15 to 30 distinct scheduled reports covering different roles, time periods, and operational divisions. Report templates can be shared across accounts — a report built for one terminal can be replicated and adapted for others without rebuilding from scratch.
QCan reports include data from our integrated TMS or ERP systems?
Yes. Reports built in FleetRabbit can include data from integrated external systems — freight revenue from TMS for cost-per-load analysis, parts costs from ERP for maintenance spend reporting, payroll data for driver cost allocation. Cross-system reports require active integration connections but provide the most comprehensive operational intelligence available.
QWhat export formats are available for regulatory and insurance reporting?
FleetRabbit reports export in PDF, Excel, and CSV formats. FMCSA compliance reports export in regulatory-standard formats accepted for audit submission. ELD records exported in FMCSA transfer file format for roadside inspection requests. Custom export templates available for insurance carriers requiring specific data layouts for premium calculation and claims analysis.
Fleet data has no value if it stays inside the platform that collected it. Custom reporting is the mechanism that moves operational intelligence from database records into the decisions that determine fleet profitability, safety performance, and regulatory standing. Fleets that invest in reporting infrastructure consistently outperform those running on periodic spot checks and anecdotal management.
The templates in this guide represent the reporting foundation that high-performing trucking operations use to stay ahead of problems, optimize costs, and make data-backed capital decisions. FleetRabbit provides the data and the reporting infrastructure — the competitive advantage comes from using it systematically.
Start Building Fleet Reports That Actually Drive Decisions
FleetRabbit's analytics platform includes pre-built templates for fuel efficiency, driver performance, compliance, and cost tracking — all customizable to your specific operation. Schedule automatic report delivery to every role that needs fleet intelligence to perform effectively.
Fuel Efficiency Reports
Driver Scorecards
Compliance Dashboards
Maintenance Cost Analysis
Executive Summaries
April 15, 2026
By Nathan Smith
All Posts