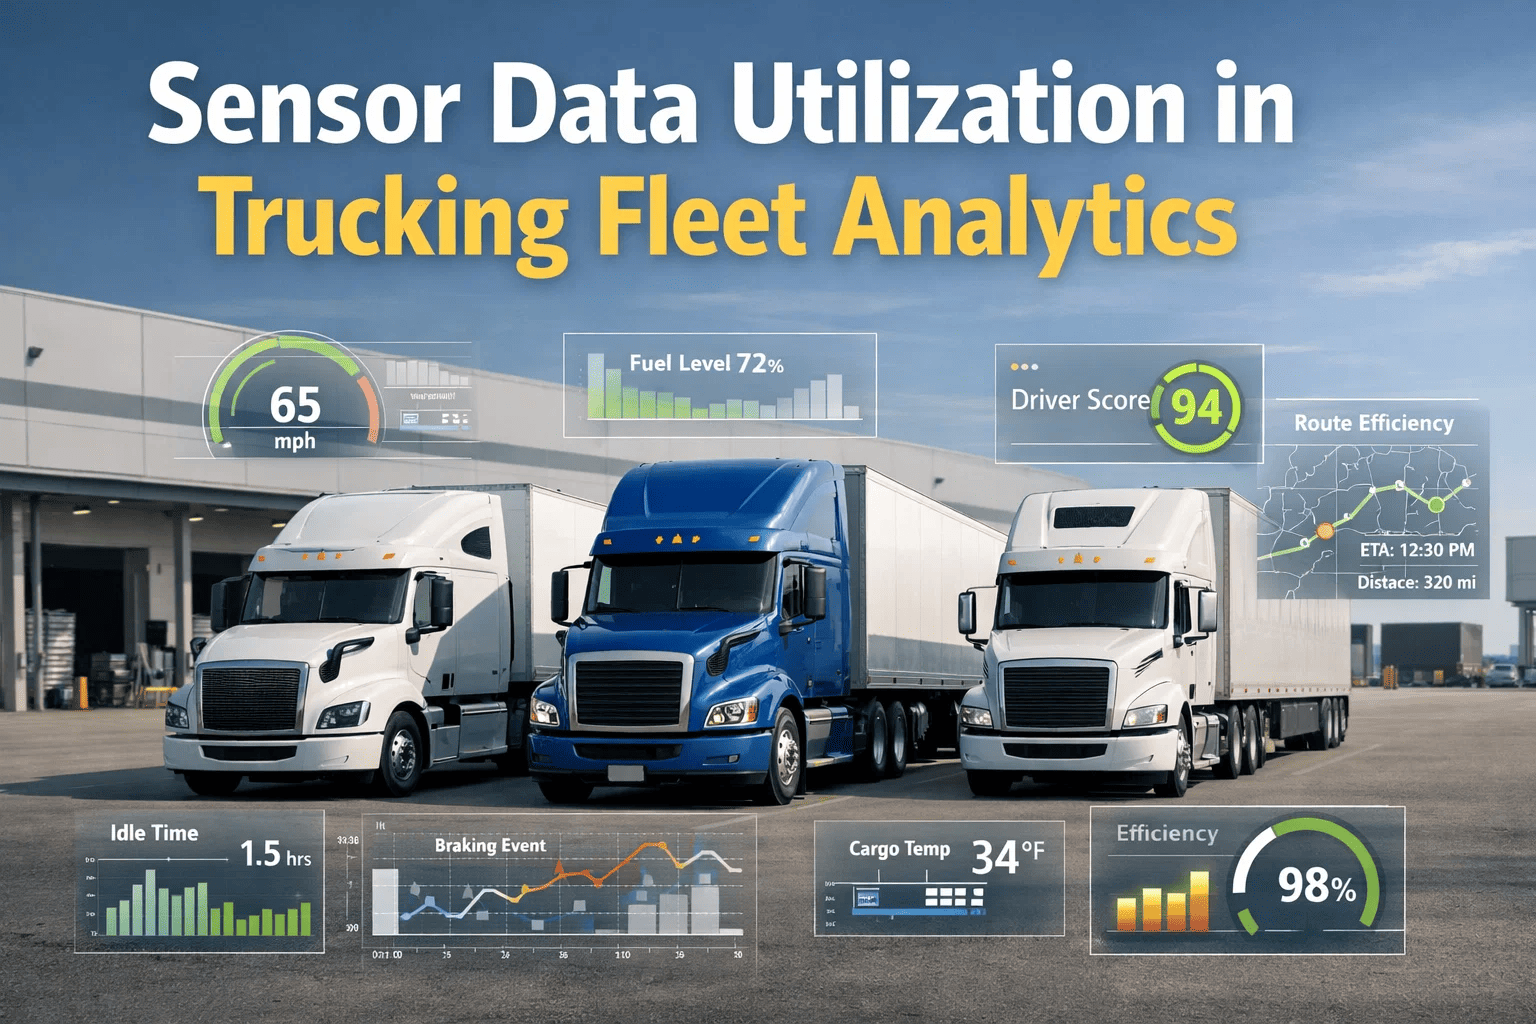
Commercial trucking vehicles equipped with modern telematics systems generate a continuous stream of sensor data that most fleet operators collect, transmit, and effectively discard — storing raw data in platform databases that no one queries systematically, triggering reactive alerts for the most obvious threshold violations, and otherwise leaving the analytical potential of hundreds of data points per vehicle per mile untranslated into the operational intelligence that could reduce maintenance costs, prevent breakdowns, optimize fuel consumption, and inform capital planning decisions. The gap between the sensor data that modern commercial fleets generate and the actionable insights that fleet managers actually use in daily operations represents one of the largest unrealized return opportunities available to carriers today — and closing that gap does not require new hardware investment, because the sensors generating the data are already installed. Book a demo to see how FleetRabbit's analytics layer converts telematics and maintenance data into the fleet performance intelligence that drives cost reduction and operational improvement.
Guide Summary
Sensor data utilization in trucking fleet analytics encompasses the process of transforming the raw data streams from vehicle telematics hardware — GPS, engine diagnostics, driver behavior sensors, and environmental monitoring systems — into operational insights that fleet managers act on in daily maintenance decisions, dispatch management, driver coaching, and capital expenditure planning. This guide covers the primary sensor data categories available from commercial vehicle telematics, the analytical applications that convert each data type into specific operational value, the data quality and integration requirements that enable analytics, and how FleetRabbit's analytics capabilities integrate telematics and maintenance data into the actionable fleet intelligence framework that drives measurable operational improvement.
The Sensor Data Ecosystem: What Your Fleet is Already Measuring
A modern Class 8 commercial truck equipped with a telematics system and connected to a fleet management platform generates data from dozens of sensors that are either factory-installed by the OEM or added through the carrier's telematics hardware installation. These sensors operate continuously during vehicle operation — recording and transmitting hundreds of measurable parameters that collectively describe the vehicle's mechanical condition, operational performance, driver behavior patterns, and geographic position with a precision and frequency that entirely previous generations of fleet management technology could not approach. Most fleet operators access only a fraction of this available data through standard telematics dashboards that show location, speed, and basic fault code information — leaving the majority of the sensor data stream analytically used primarily for reactive incident response rather than proactive optimization.
Engine Management System (EMS) / ECM Data
Data Available
Engine RPM at all operating points — idle, cruise, maximum torque demand
Fuel consumption rate — instantaneous and cumulative per trip and per hour
Engine coolant temperature — operating temperature histogram and peak exceedance frequency
Oil pressure — minimum, maximum, and low-pressure event frequency
Intake manifold pressure — boost pressure during acceleration events
Injector timing and fuel delivery — combustion efficiency indicators
Analytical Applications
Fuel efficiency benchmarking by driver, route, and vehicle — identifying high-consumption outliers for coaching or mechanical investigation
Engine condition trending — coolant temperature creep indicating cooling system degradation before failure
Idle time analysis — revenue-negative engine hours consuming fuel with no payload movement
GPS and Position Data
Data Available
Vehicle position — latitude, longitude, speed, heading at 15-60 second intervals
Geofence events — terminal departure and arrival, customer location entry and exit
Route adherence — deviation from planned route detected by GPS position versus planned route corridor
Stop events — location, duration, and frequency of vehicle stops during route execution
Speed profile — speed distribution by road type and geography over time
Analytical Applications
Empty mile analysis — GPS distance tracked versus revenue-generating distance to calculate empty mile rate per vehicle and route
Dwell time analytics — time at shipper and receiver locations compared to lane norms to identify loading/unloading bottlenecks
Route efficiency analysis — comparing actual route GPS tracks to optimal routes for delivery network optimization
Driver Behavior and Safety Data
Data Available
Harsh braking events — G-force threshold trigger, magnitude, and frequency per driver
Rapid acceleration — throttle application exceeding defined rate, fuel-inefficient acceleration patterns
Speed violations — frequency, duration, and amplitude of posted-speed exceedances by location
Hard cornering — lateral G-force events indicating aggressive steering inputs
Following distance — forward collision warning trigger frequency from camera or radar systems
Analytical Applications
Driver safety scoring — composite score from behavior events weighted by severity for coaching prioritization
Brake component lifecycle analysis — high harsh braking frequency correlated with accelerated brake component wear
Fuel behavior coaching — rapid acceleration and high-speed operation as primary fuel consumption behavior drivers
Vehicle Diagnostic and Fault Data
Data Available
Diagnostic Trouble Codes (DTC) — J1939 and OBD fault codes with timestamp and fault status
DPF soot loading — regeneration frequency and efficiency indicators
Transmission temperature — thermal stress events during heavy operation
Tire pressure monitoring — TPMS sensor readings at all wheel positions
Brake system pressure — air system performance parameters
Analytical Applications
Predictive failure identification — DTC pattern analysis identifying fault code sequences that precede component failure
DPF condition monitoring — regeneration interval trending indicates filter loading rate for proactive cleaning scheduling
TPMS deviation alerts — tire pressure analytics with pre-scheduled maintenance station notification before pressure reaches critical threshold
Predictive Maintenance Analytics: Shifting from Scheduled to Condition-Based Service
Preventive maintenance programs based on fixed mileage or time intervals represent the industry standard — and a substantial improvement over purely reactive maintenance. But fixed-interval PM programs have an inherent limitation: they apply the same service schedule to vehicles operating in dramatically different conditions. A truck making regional distribution runs in mild climate with moderate payloads accumulates wear at a fundamentally different rate than an identical truck pulling maximum GVW loads on mountain grades in temperature extremes. Fixed-interval schedules that are conservative enough for the harder-operated vehicle result in over-maintenance of easier-operated vehicles — and schedules optimized for typical conditions may be insufficient for extreme-use vehicles.
Sensor data analytics enables condition-based maintenance — adjusting service intervals based on actual measured wear indicators from the vehicle's operating sensors rather than a fixed calendar or mileage schedule. The progression from fixed-interval to condition-based maintenance requires: sensor data integration that captures the wear-relevant parameters (engine load histograms, coolant temperature exposure, brake application frequency from speed and deceleration data, DPF regeneration cycles), analytical models that correlate these operating parameters to component wear rates from maintenance records, and fleet management platform capabilities that trigger service recommendations based on operating condition accumulation rather than pure odometer reading. FleetRabbit's PM scheduling and work order system provides the operational framework that condition-based maintenance outputs feed into — maintenance recommendations generated by analytics translate into PM work orders, technician assignments, and parts preparation in the same workflow as fixed-interval scheduled maintenance.
01
Sensor Data Collection
Telematics platform captures and transmits ECM parameters, DTC events, GPS position, and driver behavior data at defined intervals. Data flows to fleet management platform via telematics provider API — FleetRabbit integrates with multiple telematics providers to consolidate multi-source data.
02
Data Normalization and Enrichment
Raw sensor data is normalized against vehicle asset specifications — comparing coolant temperature to model-specific operating parameters, calibrating DTC severity against manufacturer documentation, and enriching GPS data with route type classification for load-appropriate wear rate modeling.
03
Pattern Analysis and Trending
Analytics layer applies rolling analysis to normalized data — identifying parameter drift (gradual coolant temperature increase over weeks versus sudden spike), recurring DTC patterns that precede historical failures, and operating condition intensity scores that adjust PM interval recommendations.
04
Maintenance Recommendation Generation
Analytics outputs generate actionable maintenance recommendations — "Vehicle 4421: DPF regeneration frequency has increased 40% over the past 30 days — schedule DPF inspection before next PM interval" — integrated into FleetRabbit's work order queue with specific vehicle, service type, and priority indicators.
05
Maintenance Action and Feedback Loop
Work order completed in FleetRabbit captures technician findings — confirming or challenging the analytics prediction. Technician findings fed back into the analytics model — actual component condition at service versus predicted condition refines the model's future accuracy.
Fuel Analytics: The Highest-Return Data Application in Most Fleets
Fuel is the largest variable cost in commercial trucking operations — representing 25 to 35 percent of per-mile operating cost at current diesel prices. A carrier operating 100 trucks at 100,000 annual miles each at 7 miles per gallon spends approximately $5.7 million annually on diesel fuel at $4.00 per gallon. A 5 percent fuel efficiency improvement through driver behavior optimization, idle reduction, and engine performance monitoring represents $285,000 in annual savings — achievable without capital investment in new vehicles or equipment when existing sensor data is systematically analyzed and acted upon.
Fuel analytics from telematics data enables fleet managers to identify and act on the specific drivers of fuel inefficiency in their fleet: which specific drivers exhibit fuel-inefficient behavior patterns (rapid acceleration, high-speed operation, excessive idle time) that account for disproportionate consumption; which vehicles are consuming more fuel than expected for their route and payload profile, indicating potential engine or drivetrain maintenance issues; and which routes generate disproportionate fuel consumption due to road grade, traffic congestion, or load weight that informs route optimization decisions. FleetRabbit's analytics layer provides vehicle-level and driver-level fuel consumption visibility that enables dispatchers, fleet managers, and driver coaches to identify outliers and initiate focused improvement actions. Book a demo to review FleetRabbit's fuel analytics capabilities and estimate the potential fuel cost reduction for your fleet's specific profile.
Miles Per Gallon by Driver
Source: GPS miles driven + fuel card transaction data or ECM fuel burn rate
Fleet MPG benchmark versus individual driver MPG — drivers 10%+ below fleet average prioritized for fuel efficiency coaching. Adjust by route type to ensure fair comparison across highway versus regional route drivers.
Action: Targeted coaching for bottom-quartile fuel efficiency drivers — focus on RPM management, coasting utilization, speed selection, and anticipatory braking
Idle Time and Idle Fuel Cost
Source: ECM engine-on versus vehicle-speed-zero events, duration, and location
Commercial diesel engines consume 0.8 to 1.2 gallons per hour at idle. A driver idling 4 hours per day across 250 working days burns 800 to 1,200 gallons per year — $3,200 to $4,800 in pure idle fuel cost per driver. Fleet-level idle reduction from 25% to 10% of engine-on time can save $500 to $1,500 per truck annually.
Action: Set idle threshold alerts in telematics (typically 5-minute idle limit), track idle percentage by driver and terminal, implement APU utilization where overnight cab comfort requires engine-on time
High-Speed Operation Frequency
Source: GPS speed profile — time above threshold speed (typically 65 or 70 mph) by driver
Aerodynamic drag increases with the square of speed — a truck operating at 70 mph uses approximately 20% more fuel per mile than the same truck at 60 mph. Drivers who routinely operate above fleet speed policy cost the carrier materially more in fuel than compliant drivers on the same routes.
Action: Speed compliance analytics by driver with fleet manager review — integrate into driver performance scorecard alongside safety event frequency
Fuel Consumption vs. Route-Adjusted Benchmark
Source: ECM fuel burn + GPS route classification for grade and distance normalization
Vehicle-level fuel consumption that significantly exceeds the route-adjusted benchmark for similar vehicles on similar routes indicates a mechanical contributor — air filter restriction, DPF restriction, tire rolling resistance from under-inflation, or engine tune drift. These are maintenance issues, not driver behavior issues.
Action: Flag vehicles with persistent 8%+ above-benchmark fuel consumption for mechanical inspection — diagnose ECM fuel trim deviations, air system restriction, tire pressure audit
Driver Performance Scoring: Translating Sensor Data into Coaching Intelligence
Driver performance scoring systems that aggregate telematics behavior event data into composite scores serve two operational purposes: identifying which drivers need coaching attention and measuring whether coaching programs are producing measurable behavior improvement over time. Both purposes require consistent metric definitions, transparent scoring methodology that drivers understand, and sufficient data frequency to detect meaningful change rather than statistical noise. A driver coaching program that is based on telematics data but lacks a systematic scoring framework — where fleet managers review data intuitively and identify coaching targets qualitatively — is inconsistently applied, generates driver equity concerns, and cannot demonstrate improvement systematically to insurance underwriters or broker safety program reviewers.
FleetRabbit's driver management module integrates with telematics data to provide driver-level performance visibility that fleet managers use to structure coaching interactions with specific data rather than general impressions. Coaching conversations grounded in specific event data — "Your harsh braking events last month were 2.3 times the fleet average — let's look at where these are happening and discuss approach distance management" — are more actionable for drivers and more effective at producing behavior change than general discussions of driving quality. The measurement and trending capabilities allow fleet managers to confirm that coaching conversations produced observable data changes in the weeks following the coaching interaction, creating a feedback loop that both validates the coaching effectiveness and motivates continued improvement.
Safety Behaviors
40% of Score
Harsh Braking
Events per 100 miles — threshold typically 6G deceleration. Primary safety indicator for following distance and anticipation.
Rapid Acceleration
Aggressive throttle events that burn excess fuel and indicate aggressive operating style.
Speed Violations
Percentage of miles above fleet speed policy — differentiated by road type for fair comparison.
Fuel Efficiency Behaviors
30% of Score
MPG vs. Benchmark
Route-adjusted MPG versus fleet average for comparable route types — identifies consistent under-performers.
Idle Percentage
Engine-on hours with vehicle stationary as percentage of total engine-on time — excludes approved idle periods (APU unavailable in extreme weather).
High-RPM Operation
Time above optimal RPM range at cruise speed — indicates failure to use cruise control or gear selection inefficiency.
Compliance and Operations
30% of Score
HOS Compliance Rate
ELD violation frequency — hours over limit events and log editing frequency indicating potential HOS management issues.
DVIR Completion Rate
Pre-trip and post-trip DVIR submission compliance rate — from FleetRabbit digital DVIR completion records.
On-Time Performance
Pickup and delivery on-time rate versus committed windows — from GPS geofence and dispatch records.
Capital Planning Analytics: Using Fleet Data for Vehicle Replacement Decisions
Vehicle replacement decisions — determining when to retire an aging truck from the active fleet and place a capital order for a replacement — are among the most financially significant decisions fleet managers make. Poor replacement timing in either direction imposes real costs: premature replacement forgoes the remaining productive life and book value of vehicles that could continue serving cost-effectively, while delayed replacement of aging, high-maintenance vehicles generates disproportionate maintenance costs, roadside breakdown rates, and driver reliability issues that exceed the capital cost savings from extended vehicle life. Optimal replacement timing analysis requires fleet-level cost data that most carriers have historically not had in a structured analytical form — making replacement decisions based on operational impressions and mechanical experience rather than data-driven cost modeling.
FleetRabbit's maintenance cost analytics and vehicle-level cost tracking provide the structured data foundation for rigorous capital planning analytics. Total cost per mile by vehicle — combining fuel cost from telematics, maintenance cost from work order records, and downtime cost from out-of-service periods — identifies the specific vehicles in the fleet where the total operating cost per mile has crossed the threshold where replacement economics become favorable relative to continued operation. Vehicle cost trend analysis — plotting total cost per mile by vehicle over time — reveals the inflection points where costs begin accelerating due to age-related multi-system maintenance needs, providing advance warning that replacement should be planned in the next 6 to 18 months before the vehicle's cost trajectory becomes a fleet-wide performance drain.
| Vehicle ID |
Age / Miles |
Fuel $ / Mile |
Maint $ / Mile |
Downtime Days |
Total $ / Mile |
Recommendation |
| Fleet Avg (Reference) |
— |
$0.62 |
$0.14 |
— |
$0.76 |
Benchmark |
| Unit 4218 |
2 yrs / 280K mi |
$0.60 |
$0.11 |
3 days |
$0.71 |
Continue Operating |
| Unit 3891 |
5 yrs / 610K mi |
$0.65 |
$0.22 |
14 days |
$0.87 |
Plan Replacement 12-18 Months |
| Unit 3654 |
7 yrs / 820K mi |
$0.71 |
$0.31 |
28 days |
$1.02 |
Prioritize Replacement |
| Unit 3412 |
8 yrs / 940K mi |
$0.74 |
$0.38 |
41 days |
$1.12 |
Immediate Replacement Planning |
This framework is illustrative — actual vehicle economics depend on acquisition cost, residual value, financing terms, and route-specific wear rates. FleetRabbit's vehicle-level cost analytics provide the maintenance and operational cost data foundation for this analysis with your actual fleet's cost structure.
Frequently Asked Questions
QWhat data is actually needed to begin generating useful analytics insights, and do smaller fleets with basic telematics have enough data?
Even basic telematics systems providing GPS position, speed, and engine idle time generate enough data for the two highest-return analytics applications: driver behavior benchmarking and idle reduction analysis. Fleets with 15 or more vehicles and 60+ days of telematics data history have sufficient volume to generate statistically meaningful driver performance comparisons that identify behaviorally outlier drivers for coaching. Adding engine ECM data connectivity — available through J1939 integration on most telematics platforms with commercial vehicle hardware — expands the analytical capability to fuel consumption trending, fault code pattern analysis, and cooling system health monitoring. The minimum viable sensor data set for meaningful fleet analytics is: GPS position at standard intervals, speed, vehicle identification number (VIN) for asset matching, and either fuel card transaction data or ECM fuel burn rate. FleetRabbit's telematics integrations support multiple hardware providers at different capability levels — starting with available basic data and expanding analytics as richer data sources are connected.
Book a demo to review what analytics FleetRabbit can provide from your current telematics hardware configuration.
QHow should driver safety scoring be introduced to the driver workforce without creating resistance or equity concerns?
Driver performance scoring introduction requires transparency, consistency, and actionability to achieve driver acceptance rather than resistance. Drivers who understand exactly how their score is calculated, can see the specific events that affected their score, and receive coaching support focused on improvement accept scoring programs significantly better than drivers who receive opaque scores with no visibility into the underlying data. Pre-introduction actions that build acceptance: explain the scoring methodology in detail before launch, including the specific event definitions, thresholds, and weightings — hold a driver meeting where the scoring system is explained and questions are answered genuinely, not just rhetorically; announce that the first 60 to 90 days of scoring will be used only for baseline establishment and coaching, not for disciplinary purposes — this allows drivers to adjust behavior without fear before consequences are attached; and make scores visible to drivers themselves through the mobile app or driver portal, so they can see their own performance trends and monitor their own improvement. Managers who use scoring data for coaching first and enforcement second — moving to enforcement only after coaching has been consistently offered and not responded to — maintain driver trust while still creating accountability for systematic underperformance.
QWhat data integration is required between telematics platforms and FleetRabbit to enable analytics?
FleetRabbit integrates with telematics providers through API data connections that bring vehicle position, GPS speed, and driver event data into the fleet management platform from the telematics provider's data environment. The integration is configured during FleetRabbit onboarding by matching each vehicle in the FleetRabbit asset registry to its corresponding telematics device identifier — allowing telemetry data from the telematics platform to populate the correct vehicle record in FleetRabbit. The specific data fields accessible through the integration depend on the telematics provider's API capability — providers vary in what data they make available via API versus what is restricted to their own proprietary dashboard. FleetRabbit's implementation team can review which telematics providers in your fleet's current hardware mix support the data integration required for specific analytics applications. For fleets with mixed telematics hardware — multiple providers across different vehicle cohorts — FleetRabbit's integration framework can consolidate data from multiple providers into a single analytics view, which is a significant operational simplification for carriers who currently manage multiple telematics dashboards for different vehicle groups.
Convert Your Fleet's Sensor Data from Storage to Savings with FleetRabbit Analytics
FleetRabbit's analytics capabilities — integrated with your existing telematics hardware — identify the fuel savings, maintenance cost reductions, and capital planning intelligence that your sensor data is already generating, waiting to be translated into actionable fleet management decisions.
Telematics Data Integration
Fuel Analytics
Driver Performance Scoring
Predictive Maintenance
Capital Planning Analytics
Fleet Benchmarking
April 21, 2026
By Jason Smith
All Posts