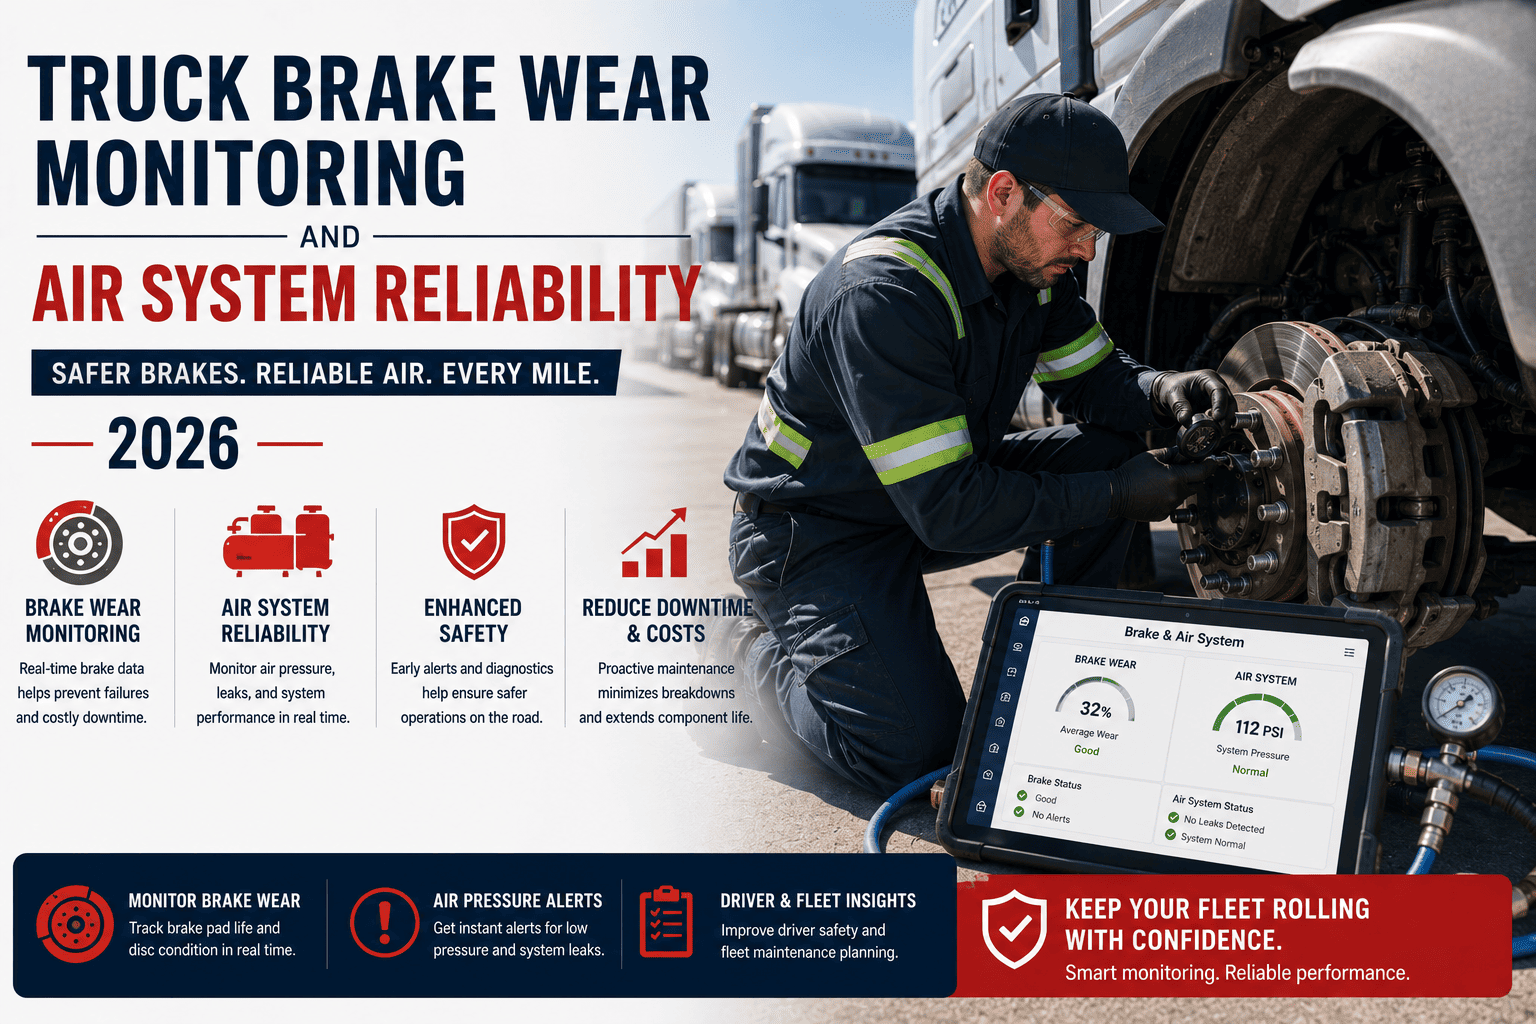
A truck rolling into a scale house with worn brake linings is one bad inspection away from an out-of-service order, a stranded load, and a dent in your CSA score that follows the fleet for two years. Brake and air system defects are still the single biggest reason commercial vehicles get pulled off the road at roadside checks, which makes brake wear monitoring less of a maintenance task and more of a survival skill for fleet managers in 2026.
This guide breaks down how brake wear actually progresses, why air systems fail quietly before they fail loudly, and how a structured monitoring program turns brakes from your biggest compliance risk into one of your most predictable assets. If you want to see how automated brake and air system tracking fits into your own fleet, you can sign up for FleetRabbit in a few minutes or book a demo to walk through it with our team first.
Brake and air system defects remain one of the top reasons trucks are placed out of service at roadside inspections, with recent brake-focused enforcement blitzes flagging 14 to 15 percent of inspected vehicles. Continuous brake wear monitoring, air leak detection, and scheduled lining checks catch problems before they trigger an out-of-service order, protect your CSA score, and keep trucks earning instead of sitting at the shop.
Why Brake Wear Still Tops the Violation List
Brakes fail the way most mechanical problems do: gradually, then suddenly. A lining that is fine in January can cross the danger threshold by March, and unless someone is actually measuring it, the first sign of trouble is often a roadside inspector holding a clipboard. Recent brake-focused enforcement events have consistently flagged brake systems as a leading cause of vehicles being pulled from service, and drum, rotor, and air system components remain a specific area of inspector attention.
The Regulation Behind the Number
Federal out-of-service criteria state that a vehicle must be removed from service once 20 percent or more of its service brakes are defective. That threshold sounds generous until you realize how quickly a handful of small, individually minor issues, like a slightly thin lining here and a slow air leak there, add up to cross it. Multiple small defects can trigger the same shutdown as one major failure.
What an Out-of-Service Order Actually Costs
The invoice for the repair is rarely the real cost. Between towing, emergency labor at premium rates, the load that gets re-dispatched or penalized for lateness, and the driver sitting idle, a single brake-related shutdown commonly runs into the thousands of dollars once everything is added up. Layer in the CSA scoring impact, which stays on a carrier's record for two years and can push up inspection frequency and insurance renewal costs, and one preventable brake defect turns into a cost that keeps compounding long after the tow truck leaves.
FleetRabbit tracks lining wear trends, air pressure readings, and inspection history in one place, so your maintenance team knows which trucks need attention before they hit a scale house. Sign up and connect your fleet in minutes, or book a demo and we'll show you exactly how it works with your vehicles.
The Four Stages of Brake Wear
Every brake failure passes through the same four stages. Fleets that monitor for stage one and two catch problems while they're a cheap fix. Fleets that only look at brakes during scheduled service tend to discover stage three or four, which is where the expensive, unplanned repairs live.
Air System Reliability: The Part Drivers Can't See
Linings get visual attention because they're easy to picture. Air systems get overlooked because a slow leak doesn't look like anything at all, right up until an air loss rate test fails at a weigh station or a low-air warning fires on the highway. Compressors, valves, hoses, and chambers all need to hold pressure precisely, and inspectors specifically check air loss rates, hose and tubing condition, and warning devices during brake-focused inspection events.
Where Air Systems Typically Fail First
Hose and tubing connections loosen with vibration over time. Chamber diaphragms degrade with heat cycling. Compressors lose efficiency as they age, taking longer to build pressure, which shows up as slower brake response that drivers may write off as normal rather than reporting it.
A Simple Way to Think About It
If lining wear is about how much material is left, air system health is about how tightly the system holds pressure. Both degrade gradually, both are measurable, and both are far cheaper to fix on a schedule than to fix after a failure.
| Component | Recommended Check Frequency | Early Warning Sign | Why It Matters |
|---|---|---|---|
| Brake Linings & Pads | Every PM service or 15,000-25,000 miles | Thickness approaching manufacturer minimum | Directly tied to the 20% defective brake out-of-service rule |
| Drums & Rotors | Every scheduled brake inspection | Cracking, scoring, or heat discoloration | A specific focus area during recent brake safety enforcement events |
| Air Hoses & Tubing | Monthly visual, annual pressure test | Chafing, cracking, or audible leaks | A leading cause of air system out-of-service violations |
| Air Compressor | Quarterly build-time check | Slower time to reach operating pressure | Early sign of overall system strain before failure |
| Low-Air Warning Device | Every pre-trip and PM service | Delayed or missing alert at threshold pressure | A confirmed out-of-service violation if inoperative |
| Slack Adjusters | Every PM service | Excess stroke or out-of-adjustment reading | Common contributor to the 20% defective brake threshold |
Building a Brake Monitoring Program That Actually Holds Up
Fleets that keep brake-related out-of-service events rare tend to run the same four-step approach, whether they manage five trucks or five hundred.
Manual Checks vs. Continuous Monitoring
Both approaches can technically satisfy inspection requirements, but they behave very differently between service visits, which is exactly when most wear-related surprises happen.
| Factor | Manual Periodic Checks | Continuous Digital Monitoring |
|---|---|---|
| Detection Timing | Only at scheduled inspection intervals | Ongoing, between service visits |
| Wear Trend Visibility | Limited to notes from the last visit | Full history showing rate of change |
| Fleet-Wide View | Requires manually compiling records | Centralized dashboard across all vehicles |
| Compliance Documentation | Paper or scattered digital files | Automatic, audit-ready digital records |
FleetRabbit centralizes brake wear trends, air system readings, and inspection records so nothing slips through between service visits. Sign up today to start tracking your fleet, or book a demo to see the dashboard your team would actually use every day.
Frequently Asked Questions
Every mile between service visits is a mile where lining wear and air pressure keep changing without anyone watching. FleetRabbit gives your team continuous visibility into brake and air system health, so problems get scheduled instead of discovered at roadside.







