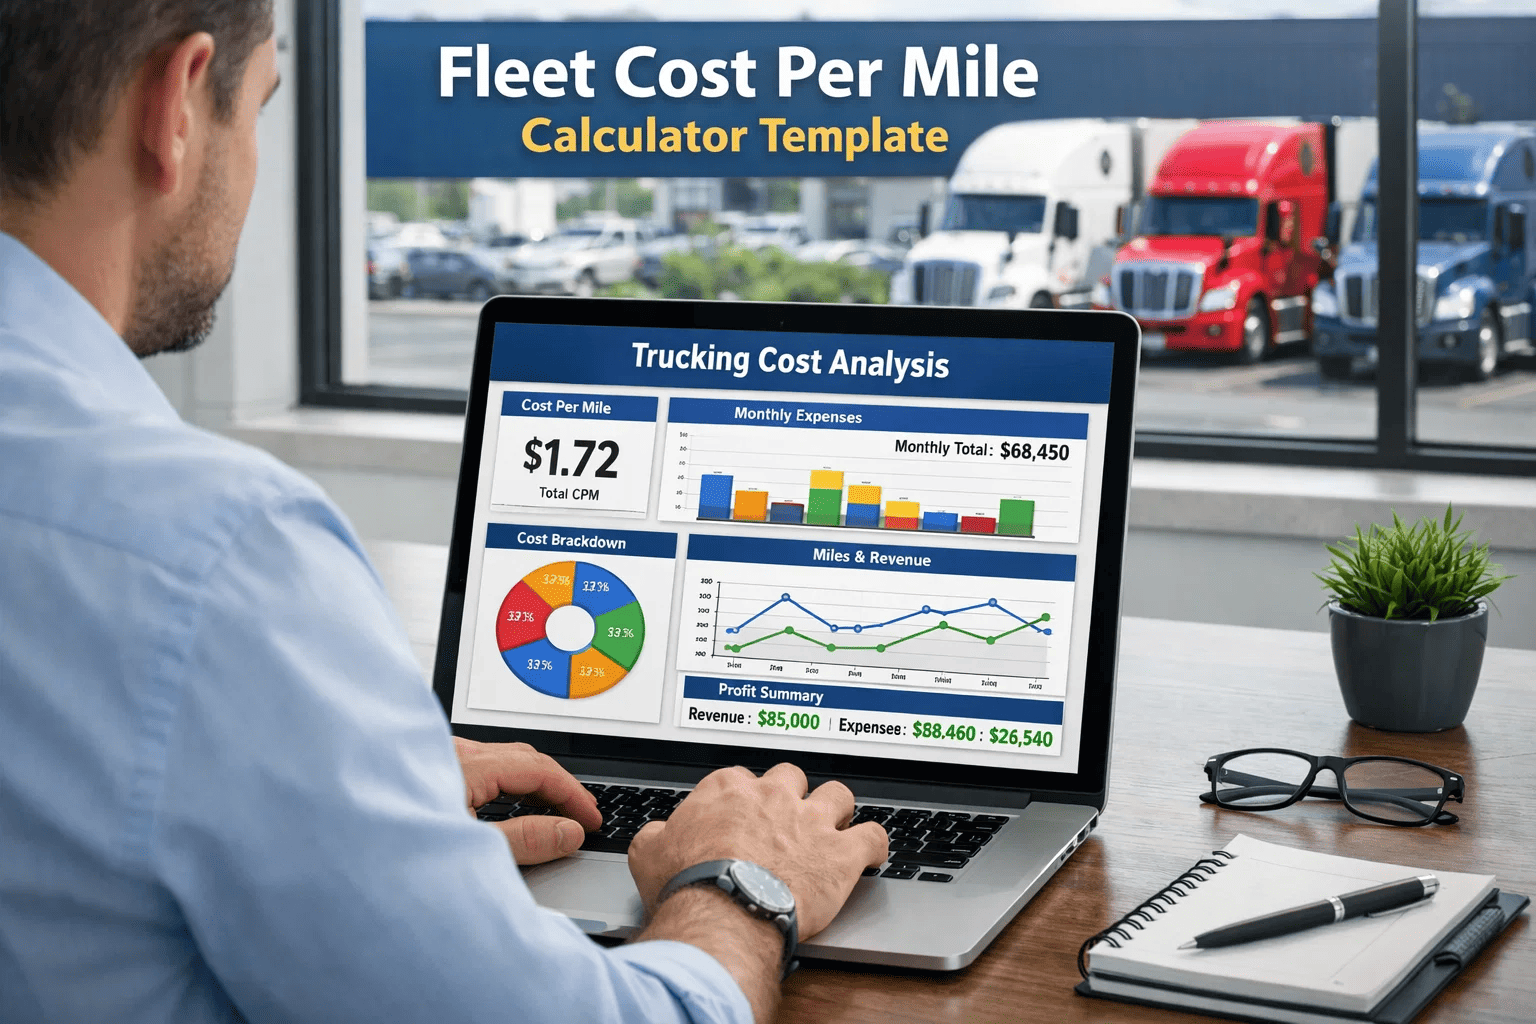
Cost per mile is the single financial metric that determines whether a trucking fleet operation is sustainable. Fleets that can't calculate true cost per mile accurately — separating fixed costs from variable costs, allocating fuel and maintenance by unit — consistently underbid contracts, misidentify high-cost vehicles, and make hold-or-replace decisions based on incomplete data. FleetRabbit connects the operational data sources that make cost per mile transparent: GPS mileage, fuel card transactions, work order parts and labor costs, and PM service records — providing the per-vehicle cost clarity that financial management requires. This guide walks through every cost component that belongs in a trucking fleet cost-per-mile calculation. Book a demo to see fleet cost analytics in action.
$0.42–$0.58
Typical Total Cost Per Mile — Class 8 Trucks
25–40%
Of Total Cost: Fuel Expenses
12–18%
Of Total Cost: Maintenance and Repairs
8–15%
Fuel Savings With FleetRabbit Year 1
The Cost Per Mile Formula — Every Component Explained
True cost per mile requires dividing total operating costs by revenue miles driven — not total miles. Each cost category below must be tracked and allocated accurately to produce a reliable figure.
Fixed Costs
Per mile cost decreases as miles increase
Truck Depreciation or Lease Payment
Spread truck purchase cost over useful life. Example: $140,000 truck, 500,000 mile life = $0.28/mi base depreciation. Lease payments divided by expected monthly miles give the same result.
Typical range: $0.18–$0.35/mi
Insurance (Commercial Auto + Cargo)
Annual premium divided by annual miles. CSA score directly affects premium — a 10-point CSA increase adds 8–15% to commercial auto liability rates. FleetRabbit compliance tools protect the score that controls this cost.
Typical range: $0.06–$0.12/mi
Fleet Management Software and Technology
Monthly platform fees divided by fleet miles. At scale, fleet management software costs $0.002–$0.008/mi — and delivers fuel savings, downtime reduction, and compliance protection worth 30–60x the platform cost annually.
Typical range: $0.002–$0.008/mi
Driver Fixed Compensation (Salary Base)
For salary or day-rate driver compensation structures, the fixed component is spread across miles driven. Combined driver cost (wages + benefits + payroll taxes) typically represents 28–35% of total operating cost — the largest single expense category.
Typical range: $0.14–$0.22/mi
Variable Costs
Per mile cost is relatively constant regardless of total miles
Fuel Cost Per Mile
Diesel cost divided by miles per gallon. At 6.5 MPG and $3.80/gallon, fuel costs $0.585/gallon-mile. Idle reduction, route optimisation, and driver coaching through FleetRabbit drive 8–15% fuel savings — $0.047–$0.088/mi reduction at current prices.
Typical range: $0.16–$0.22/mi (varies with diesel price)
Maintenance and Repair Cost
All parts and labor costs divided by miles. Fleets with proactive PM management average $0.06–$0.10/mi. Reactive fleets run $0.10–$0.18/mi. FleetRabbit's PM scheduling drives the shift to proactive — reducing per-mile maintenance cost 30–40% within 12 months.
Typical range: $0.06–$0.18/mi depending on PM discipline
Tires
New tire cost plus recapping costs divided by expected miles per tire set. Include mounting, balancing, and disposal. A well-managed tire program with proper inflation monitoring adds 15–20% to tire life — directly reducing this per-mile cost component.
Typical range: $0.02–$0.04/mi
Tolls, Permits, and Regulatory Fees
Toll costs from route data, oversize/overweight permits, IFTA fuel tax, and IRP registration fees allocated to operating miles. Often underestimated — these costs can add $0.03–$0.08/mi for fleets operating in high-toll corridors or running specialty freight.
Typical range: $0.03–$0.08/mi
Cost Per Mile by Vehicle — Finding Your Hidden High-Cost Units
Fleet-wide cost per mile averages hide the outliers that are consuming disproportionate resources. FleetRabbit calculates cost per mile at the unit level — automatically — so fleet executives can identify trucks that are costing 40–80% more per mile than fleet average and make informed hold-or-replace decisions.
| Unit |
Annual Miles |
Fuel Cost |
Maintenance |
Cost Per Mile |
Status |
| Unit 04 |
98,400 |
$15,820 |
$6,200 |
$0.41 |
Efficient |
| Unit 11 |
94,200 |
$16,100 |
$7,840 |
$0.45 |
Benchmark |
| Unit 22 |
78,600 |
$15,400 |
$18,200 |
$0.68 |
Review |
| Unit 07 |
102,800 |
$16,800 |
$5,900 |
$0.39 |
Efficient |
Unit 22 costing 66% more per mile than Unit 07 — FleetRabbit surfaces this comparison automatically. Without per-unit data, both appear in the same average.
FleetRabbit Cost Analytics
Get Accurate Cost Per Mile at the Unit Level — Automatically
FleetRabbit pulls GPS mileage, fuel card transactions, and work order costs into automated cost-per-mile calculations by truck — giving fleet executives the unit-level visibility that identifies high-cost outliers and validates hold-or-replace decisions with real financial data. No manual spreadsheet updates, no cost estimation, and no hidden maintenance drains that inflate your bids. Book a personalized demo to see cost analytics applied to your fleet size.
24%
Avg Cost Per Mile Reduction
100%
Units Tracked Automatically
Frequently Asked Questions — Cost Per Mile
QWhat is the difference between "total miles" and "revenue miles" in CPM?
Total miles includes every mile the truck moves, including "deadhead" (empty) miles. Revenue miles are only those driven while carrying a load for a customer. Calculating cost per mile against revenue miles is more accurate for determining profitability, as it reveals the true cost of generating every dollar of income.
See revenue mile reporting in a demo.
QDoes driver behavior really impact cost per mile by significant margins?
Yes. Driver behavior—specifically speed management, idle time, and harsh braking—can create a 15–20% variance in fuel and maintenance costs between two identical trucks. Fleets using FleetRabbit to coach drivers on high-cost behaviors typically see their variable CPM drop by $0.04–$0.07 within six months.
QHow should I calculate depreciation for a truck that is already paid off?
Even for paid-off vehicles, you should continue to account for "replacement cost" depreciation. Setting aside a per-mile figure (e.g., $0.15/mi) ensures your business is generating the cash flow needed to fund the purchase of a replacement unit once the current vehicle reaches its end-of-life status.
QHow often should a fleet manager audit their cost-per-mile data?
Monthly audits are the industry standard. Annual reviews are too slow to catch spikes in fuel prices or recurring maintenance issues on specific units. FleetRabbit eliminates the audit burden by calculating these figures in real-time, allowing you to see cost trends as they happen.
QCan FleetRabbit integrate with my fuel card provider for automatic cost tracking?
Yes. FleetRabbit integrates with major fuel card providers (WEX, Comdata, etc.) to pull transaction data automatically. This connects your actual fuel spend directly to vehicle mileage data, providing a 100% accurate fuel cost per mile without any manual spreadsheet entry.
April 9, 2026
By Smith
All Posts