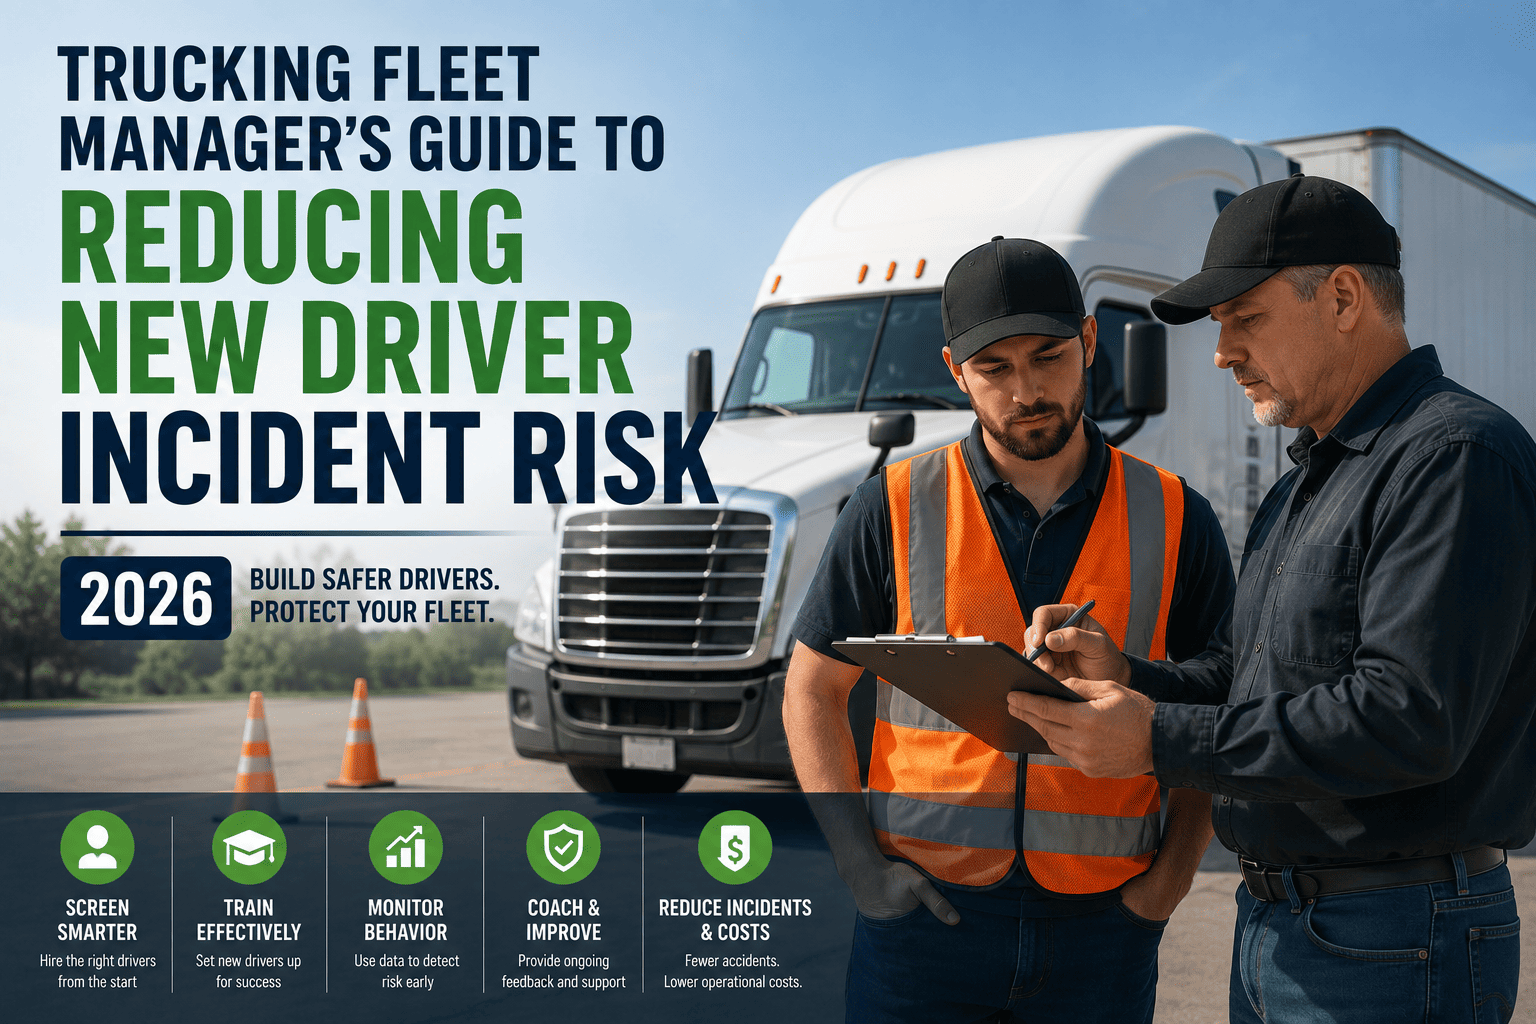
New drivers are the single biggest risk variable on any trucking fleet's roster, yet most safety budgets are still built around the experienced driver who already knows how to read traffic, weather, and fatigue. Research on commercial driver crash data shows that drivers with less than five years of experience are 41 percent more likely to be the cause of a serious truck crash than drivers with more than five years behind the wheel. That gap does not close on its own. It closes when fleet managers build a deliberate system of onboarding, coaching, and real-time monitoring around every driver's first year on the job. This guide breaks down exactly where new-driver risk comes from, how to measure it, and what a modern risk-reduction program looks like in 2026.
Drivers with under five years of experience cause 41 percent more crashes than veteran drivers, and carrier-recorded data shows drivers with less than one year on the job post the highest crash rates of any experience group. Fleets that pair structured onboarding with AI-powered driver monitoring cut new-driver incident rates significantly within the first 90 days, protecting both drivers and the bottom line.
Why New Drivers Carry More Risk Than Veterans
Fleet safety data consistently points to the same pattern across carrier types and regions. Drivers in their first year of employment, regardless of age, post the highest average crash rates of any experience group, and that risk stays elevated until a driver accumulates real road time under real operating conditions. Part of this comes down to raw experience: a veteran driver has already seen the icy on-ramp, the aggressive four-way stop, and the sudden lane closure dozens of times, while a new driver is seeing each of these for the first time on a live route with a loaded trailer. Part of it comes down to how carriers introduce new drivers to the job. When onboarding consists of a short classroom session and a handful of supervised miles, drivers are effectively learning many of their real-world lessons through trial and error on public roads.
Driver turnover compounds the problem. Research analyzing motor carrier crash records found that crash risk begins climbing once a driver averages more than two employers per year, and the odds of multiple crashes more than double for drivers cycling through three or more jobs annually. Every time a driver changes carriers, they restart the experience clock on that carrier's routes, equipment, and expectations, even if their overall years of driving remain the same. Fleets with high turnover are, in effect, running a fleet full of new drivers year-round, which is why retention and onboarding quality are inseparable from incident-rate performance.
The First 90 Days Carry The Most Risk
Carrier safety data shows incident likelihood is not evenly spread across a new driver's first year. It is heavily concentrated in the earliest weeks, then declines steadily as the driver accumulates supervised and independent miles. Mapping that curve helps fleet managers decide exactly when to apply the heaviest coaching and monitoring resources.
FleetRabbit's AI-powered driver monitoring flags risky patterns as they happen, so coaches can step in before a habit becomes an incident. Sign up free and start protecting your newest hires today.
New Drivers Versus Veteran Drivers: The Risk Gap
Putting hard numbers side by side makes it easier to justify investment in onboarding and monitoring technology. The table below compares typical risk indicators between drivers in their first year and drivers with five or more years of tenure, based on patterns reported across carrier safety studies.
| Risk Indicator | New Driver (Under 1 Year) | Veteran Driver (5+ Years) | What It Means For Fleets |
|---|---|---|---|
| Preventable Crash Likelihood | Significantly elevated | Baseline reference level | New hires need closer supervision until their scorecard stabilizes near the fleet average |
| Hard Braking Frequency | Higher during first 90 days | Lower, more consistent | Real-time alerts help new drivers correct following distance before a pattern forms |
| Route Familiarity Errors | Common in first 30 days | Rare | Progressive route assignment reduces navigation-driven mistakes |
| Fatigue-Related Events | Elevated, often underreported | Lower, better self-management | New drivers may not yet trust the process for reporting fatigue honestly |
| Job Change Frequency | Higher turnover risk | Lower turnover | Crash odds more than double for drivers averaging three or more employers per year |
Building An Onboarding Program That Actually Reduces Risk
A handbook and a single ride-along are not an onboarding program, they are a formality. Fleets that meaningfully reduce new-driver incident rates treat the first 90 days as a structured, measurable process rather than a box to check before a driver is turned loose on their own.
Structured Ride-Alongs And Mentorship
Pairing new drivers with a trained mentor for a defined number of supervised miles, not just a symbolic day or two, gives them a chance to absorb hazard recognition and route knowledge from someone who has already made the mistakes. Mentors should be trained to give specific, behavior-based feedback rather than general encouragement, and mentorship performance should feed directly into how ready a new driver is considered for independent routes.
Progressive Route Complexity
New drivers should not be handed the same congested urban route or mountain grade as a ten-year veteran in their first week. Assigning simpler, lower-risk routes first and progressively increasing complexity as scorecards improve lets drivers build confidence and skill without being thrown into the highest-risk conditions before they are ready.
Continuous Coaching, Not One-Time Training
Classroom training teaches rules. Coaching changes behavior. The difference matters most in the first 90 days, when small corrections, delivered quickly and tied to real driving events, prevent bad habits from ever taking hold. Fleets using continuous, data-driven coaching consistently see faster improvement curves than fleets relying on annual refresher training alone.
How AI-Powered Monitoring Closes The Experience Gap
Technology cannot replace time behind the wheel, but it can compress the learning curve dramatically by catching risky patterns while they are still cheap to fix. FleetRabbit's driver monitoring platform gives fleet managers visibility into exactly the behaviors that drive new-driver risk, without requiring a supervisor to ride along for every mile.
Real-Time Risk Alerts
In-cab monitoring detects drowsy driving, distraction, following distance, and harsh events as they happen, giving both the driver and the safety team a chance to correct course immediately rather than discovering the pattern weeks later in a report.
Automated Coaching Scorecards
Every new driver gets an individual scorecard that tracks improvement week over week, so coaches can focus their limited time on the drivers and behaviors that need it most instead of reviewing every driver equally.
Driver Risk Scoring
Composite risk scores combine driving behavior, hours of service patterns, and historical trends to flag which new hires need additional mentorship before they are cleared for higher-complexity routes.
Onboarding Workflow Tracking
Digital checklists ensure every new driver actually completes each stage of onboarding, from documentation to supervised miles, so nothing gets skipped when hiring volume is high.
Metrics Fleet Managers Should Track For New Drivers
You cannot manage what you do not measure. Fleets that reduce new-driver incident rates consistently track a small set of leading indicators rather than waiting for lagging crash data to tell the story after the fact. Track incidents per 100,000 miles broken out separately for drivers under one year of tenure, so new-hire performance does not get averaged into the fleet total and hidden from view. Track coaching completion rate, meaning the percentage of flagged events that actually receive a documented coaching conversation within 48 hours. Track 90-day scorecard trendlines for every new hire, watching for drivers whose risk score is not improving on the expected curve. Track turnover-adjusted risk, since a driver who leaves and rejoins the workforce elsewhere resets their experience clock and re-enters the highest-risk category regardless of prior tenure.
FleetRabbit combines real-time monitoring, automated scorecards, and onboarding workflows in one platform built for fleets that are serious about cutting new-driver incident rates. Book a 30-minute demo and see it applied to your own driver roster.
Key Takeaways For Fleet Managers
New-driver risk is not random, and it is not something fleets have to simply absorb as a cost of hiring. It follows a predictable curve that peaks in the first 30 days and declines as drivers gain structured, supervised experience. Fleets that treat onboarding as a measurable process, pairing new hires with mentors, assigning routes progressively, and coaching continuously rather than annually, see faster improvement and fewer preventable incidents. Fleets that layer AI-powered monitoring on top of that process catch risky patterns while they are still correctable, instead of finding out about them after a claim is filed.
The math is straightforward. A fleet that shortens its new-driver risk curve even modestly protects drivers, reduces claims exposure, and improves retention, since drivers who feel genuinely supported in their first months are less likely to leave and restart the risk clock somewhere else. The tools to build this kind of program exist today, and putting them to work starts with visibility into what is actually happening on the road with your newest hires.
FleetRabbit helps fleet managers turn the riskiest 90 days of a driver's career into a structured, monitored, and coachable process. Real-time alerts, automated scorecards, and onboarding workflows work together to close the experience gap faster and protect your fleet's safety record.







