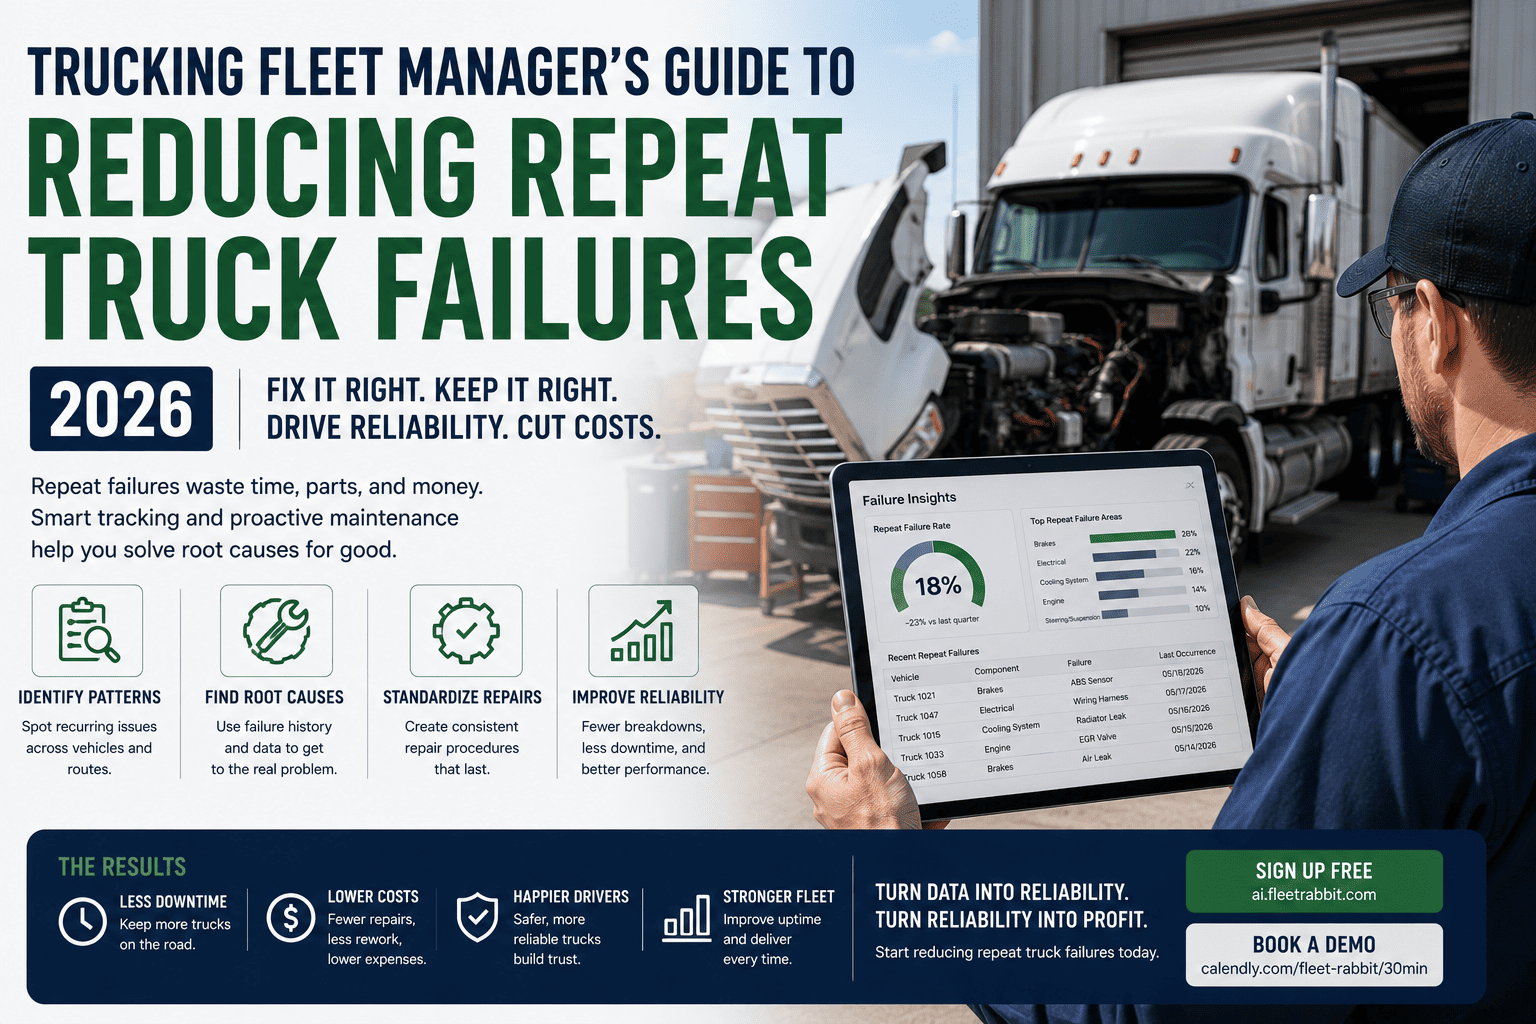
Every fleet manager knows the feeling. The same truck rolls back into the shop for the third time this quarter, the same warning light, the same component, the same excuse. Technicians replace the part, close the work order, and move on, yet weeks later the truck is back. Repeat truck failures are not bad luck. They are a signal that repairs are treating symptoms instead of causes, and that gap quietly drains fleet budgets all year long.
Roughly 4 in 10 vehicle repairs across fleets are repeat occurrences of a failure that was never actually solved. Trucks stuck in this cycle cost 3 to 5 times more than a truck fixed right the first time, once towing, expedited parts, and missed deliveries are counted. Fleets that adopt root cause analysis and maintenance history tracking cut repeat failures by 35 to 60 percent within a year.
Why The Same Truck Keeps Coming Back
Repeat truck failures almost never happen because a part was defective in isolation. They happen because the underlying reason a component failed early was never investigated. A technician sees a check engine light, finds a fault code, replaces the sensor, and clears the ticket. Nobody asks whether that sensor failed because of vibration, heat, a wiring short, or a systemic issue affecting every truck of that model in the yard. Without that question, the fix is temporary and the failure mode is still active, waiting to show up again on the same truck or a sister vehicle.
This pattern compounds across a fleet quickly. If ten trucks share the same duty cycle, route conditions, or parts supplier, a hidden cause affecting one vehicle is often already affecting several others that simply have not failed yet. Reactive shops treat each visit as an isolated event, so they never connect the dots between truck 12's turbocharger failure last month and truck 27's identical failure this week. That blind spot is exactly where repeat failure costs hide.
The Real Price Of An Unsolved Failure
A single unresolved failure mode rarely shows up as one clean number on a report. It shows up as three or four smaller repair bills spread across months, each one looking unrelated until someone lines them up side by side. Add in the missed delivery windows, the emergency parts markup, and the driver left waiting on the shoulder, and one unsolved root cause can quietly cost a fleet tens of thousands of dollars a year without ever appearing as a single alarming line item.
| Approach | What Happens | Typical Outcome | Cost Over 12 Months |
|---|---|---|---|
| Symptom-Only Repair | Failed part is replaced, ticket closed, no investigation into why it failed | Same failure returns within weeks or months | 3 to 6 repeat repairs per component per year |
| Root Cause Investigation | Technician asks why the part failed early using structured questioning | Underlying issue identified and corrected once | 1 permanent fix, no recurrence |
| Fleet-Level Pattern Review | Failure history compared across similar trucks, routes, and suppliers | Systemic issues caught before they spread | Prevents failures on 3 to 8 additional vehicles |
| Predictive Monitoring | Telematics flags abnormal readings before the component fully fails | Repairs scheduled before a breakdown occurs | 35 to 50 percent fewer unplanned incidents |
FleetRabbit links every work order, part, and vehicle together so repeat failure patterns surface automatically instead of hiding in separate paper tickets. Fleet managers who want to see exactly where their money keeps disappearing can start a free trial in minutes.
Two Simple Methods To Find The Real Cause
Finding the actual reason a truck keeps failing does not require an engineering degree. It requires a habit of asking one more question before closing a work order. Two methods, borrowed from manufacturing reliability programs, work exceptionally well inside a trucking shop because they are fast, structured, and easy for any technician to follow.
The Five Whys Method
The five whys technique simply asks why a failure happened, then asks why again about that answer, repeating until the true cause surfaces instead of stopping at the first obvious explanation. A turbocharger failing is a symptom. Asking why it failed might reveal oil starvation. Asking why that happened might reveal a clogged filter. Asking why the filter clogged might reveal an overdue service interval that was quietly being skipped fleet-wide. That final answer is the one worth fixing.
How To Apply It On The Shop Floor
Keep it to five questions or fewer, write down each answer on the work order itself, and stop once the answer points to a process, part quality, or maintenance interval rather than a vague coincidence. This turns a single repair ticket into a permanent record other technicians can learn from later.
The Fishbone Or 6M Framework
Where the five whys drills straight down one path, the fishbone approach maps every possible contributing factor across six categories, commonly called the 6Ms: man, method, machine, material, measurement, and environment. For a recurring brake failure, this means checking driver habits, service procedures, the component itself, the parts batch, the inspection process, and route conditions like grade and load, all at once. Complex, multi-truck failure patterns respond better to this wider view than a single narrow question chain.
Tracking The Metrics That Reveal Repeat Failures
You cannot fix what you cannot see, and repeat failures hide easily inside scattered paper tickets or disconnected spreadsheets. A handful of metrics, tracked consistently, expose the pattern long before it becomes an expensive habit.
How Technology Closes The Loop
Manual root cause reviews work, but they depend entirely on someone remembering that a similar failure happened before and taking the time to write it down consistently. Fleet management software removes that dependency by keeping every work order, part number, technician note, and mileage reading in one searchable record tied to the vehicle. When the same fault code shows up again, the pattern is visible instantly instead of relying on a technician's memory of a truck they serviced two months ago.
Telematics adds another layer by flagging abnormal engine, brake, and electrical readings days or weeks before a component actually fails, which gives maintenance teams the chance to schedule a proper root cause inspection instead of reacting to a roadside call. Fleets combining structured root cause habits with digital history tracking and telematics alerts consistently report the steepest drop in repeat failures, often cutting them in half within the first year. Teams ready to see this in their own fleet can book a personalized demo and walk through their own repair history live.
FleetRabbit connects work orders, parts history, and telematics alerts so your team catches recurring failure patterns before the third breakdown, not after it. Get the full picture of every vehicle's repair history in one dashboard.
Frequently Asked Questions
Every repeat breakdown is a signal that the real cause was never found. FleetRabbit gives your team the repair history, pattern detection, and predictive alerts needed to fix problems for good instead of patching them again next month. Start free and see your first repeat failure pattern today.







