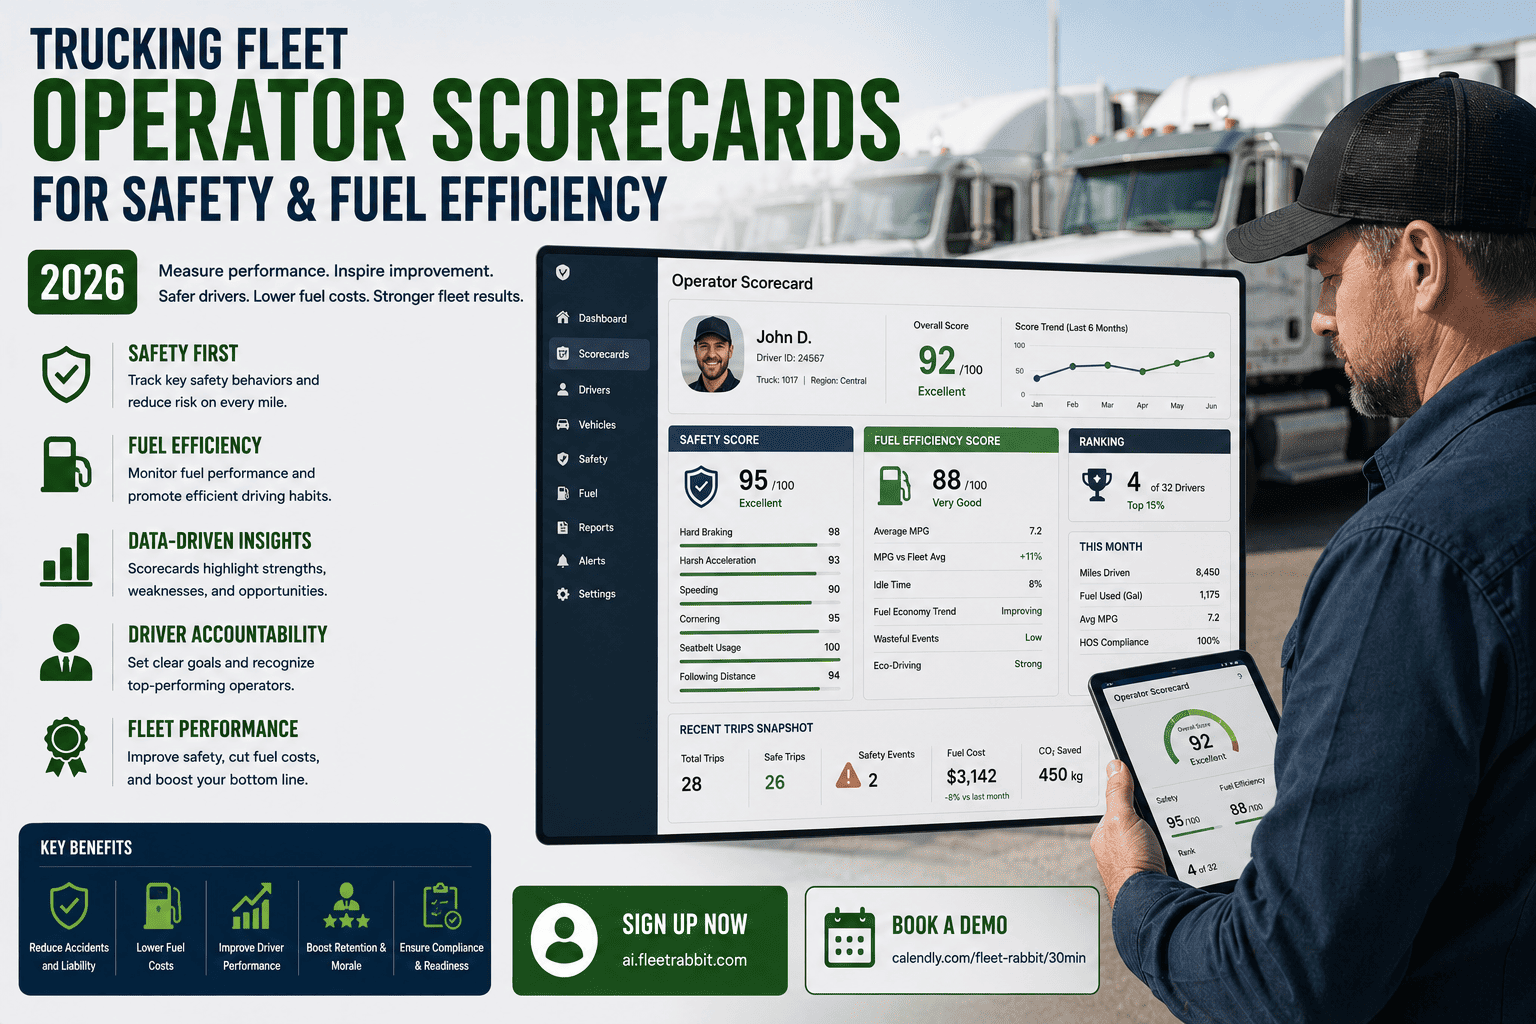
Two drivers can run the identical route in identical trucks and post fuel economy numbers that differ by 20 percent or more. The truck is not the variable. The person behind the wheel is. Aggressive acceleration, harsh braking, and excess idling quietly drain fuel and accelerate wear long before they show up as a maintenance bill or an insurance claim, and most fleets have no consistent way to see it happening until the damage is already done. An operator scorecard changes that by turning raw telematics data into a clear, driver-by-driver picture of safety and efficiency that everyone can act on.
Drivers with frequent idling and harsh acceleration or braking events burn 18 to 25 percent more fuel per mile than top-tier drivers on the same routes. Fleets running structured scorecard and coaching programs report accident rate reductions of up to 40 percent, safety violation drops of roughly 50 percent within six months, and fuel cost reductions of 10 to 30 percent from eliminated harsh events and idling alone. On a 25-truck fleet, coaching just five below-average drivers can recover roughly 55,000 dollars a year.
What a Real Operator Scorecard Actually Measures
A scorecard is only as useful as the behaviors it tracks. The strongest programs go beyond a single overall score and break performance into the specific categories that drive cost, so a fleet manager can see exactly what is dragging a driver's number down and coach that behavior directly.
Why the Same Route Produces Different Fuel Bills
Vehicle specifications matter, but the person driving matters more. A new truck might deliver a modest bump in fuel economy on paper, while the driver behind the wheel can swing that same number by 30 percent in either direction through acceleration habits, cruising speed, and how long the engine idles at a stop. Aggressive driving alone has been shown to cut fuel mileage by 15 to 30 percent on highways and as much as 10 to 40 percent in stop-and-go traffic.
Where the Waste Actually Hides
Idling is one of the most overlooked sources of fuel waste because it does not feel like driving at all. A truck sitting at a dock or a red light with the engine running is still burning close to a gallon an hour, and across a fleet of even twenty trucks that adds up to a meaningful line item every single month.
The Coaching Opportunity Hiding in the Data
A driver whose fuel economy sits well below the fleet average and whose harsh-event count sits well above it is not a mystery. It is a coaching opportunity that a scorecard makes visible immediately, instead of it staying buried in a fuel card statement nobody cross-references against driving behavior.
FleetRabbit builds a scorecard for every driver combining harsh events, idle time, fuel economy, and compliance data into one clear view. You can sign up for FleetRabbit and start scoring your fleet today, or book a demo to see a sample scorecard walked through live.
What Structured Coaching Actually Delivers
Data alone does not change behavior. It has to be paired with feedback drivers can actually use, ideally close to the moment the event happened rather than weeks later in a general performance review. Fleets that pair scorecards with a consistent coaching loop see results that fleets running scorecards alone simply do not.
| Outcome | Typical Result | Timeframe | Primary Driver of Change |
|---|---|---|---|
| Accident Rate | Reductions of up to 40 percent | Within the first year of coaching | Reduced harsh braking and speeding events |
| Safety Violations | Roughly 50 percent reduction | Within six months | Targeted coaching on chronic behavior patterns |
| Fuel Costs | 10 to 30 percent reduction | Ongoing, compounding monthly | Eliminated harsh acceleration and reduced idling |
| Insurance Premiums | Average discounts near 12 percent | At policy renewal | Documented, active monitoring and coaching program |
Build a Coaching Loop, Not a One-Time Report
The fleets seeing the biggest gains are not the ones simply generating a scorecard and filing it away. They run a repeating cycle: review the data, flag the chronic patterns, deliver specific coaching tied to a real event, and check the score again the following week. That loop is what separates measurable improvement from a dashboard nobody opens.
Make It a Scoreboard, Not Surveillance
Drivers respond very differently to data that feels like a fair, transparent scoreboard compared to data that feels like a watchful eye. Sharing scorecards openly, recognizing top performers, and using the same data to defend drivers against false claims all build trust in the system instead of resentment toward it.
FleetRabbit pairs every scorecard with clear, event-level detail so coaching conversations are specific instead of generic. Book a free demo to see how the coaching workflow fits into your weekly routine, or sign up now to start building your fleet's first scorecard.
Frequently Asked Questions
The question is whether your fleet is turning that data into a scorecard your team can act on. FleetRabbit brings safety events, fuel economy, and idle time together into one clear picture for every driver. Explore the platform with a free sign-up or walk through a live scorecard with our team.







