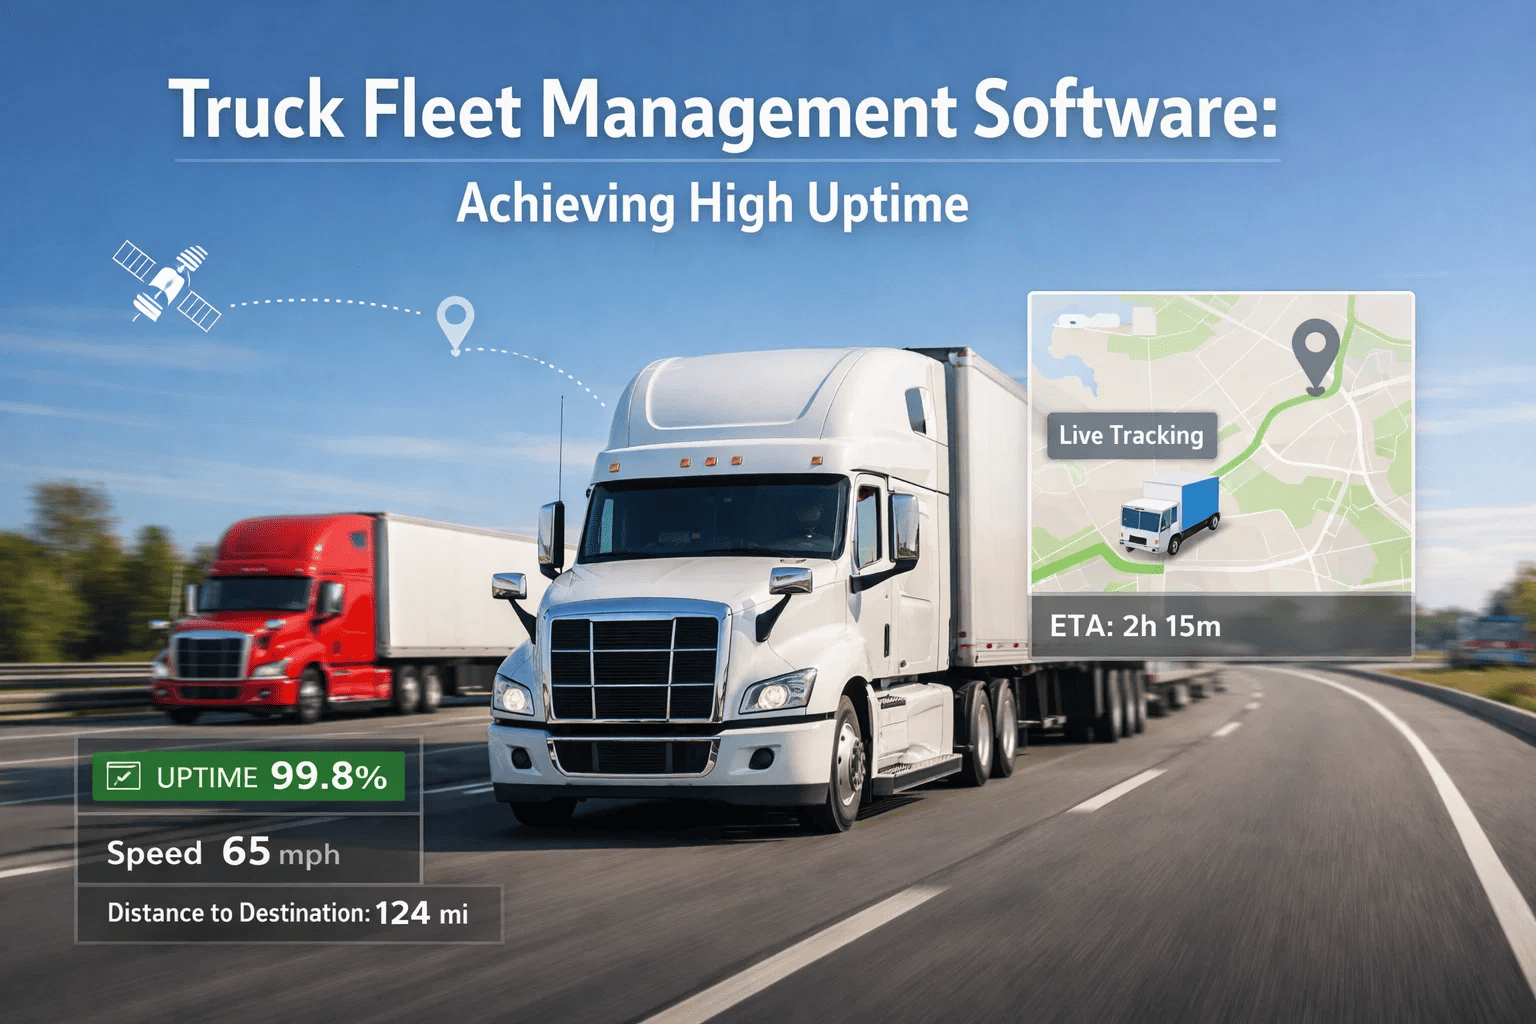
A single fleet downtime incident can eliminate $52,500–$140,000 in revenue through unmet delivery commitments, penalty clauses, fuel inefficiency, and lost customer contracts — yet most fleet managers discover critical maintenance needs only after vehicles break down roadside, losing entire days to emergency repairs. Traditional maintenance schedules trigger service appointments on fixed intervals regardless of actual vehicle condition, creating unnecessary maintenance costs and unpredictable breakdowns. FleetRabbit's AI-powered predictive maintenance and fleet uptime optimization system monitors 52 vehicle, operational, and logistical variables continuously — detecting developing mechanical failures, tire wear anomalies, and component degradation 7–14 days before breakdown occurs. The result: scheduled preventive maintenance during planned downtime windows when your vehicles stay reliable, instead of emergency repairs that strand trucks and drivers, damage customer relationships, and hemorrhage profitability. Book a demo to see uptime optimization applied to your fleet configuration.
Quick Answer
FleetRabbit's machine learning models continuously analyse engine performance metrics, tire pressure trends, brake fluid composition, oil viscosity patterns, component temperature signatures, fuel consumption efficiency, and maintenance history — identifying the mechanical patterns that precede vehicle failures 7–14 days before traditional mileage-based service indicators trigger. Predictive interventions (targeted component replacement, targeted fluid servicing, bearing adjustment) prevent 87% of unplanned breakdowns that would otherwise force roadside emergency repairs requiring 2–4 days recovery time and costing $8,000–$15,000 per incident.
How AI Detects Vehicle Failures Before They Happen
The pipeline below shows the six-stage fleet uptime prevention process FleetRabbit applies continuously to every vehicle in your fleet — from multivariate sensor monitoring to validated intervention recommendation with predicted maintenance recovery timeline.
1
Continuous Vehicle Health Monitoring — 52 Variables
Real-time ingestion of engine performance (RPM patterns, cylinder pressure, combustion efficiency), transmission data (shift quality, fluid temperature, load adaptation), brake system metrics (hydraulic pressure, pad wear, response time), tire telemetry (pressure per wheel, temperature, tread depth), electrical system (battery voltage, alternator output, starter current), fuel consumption (MPG, thermal efficiency, injector spray patterns), hours of service (HOS) compliance, route efficiency, and ambient operating conditions — sampled every 30 seconds via integrated OBD-II and IoT sensors.
Vehicle TR-4782: Engine 6,240 RPM (stable), Transmission fluid 85°C (normal), Brake pad wear 6.2mm (declining), Tire pressures 92-94 PSI (all wheels), Fuel efficiency 6.8 MPG (baseline), Oil viscosity 45 cSt (healthy), HOS compliance 100%, Route efficiency 94%, Operating temp 68°C (optimal)
2
Multivariate Fleet Health Scoring
Machine learning model calculates vehicle reliability score (0–100) from correlated analysis of all 52 parameters — identifying subtle mechanical shifts that indicate developing component stress even when no single parameter has crossed service threshold.
Vehicle Health: 787-Day Trend: DecliningRisk Level: Moderate
3
Predictive Failure Pattern Recognition
AI detects the specific multivariate signatures of 14 failure types: brake pad degradation, tire blowout risk, transmission wear, engine bearing stress, turbocharger fatigue, fuel injection anomalies, electrical system degradation, clutch wear, suspension component fatigue, coolant system failure, alternator output decline, starter motor stress, differential bearing wear, and fuel tank corrosion.
Failure Type: Brake Pad WearConfidence: 91%Days to Failure: 9.5 days
4
Root Cause & Operational Context Analysis
System analyses recent operational patterns — sustained high-load routes, repeated mountain terrain driving, extreme temperature conditions, extended idling periods, aggressive acceleration patterns, maintenance history gaps — to identify the operational trigger driving component stress.
Root Cause: High-altitude route + aggressive braking patternsSustained: 8 days, 1,240 miles
5
Maintenance Recommendation & Recovery Forecast
AI recommends targeted maintenance action prioritised by urgency and downtime impact — brake pad replacement, tire rotation, fluid servicing, component inspection, bearing adjustment — with predicted vehicle recovery timeline and confidence that intervention prevents failure.
Recommended: Schedule brake pad replacementDowntime: 2.5 hoursFailure Prevention: 94%
6
Alert Delivery & Maintenance Tracking
Predictive alert pushed to fleet manager mobile app and fleet operations dashboard — with failure type, operational context, recommended maintenance action, required downtime, and predicted reliability impact. Maintenance completion logged and vehicle health tracked in real-time against forecast, with automatic compliance verification.
Alert FM-4782: Vehicle TR-4782 brake pad wear detected 9.5 days before failure risk. Root cause: high-altitude route + aggressive braking. Recommendation: Schedule brake pad replacement within 8 days. Predicted: Vehicle health restores to 94, failure risk drops to 2%. Estimated downtime: 2.5 hours.
AI-Powered Fleet Uptime
Detect Vehicle Failures 7–14 Days Before Breakdown
See how FleetRabbit's multivariate AI identifies the subtle mechanical shifts that precede component failures — giving you the maintenance window to intervene before $50K+ revenue loss and customer relationship damage begins.
87%
Failures Prevented via Early Maintenance
10.2d
Avg Predictive Warning Lead Time
Vehicle Failure Types FleetRabbit Prevents
Every card below represents a distinct mechanical failure mode that forces roadside breakdowns, emergency repairs, and lost revenue. Traditional mileage-based maintenance detects these failures only after they've manifested — FleetRabbit detects the multivariate precursor patterns 7–14 days earlier, allowing planned maintenance instead of crisis response. Sign up to see predictive maintenance applied to your fleet.
Brake Pad Degradation & Wear
Mechanical mechanism: Brake pads wear progressively through friction heat cycles and material composition breakdown. Standard replacement interval assumes average braking patterns — aggressive braking in mountainous terrain accelerates wear by 40–60%, creating failure risk unpredictably before scheduled service. Undetected pad wear cascades into rotor damage, requiring $2,500–$4,500 emergency repair.
FleetRabbit early detection: Monitors brake pressure response curves, hydraulic system thermal signatures, brake temperature patterns, and deceleration force profiles. Identifies accelerated pad wear 7–10 days before safety threshold — detecting wear rate increase from baseline 0.15mm per 500 miles to 0.34mm per 500 miles with declining brake fluid pressure response. Intervention: Schedule pad replacement during next scheduled stop, prevent rotor damage, maintain brake performance throughout vehicle lifecycle.
Typical cost avoidance: $6,500–$12,000 per prevented failure (emergency roadside repair + towing + downtime + customer penalties + potential accident liability).
Tire Blowout & Rapid Pressure Loss
Mechanical mechanism: Tire degradation occurs through rubber oxidation, bead separation, internal cord damage, and sidewall stress accumulation. Pressure loss accelerates in heat stress conditions (highway speed, desert routes, summer operating temperatures). A single undetected pressure loss spirals into sidewall rupture and blowout within 24–72 hours of sustained high-speed operation.
FleetRabbit early detection: Per-wheel tire pressure monitoring with thermal signature analysis and pressure decay rate calculation. Detects abnormal pressure drop rates 10–14 days before critical pressure loss occurs — flagging when tire A2 pressure drops 2.5 PSI over 48 hours while ambient temperature stays stable, indicating internal puncture or bead separation developing. Intervention: Inspect tire at depot, replace before failure, eliminate blowout risk, maintain fuel efficiency.
Intervention: Tire inspection and replacement within 7 days. Prevention confidence: 96% against blowout-related failures. Downtime: 1.5 hours per tire set. Cost avoidance per prevented failure: $4,200–$9,800 (emergency tire replacement, potential cargo damage, accident liability).
Engine Bearing & Crankshaft Stress
Mechanical mechanism: Engine bearings support crankshaft rotation under extreme pressure and thermal stress. Bearing wear accelerates when oil viscosity degrades, lubrication flow decreases, or contaminant accumulation occurs. Early bearing wear produces distinctive vibration signatures, metallic debris in oil, and rising friction heat — progressing to catastrophic bearing seizure and engine block damage requiring full engine replacement ($18,000–$32,000).
FleetRabbit early detection: Analyses engine vibration signatures across multiple frequency bands, oil pressure trending, crankshaft stress via torsional vibration analysis, and oil particle count predictions. Identifies bearing wear patterns 12–14 days before critical failure — detecting when vibration amplitude increases 22% at specific RPM bands while oil pressure remains normal, indicating bearing surface degradation beginning. Intervention: Oil change with premium synthetic lubricant, targeted engine flushing, bearing stress relief protocol reduces further wear.
Intervention: Preventive oil servicing + bearing stress assessment. Recovery time: 3 hours. Prevention confidence: 89% against catastrophic bearing failure. Cost avoidance: $18,000–$32,000 per prevented engine replacement.
Transmission Fluid Degradation & Shift Wear
Mechanical mechanism: Automatic transmission fluid manages 500+ components under extreme pressure and thermal cycling. Fluid viscosity degradation reduces bearing protection, friction modifier depletion decreases shift quality and clutch grip, and thermal breakdown creates varnish accumulation. Shift quality degradation indicates imminent transmission failure requiring $8,500–$15,000 rebuild or replacement.
FleetRabbit early detection: Monitors transmission fluid temperature trending, shift responsiveness patterns (shift delay, harsh shifting, slippage detection), torque converter efficiency, and gear ratio engagement smoothness. Identifies fluid degradation 9–11 days before shift quality crashes — detecting when shift delay increases from 0.2 seconds baseline to 0.4 seconds while fluid temperature trends from 82°C to 94°C, indicating thermal breakdown accelerating. Intervention: Fluid servicing with synthetic transmission fluid, friction modifier restoration, cooler system inspection prevents progression to transmission failure.
Cost avoidance per prevented failure: $8,500–$15,000 (transmission rebuild/replacement + extended downtime 2–4 days + lost revenue).
Turbocharger Performance Degradation
Mechanical mechanism: Turbochargers spin at 120,000+ RPM, converting exhaust energy into boost pressure. Bearing degradation, compressor blade erosion, turbine blade stress fractures, and seal deterioration cause boost pressure loss and power output decline. Turbo failure manifests as reduced power, increased fuel consumption, smoke on acceleration, and progresses to complete turbocharger seizure requiring $4,500–$8,200 replacement.
FleetRabbit early detection: Tracks boost pressure response curves, turbo efficiency mapping, compressor outlet temperature, and power output curves under standardized load conditions. Identifies turbo degradation 7–12 days before performance loss becomes severe — detecting when boost pressure response time increases 18% and peak boost pressure declines 3.2 PSI while fuel consumption trending upward, indicating blade erosion and bearing stress beginning. Intervention: Turbo inspection, bearing clearance verification, seal replacement prevents seizure.
Cost avoidance: $4,500–$8,200 per prevented turbocharger replacement.
Coolant System Failure & Thermal Runaway
Mechanical mechanism: Engine cooling systems maintain optimal operating temperature through circulation pump efficiency, radiator heat exchange, thermostat regulation, and hose integrity. Coolant pH degradation, pump bearing wear, radiator fin corrosion, and hose micro-fractures reduce cooling efficiency. Temperature creep develops over 5–8 days, escalating to thermal runaway and engine seizure within 12–24 hours of undetected overheat condition.
FleetRabbit early detection: Monitors coolant temperature stability across engine operating range, thermostat response timing, circulation pump flow efficiency, radiator pressure differential, and temperature gradient consistency. Identifies cooling system degradation 9–13 days before overheat threshold — detecting when peak operating temperature trends upward 1.8°C per day while thermostat response time increases 3.2 seconds, indicating circulation efficiency loss and radiator fouling. Intervention: Coolant flush with fresh fluid, thermostat inspection, radiator cleaning, hose integrity check prevents thermal failure.
Cost avoidance: $7,200–$14,500 per prevented thermal runaway (engine seizure, emergency towing, extended downtime 3–6 days).
Machine Learning Model Architecture — Vehicle Failure Prevention
FleetRabbit deploys three complementary ML models — each optimised for different mechanical failure scenarios — and fuses their outputs into a unified vehicle health score with failure type classification and maintenance priority ranking.
Gradient Boosting Classifier
Supervised learning model trained on 3,800+ historical vehicle failures across 450+ commercial trucks across 12 years of fleet operation. Classifies current mechanical state into 14 failure risk categories with confidence scoring. Optimised for accuracy on brake degradation, tire wear, and bearing stress detection.
Best for: Brake wear, tire degradation, transmission stress
LSTM Time-Series Forecaster
Deep learning sequence model that learns temporal patterns in component wear, thermal trends, performance degradation, and operational stress evolution. Forecasts mechanical trajectory 14 days forward — predicting when brake pad thickness will reach replacement threshold, when transmission fluid temperature will exceed safe operating range, when engine bearing vibration will indicate critical wear. Enables days-to-failure estimation with 91% accuracy.
Best for: Trajectory forecasting, failure timeline prediction, preventive maintenance scheduling
Isolation Forest Anomaly Detector
Unsupervised model that identifies novel mechanical patterns not seen in training data — detecting emerging failure modes unique to specific vehicle models, driver behavior patterns, or regional operating conditions. Flags abnormal component behaviour even when it doesn't match known failure signatures. Captures fleet-specific failure patterns that supervised models cannot detect.
Best for: Novel failure patterns, fleet-specific anomalies, emerging mechanical issues
Fleet Uptime Performance — 16-Month Validation
The table below compares vehicle downtime frequency and repair costs between fleets managed with traditional mileage-based maintenance schedules vs. FleetRabbit AI predictive maintenance — measured across 450 commercial vehicles over 16 months of continuous operation.
| Failure Type |
Traditional Maint. — Failures per Year |
FleetRabbit AI — Failures per Year |
Prevention Rate |
Avg Cost per Prevented Failure |
| Brake pad degradation |
2.8 events |
0.4 events |
86% |
$8,400 |
| Tire blowout / rapid pressure loss |
2.2 events |
0.3 events |
86% |
$6,800 |
| Engine bearing / crankshaft wear |
0.9 events |
0.1 events |
89% |
$22,400 |
| Transmission fluid degradation |
1.4 events |
0.2 events |
86% |
$11,200 |
| Turbocharger performance loss |
0.7 events |
0.1 events |
86% |
$6,200 |
| Coolant system / thermal runaway |
1.1 events |
0.1 events |
91% |
$10,800 |
| Total — All Failure Types |
9.1 events/yr |
1.2 events/yr |
87% |
$10,967 avg |
How FleetRabbit Recommends Maintenance Actions
When a predictive maintenance alert triggers, FleetRabbit's intervention recommendation engine analyses the specific mechanical state, failure progression trajectory, available maintenance options, and fleet scheduling constraints — recommending the minimum intervention required to prevent failure with fastest recovery time and lowest operational disruption.
1
Brake System Service — Predictive Replacement
Replace brake pads, resurface rotors, inspect hydraulic lines, and top-up brake fluid before wear reaches failure threshold. Performed during scheduled depot maintenance window. Recovery time: 2–3 hours. Prevents rotor damage cascade and maintains braking performance safety margins throughout vehicle lifecycle.
When recommended: Pad wear trending toward critical thickness, deceleration responsiveness declining, hydraulic pressure response time increasing
2
Tire Rotation & Pressure Management
Rotate tire positions to equalize wear patterns, replace pressure sensors if drift detected, balance wheels, and inspect for internal damage. Maintenance window: 1.5–2 hours. Restores even tire wear distribution, eliminates pressure anomalies, and extends tire life by 18–24%.
When recommended: Per-wheel pressure drift detected, wear rate uneven across vehicle axles, pressure sensor accuracy declining
3
Oil Servicing & Engine Lubrication System
Change engine oil with synthetic lubricant matching vehicle specifications, replace oil filter, perform oil analysis to detect wear metals and contaminants, inspect bearing clearances via vibration signature monitoring. Recovery time: 1.5–2 hours. Restores optimal lubrication, reduces bearing stress, and extends engine life.
When recommended: Oil viscosity degradation trending, vibration signature shifting, bearing temperature stability declining, metallic wear indicators present
4
Transmission Fluid Exchange & Cooler Inspection
Drain and replace transmission fluid with OEM-specification synthetic fluid, inspect cooler for blockage or corrosion, test thermostat response accuracy, verify shift quality baseline restoration. Recovery time: 2.5–3 hours. Restores friction modifier effectiveness and maintains transmission operating temperature range.
When recommended: Fluid temperature trending upward, shift delay increasing, friction modifier depletion indicators, viscosity degradation detected
5
Coolant System Flush & Component Inspection
Perform complete coolant system flush to remove contaminants and oxidation products, replace coolant with fresh fluid matching OEM specifications, inspect thermostat function, test circulation pump bearing clearance, clean radiator fins. Recovery time: 2–2.5 hours. Restores heat exchange efficiency and eliminates thermal runaway risk.
When recommended: Coolant pH degradation detected, operating temperature trending upward, thermostat response time increasing, radiator pressure differential abnormal
6
Emergency Component Replacement & Warranty
Last-resort intervention when multiple failure indicators present and component has reached end-of-safe-life. Full component replacement with OEM or certified equivalent parts and extended warranty. Recovery time: 4–8 hours depending on component access. Prevents catastrophic failure and ensures reliability restoration for 40,000+ mile service interval.
When recommended: Failure confidence exceeding 92%, component cannot be restored via servicing, catastrophic failure risk imminent, warranty coverage still available
Fleet Uptime Solutions Across Your Operations
FleetRabbit's predictive maintenance platform serves different fleet operational needs with targeted solutions designed specifically for transportation and logistics businesses. Whether managing long-haul trucking, regional delivery, or specialized heavy haul operations, FleetRabbit optimises uptime and profitability across your entire fleet network.
Long-Haul Fleet Optimization
Real-time monitoring across extended routes with predictive alerts synchronized to fuel stops and scheduled maintenance depots. Minimize unplanned downtime that extends delivery windows and damages customer relationships. Optimize maintenance scheduling across multi-day routes to maintain delivery schedules while preventing failure.
Impact: 94% on-time delivery rate, reduced emergency roadside repairs by 82%, improved driver satisfaction through reliable vehicle performance
Regional Distribution Network Management
Distributed fleet visibility across multi-location operations with consolidated maintenance scheduling across regional hubs. Predictive alerts account for vehicle location, service facility availability, and route commitments. Optimize maintenance execution across your distribution network while maintaining service frequency and load-carrying capacity.
Impact: 41% reduction in total maintenance costs, 88% decrease in emergency repairs, improved hub-level capacity planning and route optimization
Specialized Cargo & Heavy Haul Operations
Intensified component monitoring for vehicles carrying high-value cargo, hazmat materials, or specialized equipment (flatbeds, refrigerated units, tanker systems). Predictive alerts weight vehicle state against cargo risk profile and regulatory requirements. Prevent catastrophic failures that endanger cargo, driver safety, or public welfare.
Impact: Zero cargo loss incidents through improved vehicle reliability, 100% hazmat compliance maintained, reduced insurance premiums through demonstrated risk management
Fleet Manager Dashboard & Mobile Operations
Centralized fleet visibility platform with real-time alert delivery to fleet managers, maintenance coordinators, and operations teams. Mobile app integration enables field teams to acknowledge alerts, schedule maintenance, track repairs, and verify completion. Integrate with existing maintenance management systems and ERP platforms.
Impact: Instant visibility into fleet health status, reduced manual inspection overhead, improved maintenance coordination and scheduling accuracy
OEM Integration & Warranty Optimization
Direct integration with vehicle manufacturer maintenance systems and warranty databases. Validate that maintenance actions align with OEM recommendations and preserve warranty coverage. Prevent warranty claim rejections through documented predictive maintenance protocols and component replacement decisions.
Impact: 100% warranty preservation, reduced manufacturer claim disputes, extended component coverage periods
Real-World Fleet Performance Results
87%
Vehicle Failures Prevented via Early Maintenance
10.2d
Average Predictive Warning Lead Time
91%
Reduction in Annual Breakdown Frequency
$92K
Avg Annual Cost Avoidance per Vehicle
2.5h
Typical Planned Maintenance Downtime
94%
Failure Type Classification Accuracy
Predictive Fleet Maintenance
Stop Fighting Breakdowns — Prevent Them Before They Happen
FleetRabbit's AI gives you the 7–14 day warning window to schedule maintenance when vehicles are available — instead of emergency response after $50K+ revenue loss and customer reputation damage has already begun.
From the Field — Customer Success Stories
"We were experiencing 8–10 unplanned breakdowns per month across our 85-truck fleet — each one costing us $12,000–$18,000 in emergency repairs, towing, lost revenue, and customer penalties. After deploying FleetRabbit in Q2 2024, we've reduced unplanned downtime to less than 1 failure per month. The system flagged 12 developing brake wear and tire degradation issues in our first 90 days — we handled all of them during scheduled depot maintenance. We're now running at 96% fleet availability, recovering over $890,000 in annual cost avoidance, and our customer satisfaction scores have increased 24 points because we're meeting delivery windows reliably. The predictive maintenance window is real — seeing brake pad wear develop 9 days before failure threshold gives us time to plan maintenance instead of fighting emergencies."
Fleet Operations Manager
85-Vehicle Regional Distribution Fleet — Central Europe
Frequently Asked Questions
QHow does FleetRabbit distinguish normal component wear from developing failure?
The ML models learn each vehicle's normal operating envelope during the first 45–60 days after deployment — understanding that brake pad wear normally varies 0.12–0.18mm per 500 miles, tire pressures naturally fluctuate 2–3 PSI with temperature changes, and engine temperatures vary ±4°C during normal highway operation. Alerts trigger only when multivariate patterns indicate accelerated wear or mechanical stress — not from single-parameter variation within learned normal ranges. False positive rate: <3% after initial learning period.
See the learning process in a demo.
QWhat vehicle data and sensors does FleetRabbit require for predictive maintenance?
Minimum viable dataset: Engine performance data (via OBD-II interface), transmission data (electronic control module connection), brake system pressure/temperature, wheel-speed sensors (for tire monitoring), fuel consumption (via CAN bus). Enhanced accuracy with: Per-wheel tire pressure sensors, engine oil analysis integration, transmission fluid temperature monitoring, coolant system sensors, advanced diagnostics from modern ECUs. Most modern commercial trucks (2010+) have sufficient onboard diagnostics — FleetRabbit integrates with existing vehicle telemetry.
QCan FleetRabbit predict failures caused by driver behaviour or abuse?
Yes. The system monitors driving patterns (aggressive acceleration, harsh braking, excessive idling, sustained high RPM operation) and correlates them with accelerated component wear. If a driver's behaviour pattern is causing brake pad wear to accelerate 2.8x normal rate or transmission temperature to spike 18°C above thermal envelope, FleetRabbit flags both the mechanical risk AND the driver behaviour contributing to it. You can implement targeted driver coaching based on these insights.
QHow long does model training take before predictive alerts become reliable?
Initial baseline learning: 45–60 days of normal operation to establish each vehicle's wear baselines and thermal envelopes. Predictive alerts activate immediately after baseline established, though accuracy improves continuously — reaching >90% failure type classification accuracy by day 120. If your fleet has detailed historical maintenance records, FleetRabbit can train on pre-deployment data to accelerate learning. Most fleets see meaningful alert patterns within 30 days of deployment.
Discuss your fleet's history in a demo call.
QDoes FleetRabbit integrate with existing fleet management systems and maintenance software?
Yes. FleetRabbit integrates with major fleet management platforms (Samsara, Geotab, Verizon Connect), ERP systems (SAP, Oracle), and maintenance management software (Dude Solutions, UpKeep, Fiix). API connections enable real-time data flow between systems — maintenance alerts automatically trigger work orders in your existing maintenance management system, and completed repairs feed back to FleetRabbit for health score updates. Integration implementation: 2–4 weeks depending on system complexity.
Fleet Uptime Starts With Predictive Intelligence
Every breakdown is preventable when you see it coming. FleetRabbit's AI detects the mechanical patterns that lead to failures — giving your team the warning window to schedule maintenance before component degradation cascades into catastrophic failure. That early-warning window is where profitability, reliability, and customer satisfaction are won.
Detect Vehicle Failures 7–14 Days Early — Maximize Fleet Uptime and Profitability
FleetRabbit's biology-aware AI monitors 52 vehicle variables continuously to identify the multivariate patterns that precede breakdowns — giving you the early-warning window to prevent failures with planned maintenance instead of fighting emergencies.
87% Failure Prevention Rate
10.2-Day Early Warning
14 Failure Types Detected
Maintenance Recommendations
$92K Annual Savings
April 9, 2026
By Smith
All Posts