Transportation and logistics fleets that don't measure asset utilization are flying blind on their most expensive capital investments. A truck sitting idle drains $150–$300 per day in fixed ownership costs — insurance, depreciation, and financing — while generating zero revenue. Fleet utilization analytics turns that invisible cost into visible, actionable data. FleetRabbit's analytics and reporting platform tracks utilization rates, idle time, asset availability, and performance metrics across every unit in your fleet — giving operations executives the intelligence to deploy assets smarter, reduce unnecessary fleet size, and drive measurable ROI from every truck and trailer. Book a demo to see fleet utilization analytics in action.
Quick Answer
FleetRabbit's analytics and reporting module tracks truck and trailer utilization rates, idle time percentages, revenue miles per day, maintenance downtime hours, and cost per mile — giving fleet managers and executives real-time visibility into asset performance so they can eliminate underutilized units, reduce idle costs, and maximize ROI from every asset in the fleet.
Why Asset Utilization Is the Most Overlooked Fleet KPI in Trucking
Most fleet managers track miles driven and fuel cost. Fewer than 30% of mid-size trucking fleets actively monitor utilization rates by asset. The consequence is predictable: underperforming trucks remain in the fleet consuming fixed costs, high-demand assets run at unsafe utilization levels driving accelerated wear, and fleet size decisions are made on gut feel rather than data. FleetRabbit changes the analytical foundation fleet leaders use to make capital and operational decisions.
01
Ghost Assets Drain Fleet Budgets
Industry research shows 15–25% of fleet assets in mid-to-large trucking fleets operate below 50% utilization in any given month. These "ghost assets" accumulate full fixed costs — $8,000–$15,000 per truck per month in depreciation, insurance, and financing — while contributing minimally to revenue-generating operations.
02
Idle Time Is Invisible Without Tracking
Idle engine hours cost fleets $0.80–$1.50 per hour in fuel alone — plus accelerated engine wear that reduces overhaul intervals. A single truck idling 3 hours daily for 250 days adds $600–$1,125 in wasted fuel annually, multiplied across a 50-truck fleet representing up to $56,000 per year in preventable cost.
03
Maintenance Downtime Compounds Utilization Loss
Unplanned breakdown downtime averages 2.4 days per event in commercial trucking. At $1,200–$2,000 per day in lost revenue capacity per truck, each avoidable breakdown represents $2,900–$4,800 in direct revenue impact — before repair costs. Utilization analytics identifies which trucks have patterns of elevated downtime before the next breakdown occurs.
04
Fleet Size Decisions Made Without Data
Without utilization data, fleet expansion decisions are based on subjective demand perception. Fleets regularly carry 10–20% more assets than peak demand requires — paying full fixed costs on buffer inventory that generates no operating margin. Utilization analytics quantifies actual demand patterns so right-sizing decisions are revenue-justified.
How FleetRabbit Delivers Fleet Utilization Analytics for Transportation Operations
FleetRabbit's analytics and reporting module is purpose-built to give transportation and logistics executives actionable utilization intelligence — not raw data exports that require analyst interpretation. Every metric is calculated automatically from operational inputs and presented in dashboards designed for fleet leaders.
1
Asset Utilization Rate Tracking — Unit by Unit, Fleet Wide
FleetRabbit calculates utilization rate as revenue-producing hours divided by available hours for every truck and trailer in the fleet. Daily, weekly, and monthly utilization views identify chronic underperformers and over-deployed assets — flagging optimization opportunities that fleet managers can act on immediately.
Unit 31 — Dry Van Trailer | Utilization Rate: 38% (30-day avg) | Fixed cost: $1,820/mo | Revenue contribution: $4,200/mo | Benchmark: Fleet avg 74% | Status: UNDERPERFORMING — review for redeployment or disposal
2
Idle Time Monitoring — Eliminate the Invisible Fuel Drain
FleetRabbit tracks engine idle time per vehicle from GPS and telematics integration — calculating idle hours, idle fuel cost, and idle frequency by driver and by location. Idle hotspot maps show where repeated idle events occur, enabling dispatch and routing decisions that eliminate systemic idle patterns rather than just flagging individual events.
Fleet idle summary — this week: Total idle hours 312 | Estimated idle fuel cost: $1,248 | Top idle locations: Loading dock A (82 hrs), Highway 61 rest area (44 hrs) | Highest idle driver: Unit 8 driver — 6.4 hrs/day avg vs fleet benchmark 1.8 hrs/day
3
Maintenance Downtime Analytics — Connect Downtime to Utilization Loss
FleetRabbit links maintenance work orders to fleet availability data — calculating downtime hours per unit, per maintenance category, and per repair type. Planned maintenance downtime vs unplanned breakdown downtime is tracked separately, quantifying the ROI of preventive maintenance investment relative to the revenue cost of reactive repair events.
Unit 14 downtime analysis — Q1: Planned PM downtime: 6.5 hrs | Unplanned breakdown downtime: 28 hrs | Lost revenue capacity (unplanned): $33,600 | PM cost: $1,840 | Net savings from PM vs breakdown prevention: $31,760
4
Revenue Miles and Cost Per Mile — The Core ROI Metrics
FleetRabbit calculates revenue miles per day, cost per mile by vehicle and by route, and fuel cost as a percentage of revenue for every asset in the fleet. These metrics give fleet executives the financial picture of each asset — making it clear which trucks deliver positive ROI and which are cost centers that need corrective action or replacement.
Fleet ROI summary — March: Avg revenue miles/day per truck: 412 | Avg cost per mile: $0.44 | Best performing unit: Truck 7 — $0.38/mi | Worst performing unit: Truck 22 — $0.61/mi | Recommended action: Truck 22 maintenance audit and route reassignment
5
Executive Fleet Performance Dashboard — Portfolio-Level Intelligence
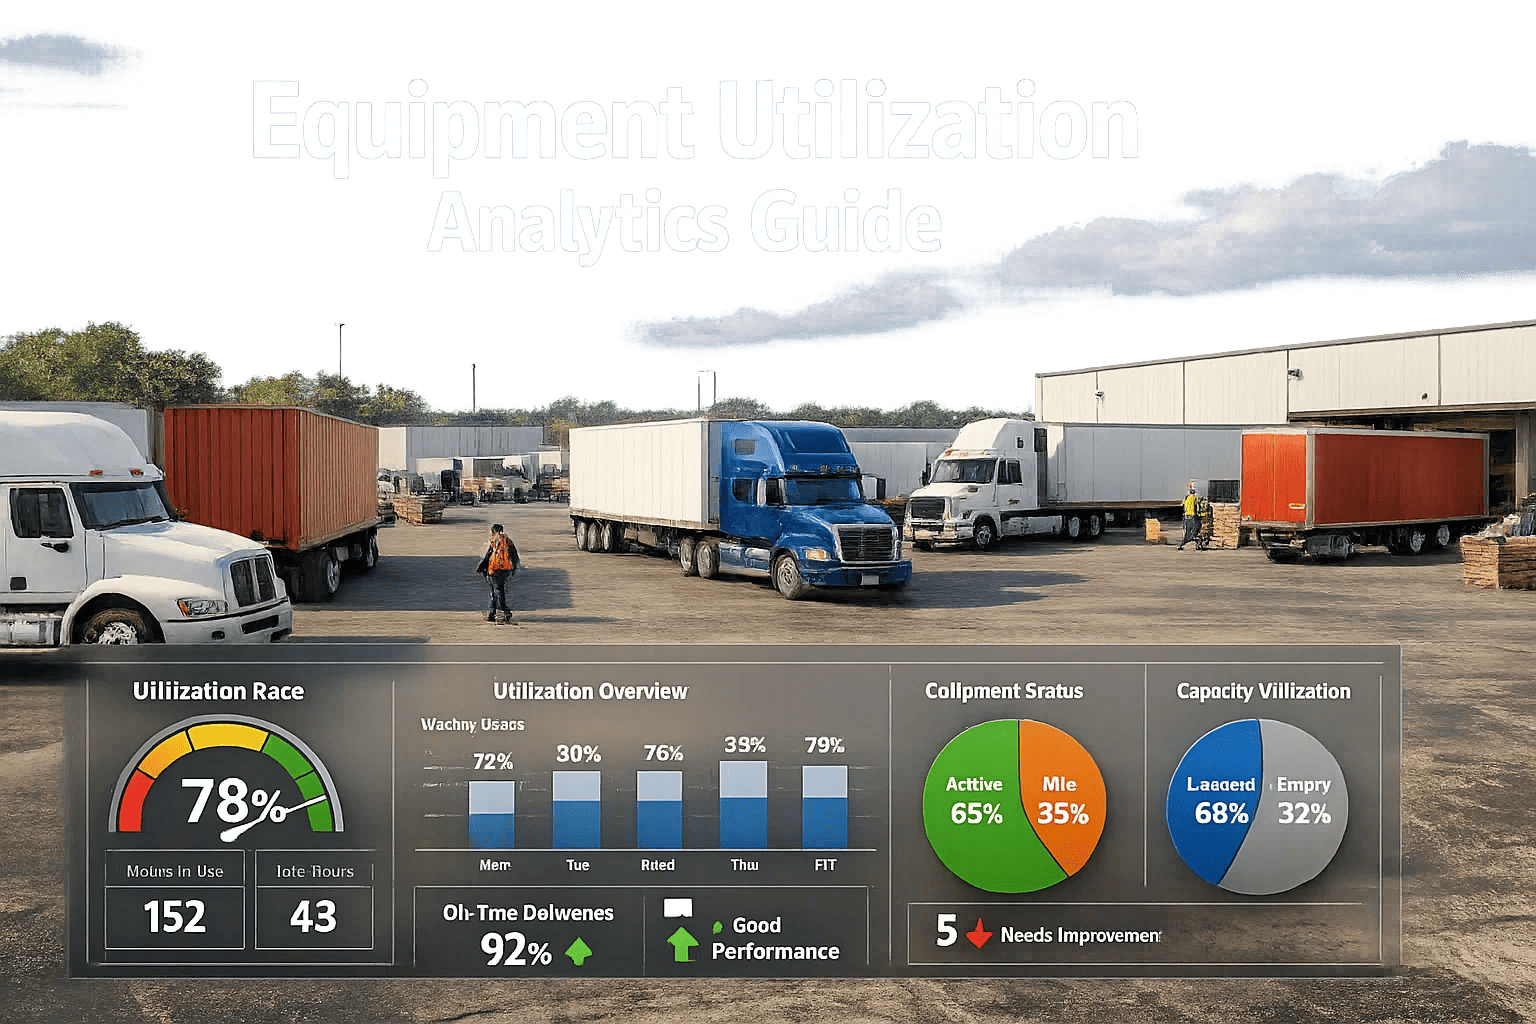
FleetRabbit's executive dashboard consolidates utilization rates, availability percentages, cost per mile trends, idle cost totals, and maintenance ROI into a single leadership view — updated daily. Trend indicators show whether fleet performance is improving or declining without requiring manual data compilation from multiple sources.
Fleet Performance Dashboard — April: Overall utilization 78.4% (+4.2 pp vs prior month) | Fleet availability 94.8% | Cost per mile $0.43 (down from $0.47) | Idle cost reduction: $3,200 vs prior month | PM compliance: 97.6%
FleetRabbit Analytics
Turn Underutilized Assets Into Identifiable, Fixable Cost Drains
FleetRabbit gives logistics executives real-time utilization data for every truck and trailer — so you can eliminate idle costs, right-size your fleet, and maximize ROI from every asset. Fleet managers using FleetRabbit's analytics report 12–18% reductions in cost-per-mile within the first six months. Book a demo to see your fleet's utilization potential on the FleetRabbit platform.
18%
Avg Cost-Per-Mile Reduction
94%+
Fleet Availability Rate Target
Key Utilization Metrics Every Transportation Fleet Should Track
Not all metrics are equal. FleetRabbit tracks the analytics that directly connect to operating margin — not vanity metrics that look good on a report but don't inform decisions. These are the eight utilization KPIs that fleet managers and executives need to see every week.
Asset Utilization Rate
Revenue hours / available hours per unit. Industry benchmark: 70–80% for class 8 trucks. Below 60% flags underperformance requiring investigation.
Idle Time Percentage
Engine-on hours with no movement / total engine-on hours. Target below 15%. Excess idling costs $0.80–$1.50/hr in wasted fuel per vehicle.
Revenue Miles Per Day
Average loaded miles per day per asset. Differentiates productive driving from deadhead and idle time sitting. Industry avg: 400–450 miles/day for OTR trucks.
Cost Per Mile
Total operating cost / miles driven per unit. The core ROI metric for fleet decision-making. Significant variance between units identifies maintenance or routing issues.
Fleet Availability Rate
Percentage of scheduled hours the fleet is available for dispatch. Target 92–96%. Availability below 88% indicates maintenance or staffing problems requiring immediate attention.
Downtime Hours by Cause
Planned vs unplanned downtime per unit. Unplanned breakdown downtime should trend toward zero. High unplanned downtime predicts an upcoming major repair event.
Deadhead Ratio
Empty miles / total miles driven. High deadhead percentages indicate dispatch inefficiencies or load planning gaps that reduce effective fleet utilization and increase cost per revenue mile.
Maintenance Cost Per Mile
Total maintenance spend / revenue miles per unit. Rising maintenance cost per mile is the primary predictor of asset end-of-life, guiding replacement timing decisions based on data, not age.
Utilization Analytics Benchmarks for Transportation Fleets
Understanding where your fleet stands against industry benchmarks requires measurement. The table below shows the key utilization benchmarks FleetRabbit tracks and the performance tiers that separate high-performing fleets from average operations.
| Metric |
Below Average Fleet |
High-Performing Fleet |
Annual Value of Reaching Top Tier |
| Asset Utilization Rate |
Below 60% |
75–85% |
$18,000–$42,000 per underutilized truck eliminated |
| Idle Time Percentage |
Above 25% |
Below 12% |
$1,100–$2,800 per truck per year in fuel savings |
| Fleet Availability Rate |
Below 88% |
93–97% |
$28,000–$65,000 in recovered revenue capacity (50-truck fleet) |
| PM Compliance |
Below 75% |
95–100% |
3–5x reduction in unplanned breakdown events |
| Unplanned Downtime Hours |
Above 48 hrs/unit/yr |
Below 12 hrs/unit/yr |
$43,200–$96,000 in recovered revenue per truck |
| Cost Per Mile |
Above $0.55/mi |
Below $0.42/mi |
$0.13/mi savings x 120,000 annual miles = $15,600/truck/yr |
What Fleet Executives Achieve With FleetRabbit Utilization Analytics
15–25%
Reduction in Underutilized Assets
40%
Less Unplanned Downtime
12–18%
Cost Per Mile Improvement
$56K
Annual Idle Cost Savings (50-truck fleet)
94%+
Fleet Availability Rate Achieved
Real-Time
Dashboard Updates — No Manual Reporting
Frequently Asked Questions About Fleet Utilization Analytics
QDoes FleetRabbit require GPS hardware to deliver utilization analytics?
FleetRabbit integrates with your existing GPS and telematics systems to pull mileage, location, and idle data automatically — no separate hardware required if you already have a GPS provider. FleetRabbit supports integration with major telematics platforms. For fleets without existing GPS, FleetRabbit can guide you to compatible providers and set up the integration as part of onboarding.
Review your current GPS setup in a demo call.
QHow does utilization analytics connect to maintenance decisions in FleetRabbit?
FleetRabbit links utilization data directly to maintenance records — so when a unit shows declining utilization, the system cross-references its maintenance history to identify whether mechanical reliability is the contributing factor. Repeated downtime events reduce a unit's utilization score automatically, surfacing which trucks need maintenance intervention versus which are operationally underdeployed. This prevents misdiagnosing a maintenance problem as a dispatch problem or vice versa.
QCan FleetRabbit analytics support fleet right-sizing decisions?
Yes. FleetRabbit's utilization data provides the evidence base for fleet size decisions — showing peak demand utilization rates, seasonal patterns, and per-asset ROI. Executives can identify which assets are consistently below utilization thresholds, quantify the fixed cost those assets represent, and make data-supported disposal or redeployment decisions. Fleets using FleetRabbit analytics have reduced fleet size by 8–15% while maintaining or improving service capacity.
Start your free trial to begin capturing utilization data.
Stop Guessing Which Trucks Are Underperforming — See It in Real Time.
FleetRabbit's utilization analytics platform gives transportation and logistics executives the data to eliminate idle costs, right-size fleet assets, reduce cost per mile, and maximize ROI from every truck and trailer — updated continuously without manual reporting effort. Book a personalized demo to see utilization analytics applied to your fleet size and operation type.
Asset Utilization Tracking
Idle Time Analytics
Cost Per Mile
Fleet Availability Rate
Executive Dashboards
Downtime Analytics
April 9, 2026
By Smith
All Posts