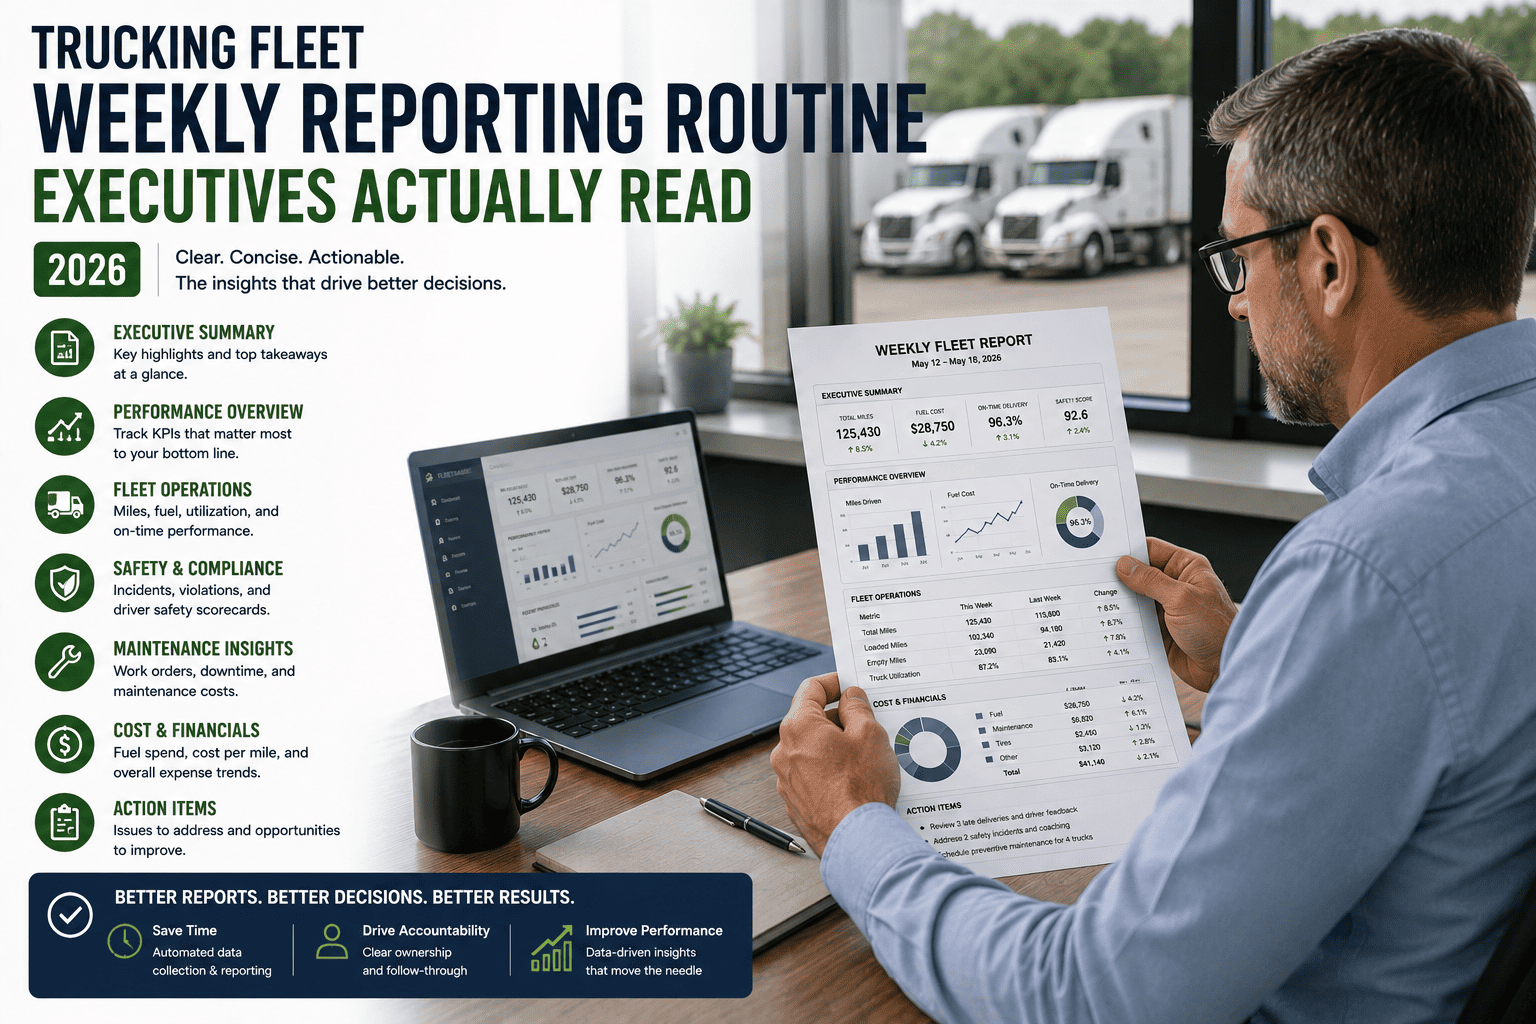
Somewhere in your company right now, a fleet report is sitting unread in an executive's inbox. It's usually a dense spreadsheet, a dozen tabs deep, full of numbers nobody outside the fleet office has time to decode. The fleet manager spent hours pulling it together on Friday afternoon. The executive opens it, scrolls once, and closes it without absorbing a single number. That disconnect isn't a communication problem, it's a format problem. Executives don't need more data, they need the three or four numbers that tell them whether the fleet is on track, and a weekly routine that gets that answer in front of them without a chase.
Executives actually read fleet reports that fit on one screen, lead with a plain-language summary, and use color and visuals instead of raw rows of numbers. The winning format covers five things: safety, uptime, cost, compliance, and utilization, each with a single headline number and a trend arrow. Automating this from live fleet data turns a multi-hour Friday task into a report that builds and sends itself.
Why Most Weekly Fleet Reports Never Get Read
Fleet expenses often represent a meaningful share of total operating cost, yet many fleet managers still struggle to hold an executive's attention long enough to explain where that money goes. The usual culprit is format, not effort. A report built for a fleet manager's own troubleshooting, full of odometer readings, individual work orders, and raw fuel logs, is the wrong document to hand to someone who has ninety seconds and needs a decision, not a dataset.
The Report Nobody Reads vs. The Report Everybody Reads
- 12-tab spreadsheet with raw data dumps
- No summary, executive must find the story themselves
- Sent Friday at 6pm, read Monday if at all
- Numbers with no context or trend
- Built manually, often late or skipped
- One screen, five headline numbers, plain language
- Opens with a two-line summary of what changed
- Delivered automatically, same time every week
- Every number paired with a trend arrow
- Built from live data, always current, always on time
The gap between those two documents isn't effort, it's structure. Once your fleet data lives in one connected system instead of scattered logs, the report on the right builds itself every week. You can see how that looks on your own fleet by choosing to sign up for a free trial and connecting your first few vehicles.
FleetRabbit pulls live telematics, maintenance, fuel, and compliance data into one automated weekly summary, so executives get the same five numbers, on time, every week, without a manual export.
The Five Sections Every Executive Report Needs
An executive-ready weekly report doesn't need twenty metrics. It needs five, each answering one question in a single glance. Build your report around these sections and every stakeholder, from the CFO to the safety director, finds their number in the first ten seconds.
Turning Raw Numbers Into a Story
Executives don't want idle time reported as a percentage, they want to know what that percentage funds. Instead of reporting idle fuel consumption on its own, show how cutting it by a defined amount frees up budget for something concrete, like an additional lease or a driver bonus program. That single reframing is often the difference between a report that gets a nod and one that gets a follow-up meeting.
A Two-Line Executive Summary Example
"Fleet cost per mile held steady at $1.62 this week, uptime improved to 96 percent after clearing a maintenance backlog on three trucks, and PM compliance rose to 91 percent." Two sentences, five numbers, zero ambiguity about what changed and why it matters.
| Report Section | Data Source | Update Frequency | Who Reads It First |
|---|---|---|---|
| Safety | Telematics, driver scorecards, inspection logs | Daily, rolled up weekly | Safety director, insurance contact |
| Uptime | Work orders, breakdown logs, dispatch records | Real time | Operations director |
| Cost | Fuel cards, maintenance invoices, payroll | Weekly | CFO, finance team |
| Compliance | PM schedules, DOT records, ELD logs | Weekly | Compliance officer |
| Utilization | GPS and telematics mileage data | Weekly | CEO, asset planning team |
Building a Reporting Routine That Actually Sticks
The best report format in the world fails if it only gets built when someone remembers to do it. A routine that survives busy weeks needs to run on a schedule, not on willpower. Here's a simple weekly cadence that keeps the report consistent without adding hours to anyone's plate.
Telematics, fuel, and maintenance feeds update overnight
Flag any KPI drifting outside target before it becomes Friday's surprise
Five headline numbers compile into one screen, no manual export
Delivered before the next week's planning meeting starts
Fleets that review performance data on a weekly rhythm tend to catch developing problems far faster than teams reviewing monthly or quarterly, simply because small drifts get flagged before they compound. If your current process depends on someone remembering to pull a report, it's worth seeing what an automated version looks like. You can book a demo and we'll walk through a routine built around your existing data sources.
What To Do When a Number Moves the Wrong Way
A weekly report is only useful if it comes with a next step. When cost per mile ticks up, the report should point to the diagnostic layer, whether it's a fuel spike, an emergency repair, or an underused truck, rather than leaving the executive to ask a follow-up question. Pairing every headline number with a one-line "why" turns a status update into a decision-ready document.
FleetRabbit turns scattered telematics, fuel, and maintenance data into one clean weekly summary that lands in inboxes on schedule, every time, with the story already built in.
Getting Started With Automated Weekly Reporting
You don't need to redesign your entire reporting process overnight. Most teams start by automating the five headline numbers, then layer in drill-down detail as executives ask for it.
Once the routine is running, you can sign up and start a free trial to build your own weekly summary, or if you'd rather see it configured around your current tools first, book a 30-minute demo with our team.
Stop spending Friday afternoons exporting spreadsheets nobody reads. FleetRabbit turns live fleet data into a five-number executive summary that lands on schedule, every week, without a manual step.







