Most fleet managers find out their CSA score is a problem the same way: an insurance renewal comes back with a steep increase, or a broker quietly stops sending loads. By the time either happens, the underlying violations have usually been building for months. FMCSA's Compliance, Safety, Accountability program scores every motor carrier across a handful of safety categories using roadside inspection and crash data, and those scores directly shape whether you get flagged for intervention, what you pay for insurance, and whether shippers trust you with freight. Understanding exactly what goes into a CSA score, and which levers actually move it, is the difference between reacting to a warning letter and staying ahead of one.
A CSA score is built from FMCSA's Safety Measurement System, which converts roadside inspection violations and crash data from the past 24 months into percentile rankings across BASIC categories like Unsafe Driving, Hours-of-Service Compliance, and Vehicle Maintenance. Higher percentiles are worse, and crossing an intervention threshold (65% for the highest-risk categories, 80% for the rest) puts a carrier on FMCSA's radar and often raises insurance premiums. Fleets improve their score by reducing new violations through consistent pre-trip inspections, driver behavior monitoring, and maintenance discipline, then tracking their SMS data monthly. You can sign up for FleetRabbit to see how digital inspections and maintenance tracking support that effort.
What a CSA Score Actually Measures
CSA stands for Compliance, Safety, Accountability, the FMCSA enforcement program that replaced the older SafeStat system. Underneath it sits the Safety Measurement System, which pulls every roadside inspection violation and reportable crash from the past 24 months, weights the more recent events more heavily, and converts the result into a percentile ranking against similar carriers. The confusing part for most new fleet managers is that a higher percentile is worse, not better. A score of 80 means your carrier looks worse than 80 percent of your peer group in that category, while a score of 20 puts you ahead of 80 percent of similar carriers.
Why Higher Is Worse: Reading the Percentile Correctly
Because scores are relative rather than absolute, a fleet can improve its actual safety record and still see its percentile move if peer carriers improve faster. This is part of why FMCSA has been reworking the underlying methodology throughout 2026, moving toward what it calls a proportionate percentile system that uses each carrier's exact inspection and crash count rather than grouping carriers into broad bands, which previously caused large, confusing percentile swings from a single inspection.
The BASIC Categories in Plain English
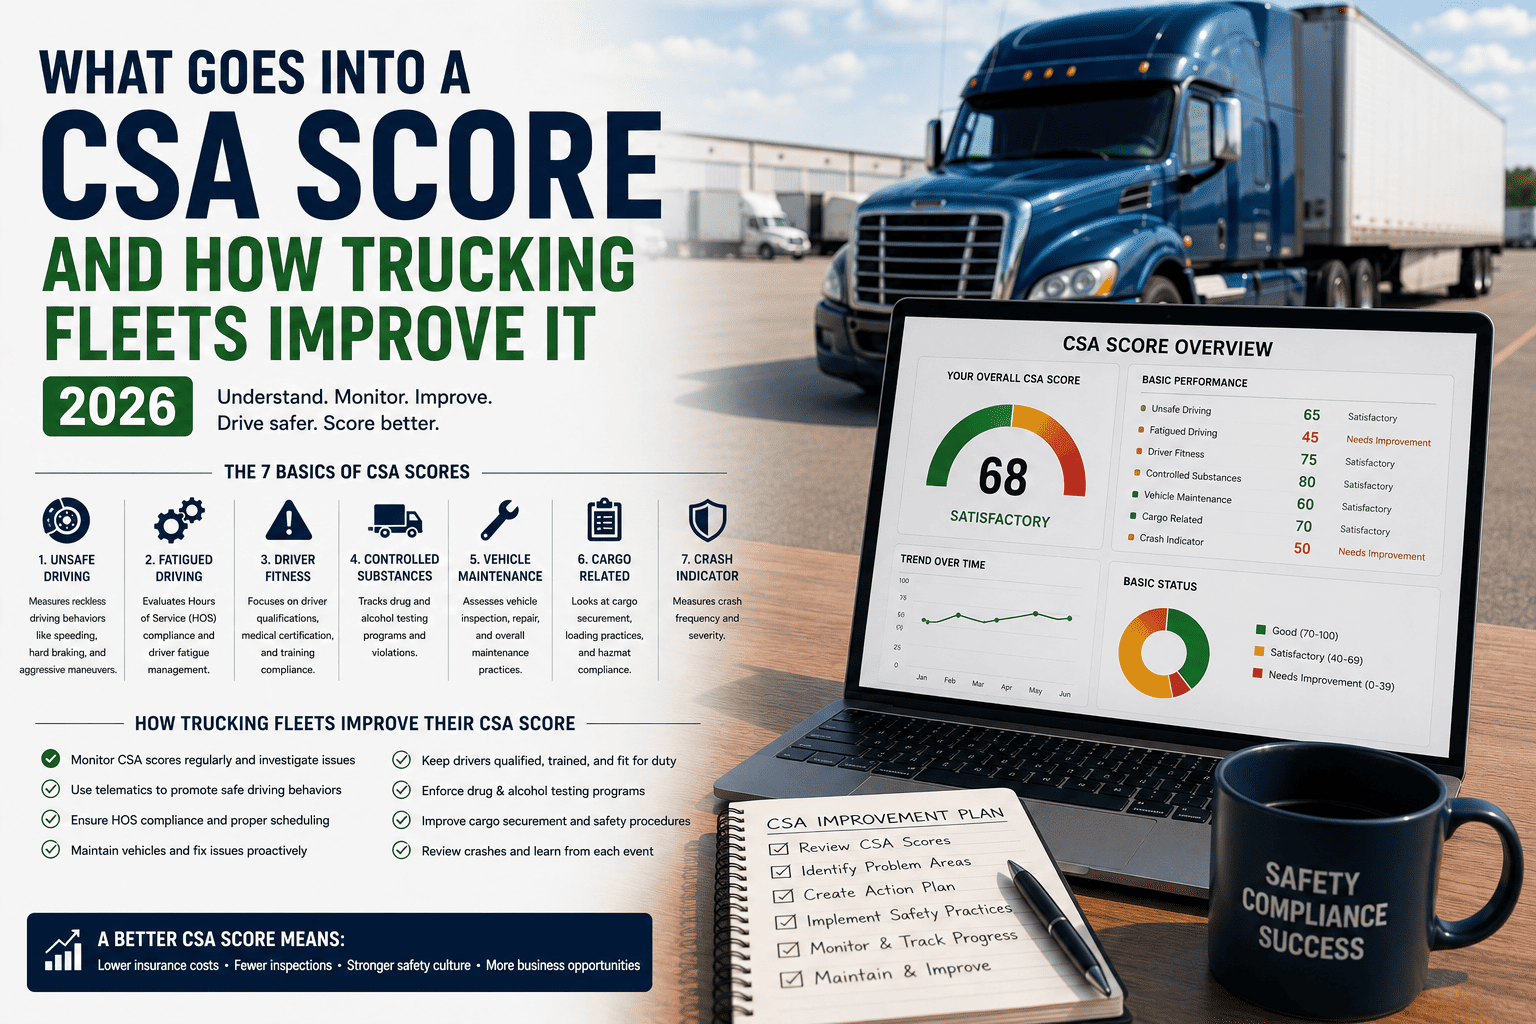
BASIC stands for Behavior Analysis and Safety Improvement Category, and each one focuses on a different slice of carrier safety performance. Crossing the intervention threshold for any single category, not an overall average, is what puts a carrier in FMCSA's prioritization window.
| BASIC Category | What It Measures | Common Drivers |
|---|---|---|
| Unsafe Driving | Speeding, reckless operation, improper lane use | Driver behavior and coaching gaps |
| Hours-of-Service Compliance | HOS violations, ELD malfunctions, fatigued driving | Scheduling pressure, poor ELD monitoring |
| Driver Fitness | Invalid licenses, expired medical certifications | Weak driver qualification file tracking |
| Controlled Substances/Alcohol | Drug and alcohol testing violations | Testing program gaps, Clearinghouse errors |
| Vehicle Maintenance | Brake, tire, and lighting defects found at roadside | Inconsistent pre-trip and preventive maintenance |
| Crash Indicator | Reportable crash frequency and severity, regardless of fault | Overall exposure, driver behavior, road conditions |
FleetRabbit digitizes DVIRs and pre-trip inspections so defects get caught, documented, and repaired before they ever show up at roadside. If you want to see how that connects to your safety score, you can start a free trial or book a short demo with the team.
Why This Score Affects More Than an FMCSA Audit
A CSA score doesn't directly change your carrier's official safety rating, but the practical consequences reach far beyond FMCSA paperwork. Insurance underwriters pull SMS data directly and factor elevated BASICs into pricing, and carriers approaching an intervention threshold commonly see meaningful premium increases at renewal, with steeper jumps once a threshold is actually crossed. Some underwriters use automated rules that decline coverage outright for carriers with multiple BASICs above threshold, and a broker's quote can simply stop coming back without an explanation. Shippers and brokers increasingly check SMS scores before awarding freight, which means a poor Vehicle Maintenance or Unsafe Driving BASIC can quietly cost a carrier business well before FMCSA ever sends a letter.
The 2026 SMS Overhaul: What's Changing
FMCSA has been rolling out the most significant update to the Safety Measurement System since CSA launched, consolidating roughly two thousand violation codes into a much smaller set of violation groups and moving toward a proportionate percentile model that reduces the sudden score swings smaller fleets used to see. A new Vehicle Maintenance category tied specifically to driver-observed defects has also been introduced, which means the quality of your drivers' pre-trip and post-trip inspection reports now has a more direct line to your score than it used to. Carriers can preview how their numbers look under the updated methodology through FMCSA's CSA Prioritization Preview tool while the transition continues.
Why Documentation Quality Matters More Than Ever
With driver-observed defects now carrying their own weight in the scoring system, a rushed or incomplete DVIR isn't just a paperwork problem anymore. A thorough, properly documented inspection record protects a carrier both at roadside and in the SMS data that insurers and brokers are watching.
How Fleets Actually Improve Their CSA Score
There's no shortcut that erases a poor score overnight, since it reflects 24 months of data, but consistent operational changes move the needle steadily. The most effective fleets focus on the BASIC furthest above its threshold first, rather than spreading effort evenly across categories that aren't currently a problem.
Challenging Inaccurate Violations Through DataQs
Not every violation on your record accurately reflects what happened. FMCSA's DataQs system lets carriers request a review of violations they believe were recorded in error, misattributed, or, for crashes, genuinely not preventable. Success rates vary depending on the strength of supporting evidence, and DataQs is best used for genuinely disputable events rather than as a routine strategy, since the underlying fix for most fleets is still preventing new violations from entering the scoring window in the first place.
Building a Simple Monthly Compliance Routine
The fleets that stay ahead of their CSA score tend to run the same short routine every month: pull the latest SMS data, compare each BASIC against its threshold, flag any category trending in the wrong direction, and connect that trend back to a specific operational fix, whether that's tightening pre-trip inspections or scheduling a coaching session with a specific driver. You can build that habit around a digital inspection and maintenance workflow by choosing to sign up for a free trial today.
Every clean, well-documented inspection is one less violation working against your BASIC percentiles. FleetRabbit gives your drivers a fast digital DVIR workflow and gives your safety team the visibility to catch problems before they reach roadside.







