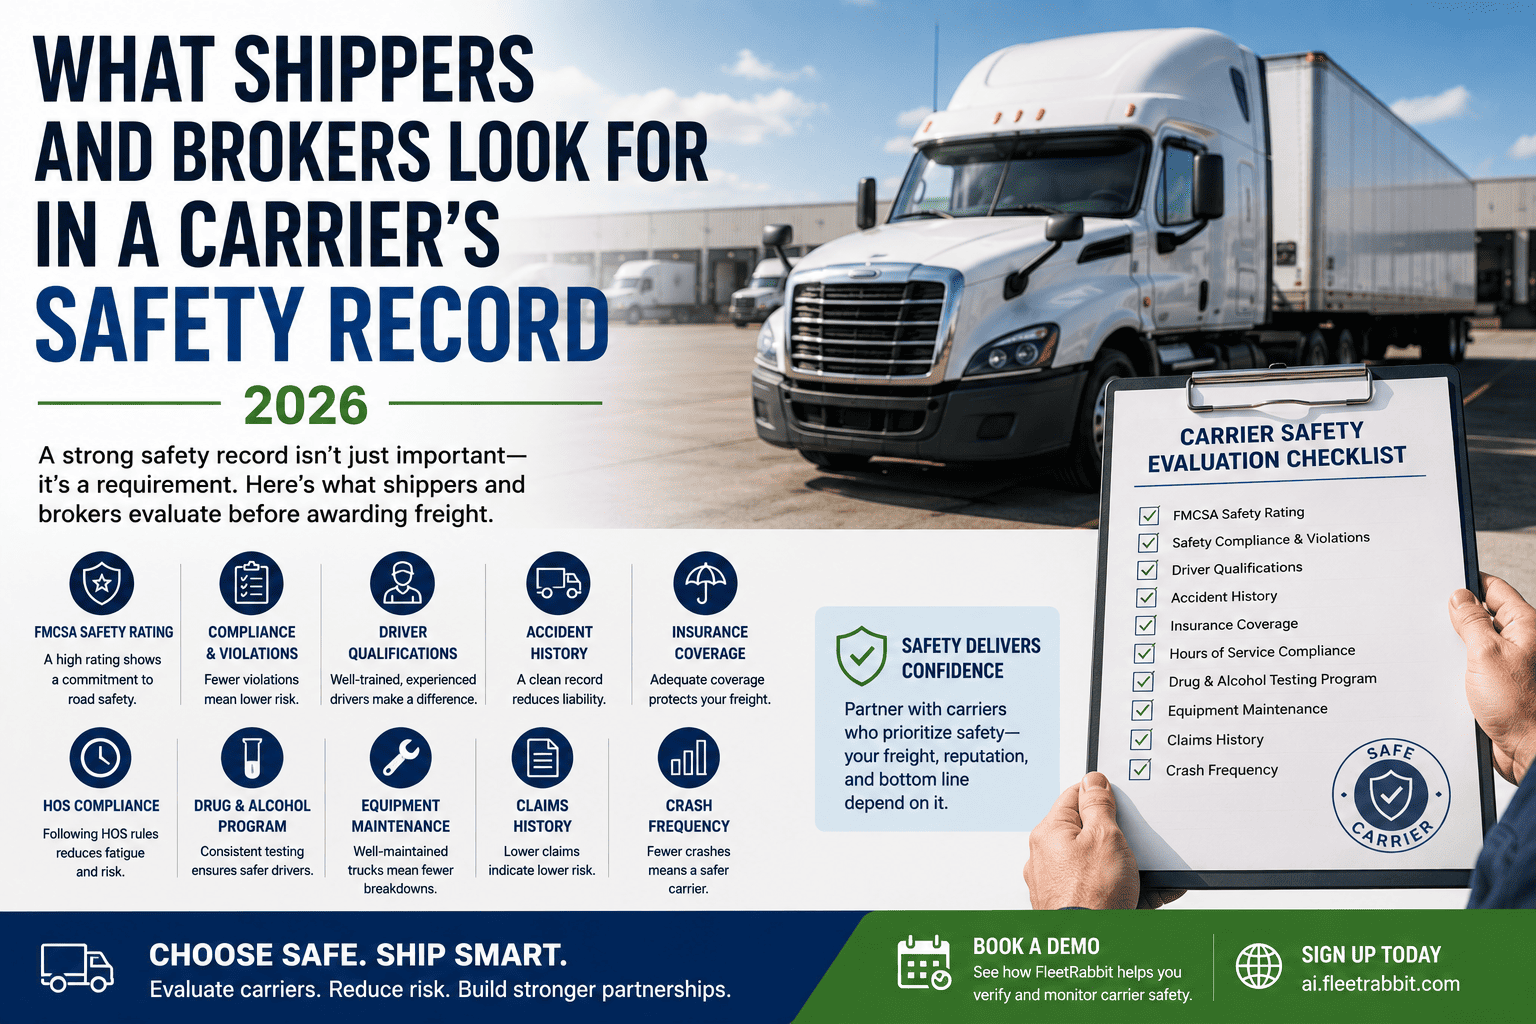
Before a broker ever calls your dispatch line, they have already looked you up. A quick search of your DOT number tells them almost everything they want to know before the first conversation even starts. In 2026, a carrier's safety record has become the first filter freight goes through, often well before rate and equipment even enter the conversation. Understanding exactly what shippers and brokers are checking, and why, is the difference between winning consistent freight and wondering why the good loads keep going somewhere else.
Shippers and brokers evaluate carriers on CSA percentile scores across key BASIC categories, DOT safety rating, recent inspection and crash history, insurance standing, and how consistently that record holds steady over time. Carriers with scores below common screening thresholds, clean inspection trends, and documented safety programs get first access to premium freight. Carriers with volatile or rising scores get flagged, questioned, or quietly passed over.
The Safety Signals Shippers Check First
Most shipper and broker screening starts with the same public data source, the FMCSA Safety Measurement System. It is free, it updates monthly, and it gives anyone with your DOT number a percentile view of how your fleet compares to similar carriers. A handful of categories carry outsized weight in that first look.
Why Percentile Scores Matter More Than Raw Numbers
A CSA score is not a grade out of 100 in the traditional sense. It is a percentile ranking against comparable carriers, updated monthly as new inspection and crash data comes in. A score of 20 means your fleet performs safer than roughly 80 percent of similar carriers. A score climbing past 65 or 70 in a safety-critical category is where most shipper screening tools start rejecting a carrier automatically, regardless of everything else on the profile.
FleetRabbit tracks your CSA percentiles, inspection trends, and compliance documentation automatically, so you catch a rising score before it costs you a contract. If you want to see where your fleet stands, you can start a free trial today.
What Your Score Range Signals To A Broker
Shippers and brokers rarely look at a single number in isolation. What they actually notice is where your percentile falls relative to common screening thresholds, and whether that number is trending up or holding steady.
| Percentile Range | What It Generally Means | How Shippers React |
|---|---|---|
| Below 30 | Strong, well-managed safety performance | Preferred carrier status, priority access to premium freight |
| 30 to 50 | Solid performance with room for improvement | Generally approved with standard onboarding |
| 51 to 65 | Elevated risk relative to peer carriers | Increased scrutiny, follow-up questions, closer monitoring |
| Above 65 to 70 | Approaching or past common intervention thresholds | Many automated screening tools reject the carrier outright |
Beyond CSA: The Rest Of The Risk Picture
A percentile score is the fastest signal to check, but experienced shippers rarely stop there. A fuller risk profile looks at trend direction and documentation just as closely as the number itself.
Consistency Over Time
A carrier holding a stable, low percentile for eighteen months reads very differently than one that just dropped from 70 to 40 last quarter. Shippers increasingly weigh stability as a proxy for how well a safety program is actually managed day to day, rather than reacting to a single good month.
Documented Corrective Action
When a violation does occur, having a documented response, whether that is additional driver training, a maintenance protocol change, or a formal DataQs challenge for inaccurate data, shows a shipper that problems get addressed rather than ignored.
Recent Inspection Volume
A carrier with very few inspections can see wild percentile swings from a single event. Sophisticated shippers know to look at inspection count alongside the score itself, since a thin sample size can make a score look worse, or better, than the underlying operation actually is.
Driver Qualification Records
Pre-employment screening history, valid medical certifications, and clean license records round out the picture. Brokers increasingly ask for this documentation directly during onboarding rather than relying on public data alone.
FleetRabbit centralizes inspection history, driver qualification files, and maintenance records into one clean profile you can share with any shipper or broker on request. Ready to see your fleet's full safety picture in one dashboard? Book a free demo and we'll walk through it together.
Building A Safety Record That Wins Freight
Improving how shippers and brokers see your fleet is rarely a single fix. It is a discipline built from consistent habits repeated month after month.
Review Your Score Monthly, Not Occasionally
The Safety Measurement System updates every month. Checking your percentiles on that same cadence, right after each update, lets you catch a negative trend within thirty days instead of finding out from a broker who quietly stopped calling.
Target The Highest-Weighted BASICs First
Not every category carries equal weight in a shipper's eyes. Focusing driver training and maintenance attention on Unsafe Driving, Hours-of-Service, and Vehicle Maintenance typically produces the fastest visible improvement in how your fleet is perceived.
Challenge Inaccurate Data Promptly
Roadside inspection data is not always recorded correctly. The FMCSA's DataQs program allows carriers to formally dispute violations they believe were logged in error, and a meaningful share of well-documented challenges result in a correction to the record.
Shippers and brokers are already looking. FleetRabbit helps you monitor CSA percentiles, track inspection trends, and organize compliance documentation before a rising score costs you a contract. Start free and get a clear view of your fleet's safety standing today.







