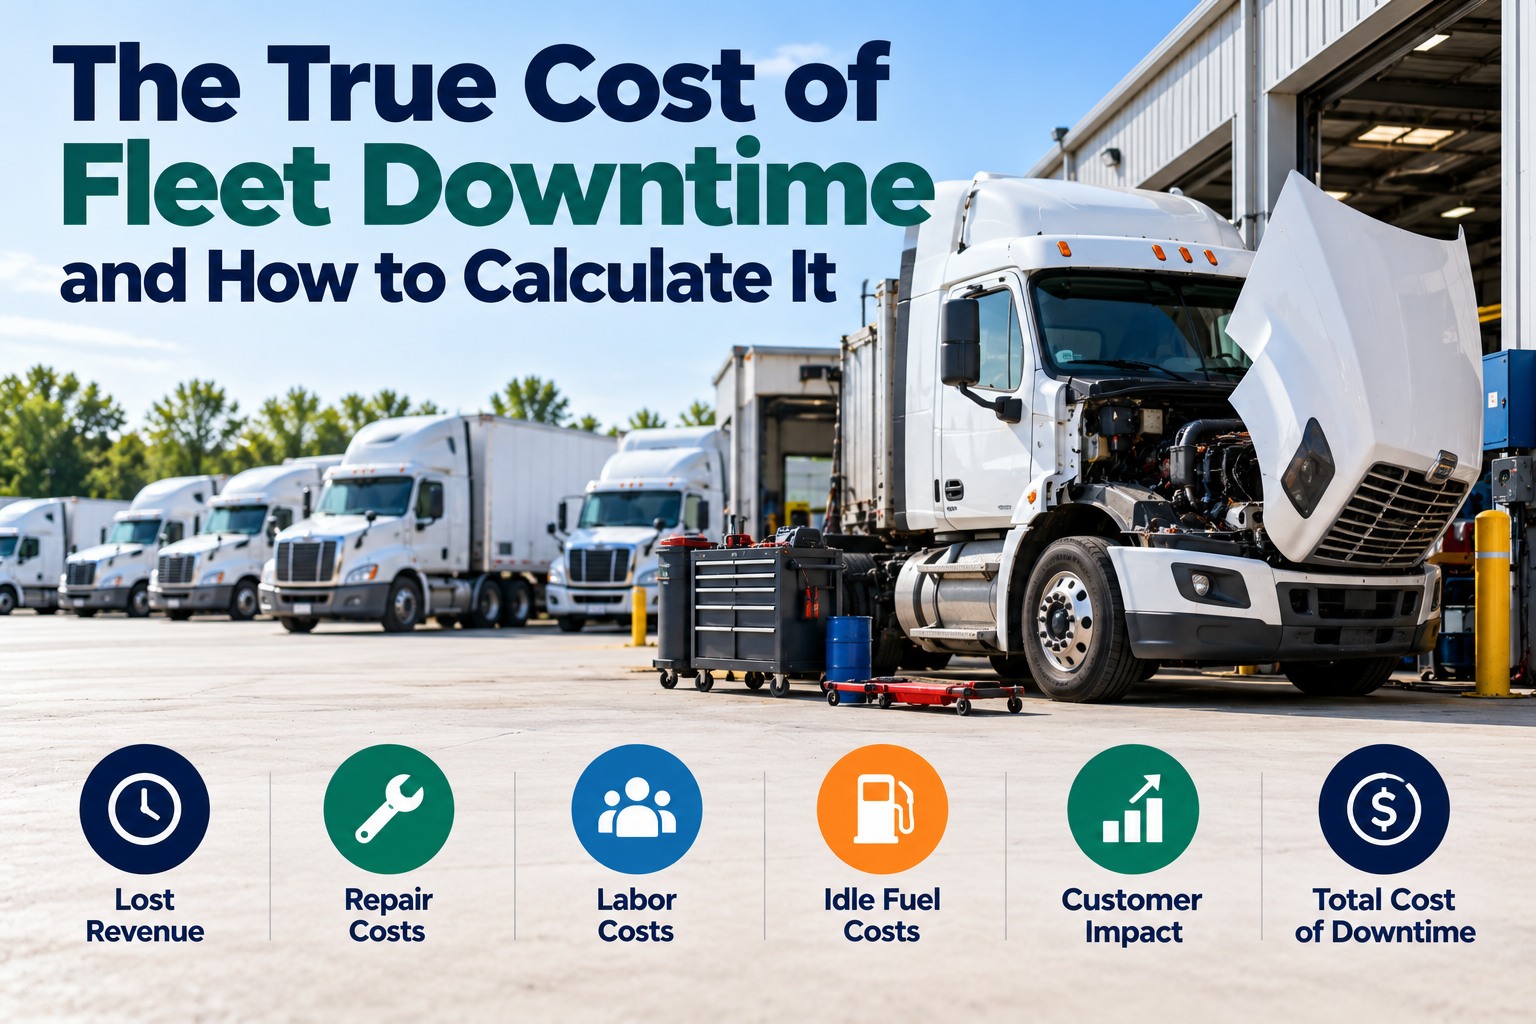
The cost of fleet downtime is the repair bill plus everything that stops earning or keeps costing while the truck sits: lost revenue, fixed costs, driver pay, substitute capacity and towing. Most fleets only track the repair line. This page gives a five-line formula, a worked example with its assumptions shown and the inputs to collect so you can calculate your own number. Schedule a call to measure your fleet's downtime cost.
DOWNTIME COST · FORMULA, EXAMPLE AND INPUTS
The Repair Invoice Is Only One of Five Lines on a Day of Downtime
A five-line formula for what a down truck really costs, a worked example and what to track so the number is yours.
ILLUSTRATIVE DOWN DAY, ONE TRUCK
Repair eventVaries
Driver and fixed$490
Lost revenue$1,050
Assumed numbers. Replace with yours.
The Five-Line Downtime Cost Formula
Add five lines per down day, and track the repair line separately per event
The structure follows a worksheet from a truck dealer's blog. Its inputs are not sourced, so supply your own. Annual cost is fleet size x downtime days per truck x cost per day.
1
Lost revenue
Daily miles x revenue per mile
Revenue the truck would have earned that day.
2
Fixed costs that keep running
(Truck payment + insurance + overhead) / working days
The truck still costs money while it sits.
3
Driver cost
Daily driver pay if idle or repositioned
Wages continue even when the truck is down.
4
Substitute capacity
Rental day rate or spot-market premium
What it costs to cover the load another way.
5
The repair event
Parts + labor + towing
The part most fleets already track.
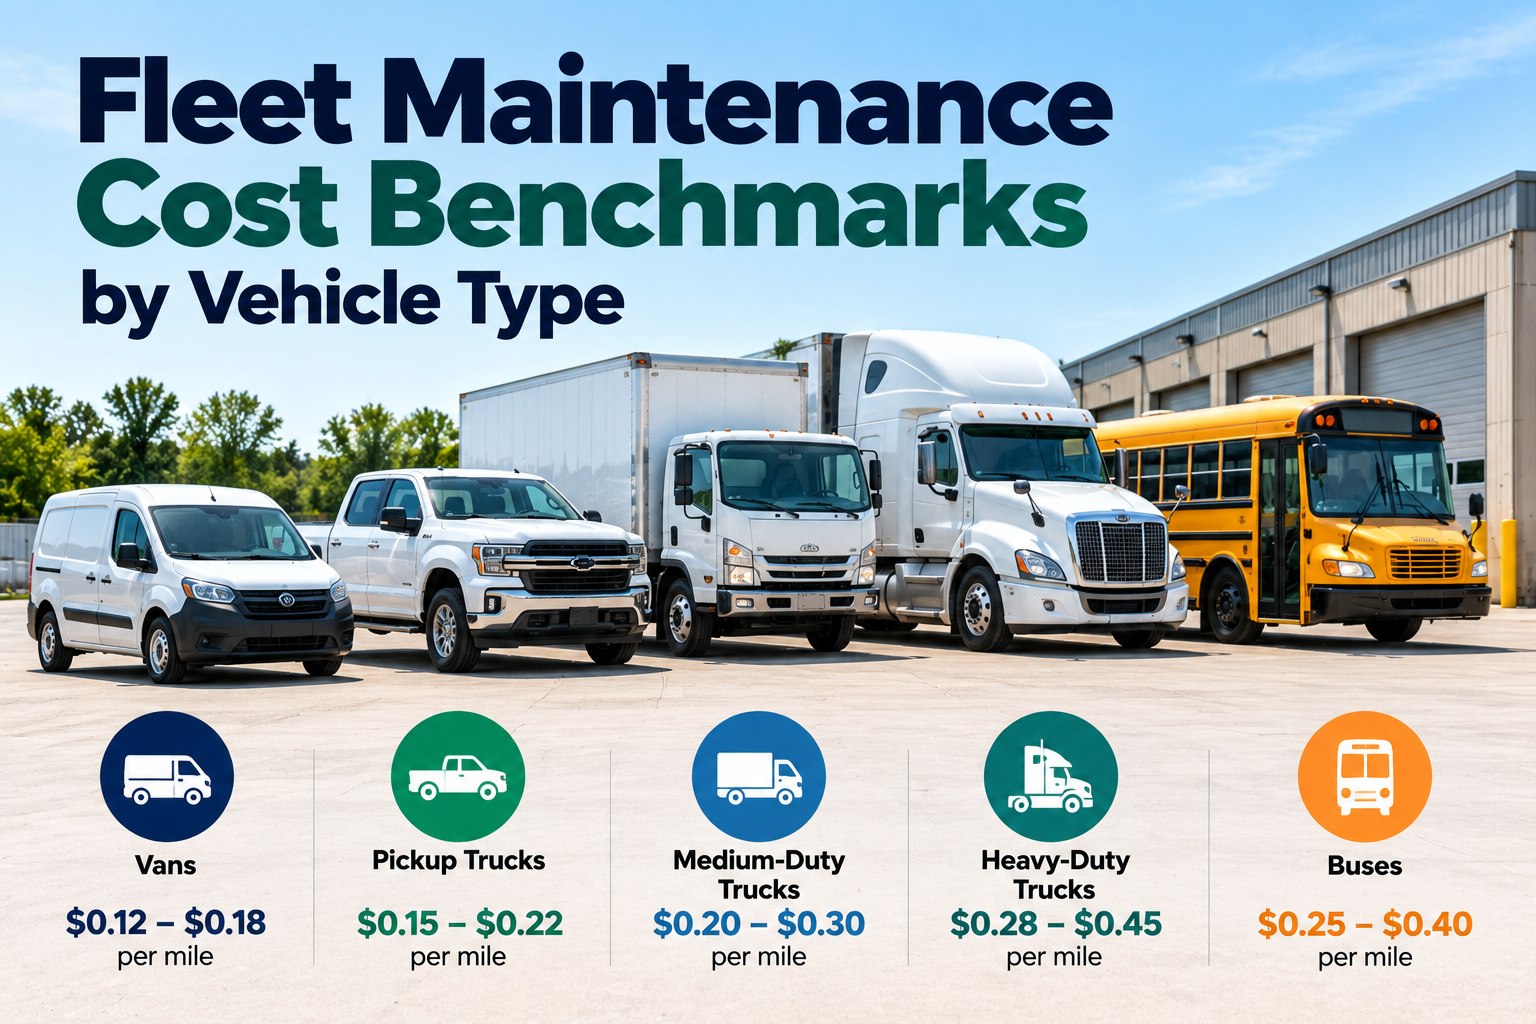
Per-mile costs are only a proxy. The American Transportation Research Institute reports operating cost per mile for a running day, but a down day has zero miles and no fuel is burned. Using cost per mile times miles overstates what a down day costs. Use your own revenue and fixed-cost figures.
Worked Example: One Down Day, Then a 50-Truck Year
Every number is an assumption, so replace each with your own before relying on the result
| Line | Illustrative day | Note |
|---|
| Lost revenue | $1,050 | 450 miles at $2.33 a mile, assumed |
| Fixed costs | $250 | Assumed daily share of payment, insurance and overhead |
| Driver cost | $240 | Assumed idle day |
| Substitute capacity | $0 | No rental in this example |
| Daily cost before repair | $1,540 | Add parts, labor and towing per event |
At about $1,540 a down day before the repair bill, 50 trucks at a 5 percent downtime rate lose 625 truck-days, and a one-point improvement recovers 125 of them. Truck-days assume 250 working days.
| Scenario, 50 trucks | Downtime rate | Truck-days lost | Cost at $1,540 a day |
|---|
| Current | 5% | 625 | $962,500 |
| After improvement | 4% | 500 | $770,000 |
| Difference | 1 point | 125 | $192,500 |
Do you know your fleet's downtime rate? Schedule a call and we will measure it from your work orders.
Out-of-service days per truck, by cause.
How Long Common Failures Keep a Truck Down
A brake job is a day or two, and an engine failure can be weeks
One vendor lists typical hours down for Class 8 failures, shown below. The figures are unsourced vendor estimates, and the same page puts direct repair costs from $2,500 for brakes to $15,000 or more for an engine. Use them as an order of magnitude and replace them with your own work-order history.
TYPICAL HOURS DOWN BY CLASS 8 FAILURE TYPE. VENDOR ESTIMATES, UNSOURCED
Brake failure
12 - 24 hours
Transmission failure
48 - 168 hours
Engine failure
72 - 240 hours
Brakes
Shorter jobs, but brakes are a leading out-of-service finding, so a failed inspection adds days.
Transmission
Days to a week, with a replacement unit and a driver waiting.
Engine
The longest stoppages. Preventing them is where maintenance records matter most.
What to Track So the Number Is Yours
Five inputs turn a generic formula into your fleet's downtime cost
Track Every Day a Truck Is Down and What It Cost: Measure Downtime by Cause in FleetRabbit
FleetRabbit records work orders with dates, causes, parts, labor and cost for every vehicle, so you can see downtime per truck and which failures repeat. Free for up to 3 vehicles, then $5 per vehicle per month.
Work orders with dates
Cost by cause and unit
PM reminders before due
Free for 3 vehicles
Frequently Asked Questions
Quick answers on the cost of fleet downtime
How do you calculate the cost of fleet downtime?
Add lost revenue, continuing fixed costs, driver cost, substitute capacity and the repair event for each down day, then multiply by truck-days lost.
How much does a day of truck downtime cost?
Vendor sources cite figures from about $448 to $760 a day up to well over $1,000. None are measured, so calculate your own.
Is cost per mile the right way to price downtime?
Not exactly. A down day has no miles, so use revenue and fixed costs per day instead.
What is a downtime rate?
The share of working days a truck is out of service. Multiply it by 250 working days for downtime days per truck.
Which failures cause the longest downtime?
Engine and transmission failures. Vendor estimates run from days to over a week.
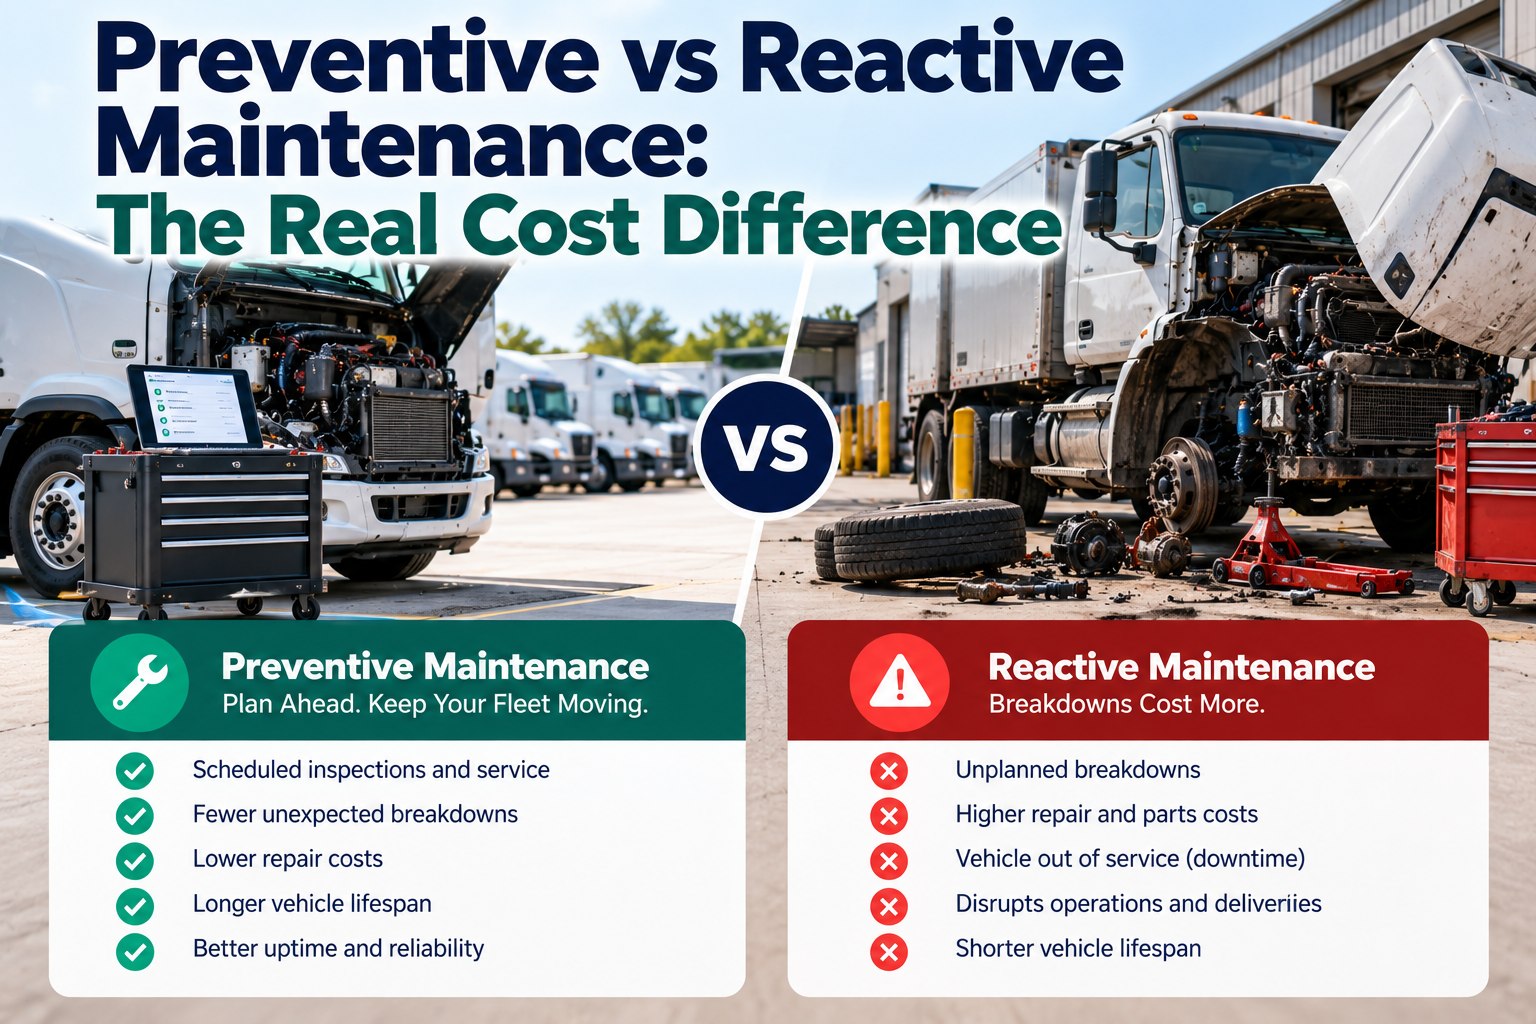
How can preventive maintenance reduce downtime?
By catching defects before they strand a truck. Vendor claims of 30 to 50 percent are unsourced, so measure your own before and after.
What does FleetRabbit cost?
FleetRabbit is free for up to three vehicles and $5 per vehicle per month after that.
Track 3 vehicles free.
Put a Dollar Figure on Every Down Day and Cut the Repeats
Track when trucks go down and why, price the day with your own numbers and aim maintenance at the failures that cost the most.
Free tier for up to 3 vehicles · No credit card required · Work orders stored per vehicle
October 16, 2026
By Emily Parker
All Articles