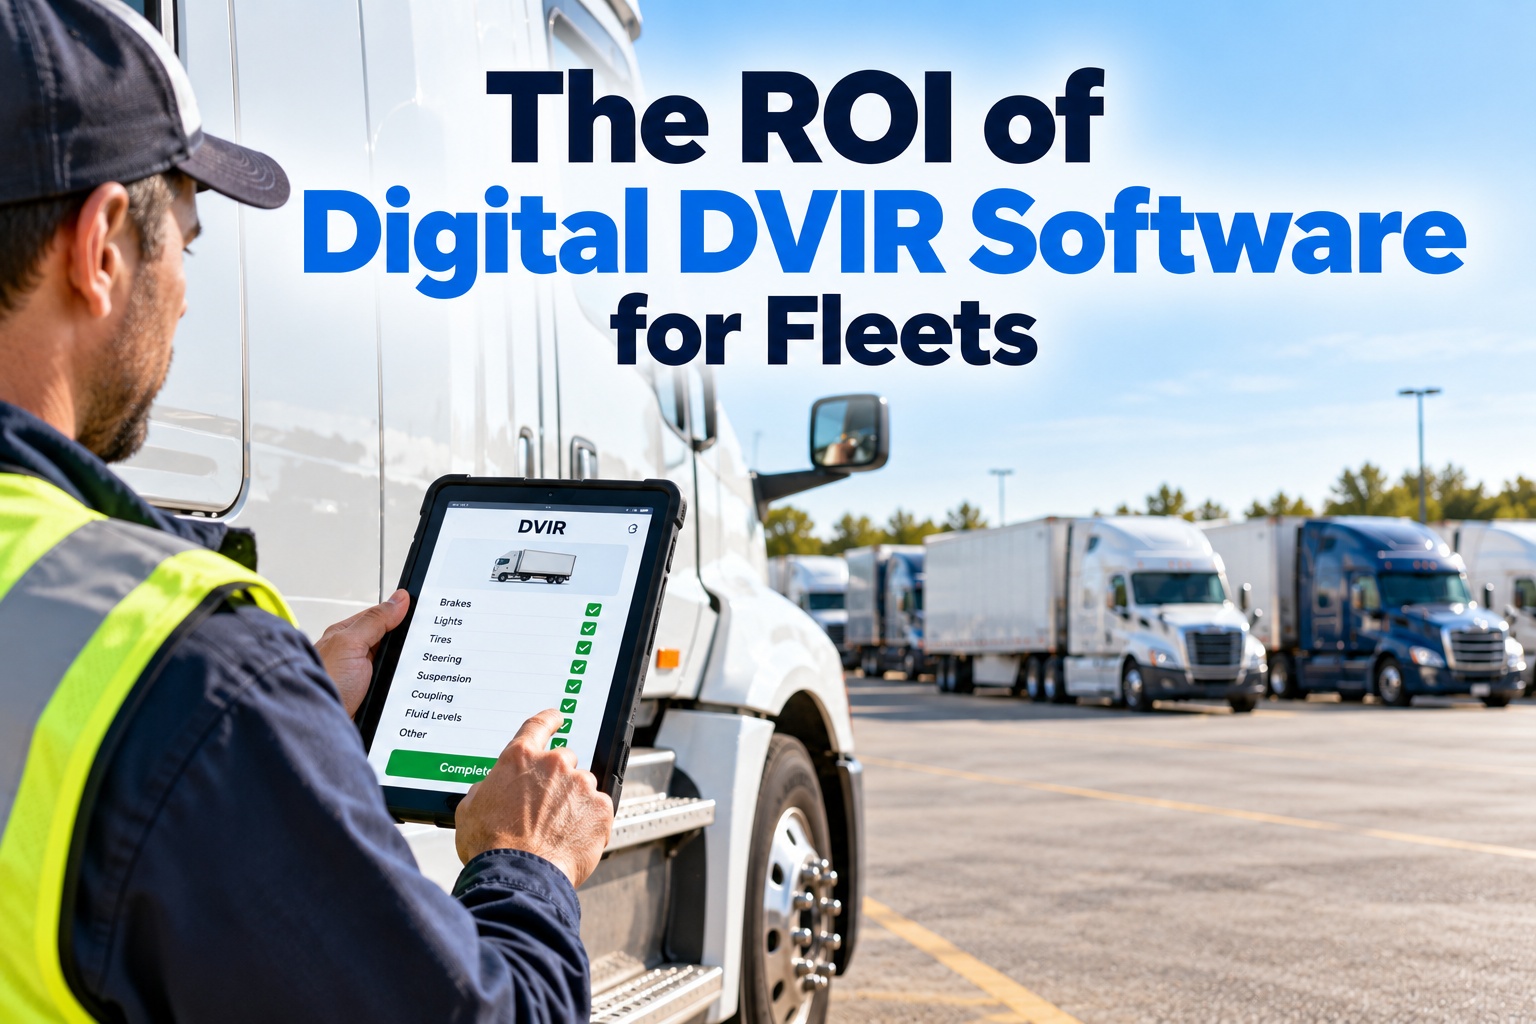
Most ROI claims for digital DVIR software are hard to check. Even FMCSA, when it published its February 2026 rule confirming that driver vehicle inspection reports may be created and kept electronically, said it could not quantify the savings because it had no data on how many carriers would switch. That doesn’t mean there is no return. It means the return depends on your fleet, and you should calculate it with your own numbers. This guide shows where the value of a digital DVIR comes from, how to put a dollar figure on each part, a worked example for 25 trucks, and the inputs to measure before and after. To model the payback on your fleet, book a short demo with our team.
What the rules require, and what the February 2026 rule changed
Under 49 CFR 396.11, drivers must prepare a written report at the end of each day’s work covering the parts and accessories listed in the rule. For property-carrying vehicles, a report is only required when a defect is found or reported; passenger carriers still file every day. Before the vehicle is dispatched again, the carrier must certify that any reported defect was repaired or that repair wasn’t needed. The next driver reviews the last report under 396.13, and reports are kept for three months.
The 2026 rule is permissive, not a mandate. It confirms what many fleets already did. The case for switching is therefore a business case, not a compliance deadline, which is exactly why an honest ROI calculation matters.
Five sources of return, and how to put a dollar value on each
Each source of value has its own input. Some are easy to measure, such as office time. Others, such as breakdowns avoided, need a few months of before-and-after data. Count only the ones you can measure in your own fleet.
Office time
Defect-to-repair speed
Roadside outcomes
Audit readiness
Repair planning
Paper and digital DVIRs compared, cost line by cost line
| Cost line | Paper DVIR | Digital DVIR |
|---|---|---|
| Forms and supplies | Printed books, carbon copies, binders | Phones or tablets drivers often already carry |
| Getting the report in | Handed in at the end of the shift, or later | Arrives when the driver submits it |
| Reading the defect | Handwriting, no photo, follow-up calls | Selected from a list, with a photo |
| Repair certification | Signed on the form if someone remembers | Required before the defect can be closed |
| Storage for 3 months | Filing cabinets and boxes | Stored with the vehicle record |
| Finding a report for an audit | Searched by hand, sometimes missing | Searched by truck and date |
| Spotting repeat defects | Practically impossible | Defect history by truck and component |
The penalty side: what poor DVIR records can cost in an audit
Penalties shouldn’t be the main reason to buy software, but they belong in the calculation as risk. FMCSA’s civil penalty schedule in 49 CFR Part 386, Appendix B, sets the current maximums.
Those are maximums, not typical fines, and the amount assessed depends on the case. For ROI purposes, don’t count a penalty you weren’t going to pay. Count instead the time your team spends preparing for an audit, and the risk of an incomplete record turning into a violation. A digital record that requires a repair certification before a defect can be closed makes the second much less likely.
The break-even point: about 24 seconds per truck per working day
Turn the question around. Instead of asking what the software will save, ask how much it has to save to pay for itself. At FleetRabbit’s Business price of $50 per vehicle per year, 250 working days and an office cost of $30 an hour, the software breaks even if it saves about 0.4 minutes of office time per truck per working day. That is roughly 24 seconds, before counting any repair, breakdown or audit benefit.
Use your own price, days and labour cost; the method stays the same. If the break-even is that low on office time alone, the real decision is less about whether the software pays and more about whether the fleet will use it well enough to capture the larger benefits.
A worked example: 25 trucks on FleetRabbit’s Business plan
The figures below are illustrative. Replace each input with your own and keep the method. The software cost uses FleetRabbit’s published Business price of $50 per vehicle per year, billed annually.
This example counts only two of the five sources, and only one avoided breakdown. It leaves out roadside out-of-service orders avoided, audit preparation time and better repair planning. That is deliberate: a conservative model you can defend is worth more than a large number nobody believes. If the two easiest benefits already cover the cost, the rest is upside.
Measure these five inputs for a month before you switch
Measure the same five again after three months on digital DVIRs. The difference, valued with the formulas above, is your real ROI. The defect-to-shop time is usually the measure that moves most, and it is the one that drives the breakdown and roadside numbers, because a defect the shop learns about the same afternoon can be fixed before the truck leaves the next morning.
Why repeat defects are where the long-term return hides
Paper DVIRs are read once and filed. Digital ones can be searched. After a few months, the defect history shows patterns that paper never could: the same air leak on the same trailer every fortnight, lights failing on one model, a brake adjustment that keeps returning on trucks serviced by one vendor. Each pattern is a repair that is being paid for repeatedly. Fixing the root cause once is often worth more than all the office time saved, but it only shows up when defects are recorded the same way, against the same unit, in a system you can query.
The same history makes inspections more useful to drivers. A driver who can see that the last report noted a leaking glad hand, and that it was repaired yesterday, checks it with more care than a driver handed a blank form.
Rolling out digital DVIRs so the return actually arrives
Start with one terminal or one group of trucks for a month, and run the five measures before and after. Train drivers on the walk-around, not the app: the app is the easy part, and the inspection is what finds the defect. Set a same-day target for the shop to acknowledge every defect, and review it weekly in the first month. Then expand truck by truck, keeping paper as a backup until every driver has completed a week of digital reports. Fleets that switch everything on one Monday tend to spend the first month fixing logins rather than defects.
What makes the return disappear
From walk-around to certified repair, on one record per truck
See how FleetRabbit handles the DVIR and DOT inspection workflow, and how the repairs it creates feed preventive maintenance schedules so recurring defects become planned work.