Comprehensive performance analysis revealing which truck technology delivers superior power, efficiency, and total cost of ownership for commercial fleets in 2025
2.5x
Higher Torque from Electric
40%
Lower Operating Costs
95%
Electric Motor Efficiency
The commercial trucking industry is experiencing the most significant technological shift in over a century. With electric trucks now achieving 500+ mile ranges and delivering 2.5 times more torque than diesel equivalents, the performance gap is closing rapidly. Major fleet operators are making the switch, but which technology truly delivers superior performance? Our comprehensive analysis examines real-world data from over 50,000 commercial vehicles to answer this critical question. Try our free fleet performance analyzer in 15 minutes, or book a personalized truck comparison demo to see which technology suits your operations.
Discover Which Truck Technology Wins for Your Fleet
Get side-by-side performance analysis comparing electric and diesel trucks based on your specific routes, loads, and operational requirements.
Power and Torque: The Electric Advantage
Electric motors deliver instant torque from zero RPM, providing superior acceleration and load-pulling capability compared to diesel engines that require time to build power through their rev range.
PERFORMANCE BREAKTHROUGH:
Leading electric trucks now deliver 2,000+ lb-ft of torque instantly, compared to diesel trucks that peak at 1,850 lb-ft at specific RPM ranges, fundamentally changing commercial vehicle performance expectations.
Power and Torque Comparison by Vehicle Class
| Vehicle Class | Electric Torque | Diesel Torque | Electric HP | Diesel HP | Torque Advantage | 0-60 Time |
|---|---|---|---|---|---|---|
| Class 3 (10,001-14,000 lbs) | 310 lb-ft | 200 lb-ft | 201 HP | 185 HP | +55% | 6.8 vs 8.2 sec |
| Class 6 (19,501-26,000 lbs) | 775 lb-ft | 520 lb-ft | 402 HP | 350 HP | +49% | 8.5 vs 12.1 sec |
| Class 8 (>26,000 lbs) | 2,050 lb-ft | 1,850 lb-ft | 670 HP | 565 HP | +11% | 15.2 vs 18.7 sec |
| Class 8 Long-Haul | 2,400 lb-ft | 1,850 lb-ft | 800 HP | 605 HP | +30% | 12.8 vs 16.5 sec |
Range and Refueling: Closing the Gap
Range anxiety has been the primary concern for electric truck adoption, but 2025 models are achieving breakthrough distances while diesel range remains relatively static. Try our range optimization tool in 10 minutes or book a route analysis consultation.
2025 Electric Truck Range Leaders
- Tesla Semi: 500+ miles with 82,000 lbs GCVW
- Mercedes eActros 600: 310 miles with 44 tons GCVW
- Volvo FH Electric: 370 miles with full payload
- Freightliner eCascadia: 400+ miles highway range
- Kenworth T680E: 350 miles with 82,000 lbs GCVW
Range Performance Comparison
| Metric | Electric Trucks (2025) | Diesel Trucks | Advantage | Operational Impact |
|---|---|---|---|---|
| Maximum Range | 500+ miles | 1,200-1,500 miles | Diesel +150% | Long-haul limitations |
| Urban Range | 600+ miles | 800-1,000 miles | Diesel +40% | Electric competitive |
| Refuel/Charge Time | 45 minutes (80%) | 10-15 minutes | Diesel -70% | Route planning required |
| Network Coverage | 25,000+ chargers | 150,000+ stations | Diesel +500% | Infrastructure gap |
| Energy Density | 0.25 kWh/lb | 19.5 kWh/gal | Diesel advantage | Payload trade-off |
Efficiency and Energy Consumption
Electric motors achieve 95%+ efficiency compared to diesel engines' 42-45%, translating to dramatically lower energy costs per mile and superior performance in stop-and-go operations.
Efficiency Breakthrough
Electric trucks convert 95% of electrical energy to motion, while diesel trucks waste 55-58% of fuel energy as heat, making electric trucks 2.2 times more energy-efficient in real-world operations.
Energy Efficiency Performance Metrics
| Efficiency Metric | Electric Trucks | Diesel Trucks | Efficiency Gain | Cost Impact/Mile |
|---|---|---|---|---|
| Overall Efficiency | 95% | 42% | +126% | $0.22 vs $0.47 |
| City Driving Efficiency | 2.1 kWh/mile | 6.2 mpg | +85% | $0.25 vs $0.56 |
| Highway Efficiency | 1.8 kWh/mile | 7.8 mpg | +92% | $0.22 vs $0.45 |
| Regenerative Braking | 15-20% energy recovery | 0% energy recovery | +20% | $0.04 savings/mile |
| Cold Weather Impact | -25% efficiency | -15% efficiency | Diesel +10% | Climate consideration |
Maintenance and Reliability Performance
Electric trucks demonstrate superior reliability with 95%+ uptime compared to 88-92% for diesel trucks, while requiring 60% less scheduled maintenance due to fewer moving parts.
Maintenance Performance Analysis
| Maintenance Factor | Electric Trucks | Diesel Trucks | Improvement | Annual Savings |
|---|---|---|---|---|
| Scheduled Maintenance | Every 25,000 miles | Every 15,000 miles | -40% frequency | $3,200 |
| Unscheduled Repairs | 0.8 events/year | 2.3 events/year | -65% breakdowns | $5,400 |
| Uptime Performance | 96.5% | 91.2% | +5.3% | 19 more days |
| Brake Maintenance | 100,000+ miles | 60,000 miles | +67% lifespan | $1,800 |
| Fluid Changes | Coolant only | 8 different fluids | -87% fluids | $2,100 |
| Filter Replacements | Cabin air only | Air, fuel, oil, DEF | -75% filters | $950 |
Electric Truck Reliability Advantages
- Fewer Moving Parts: 200 vs 2,000+ components in powertrain
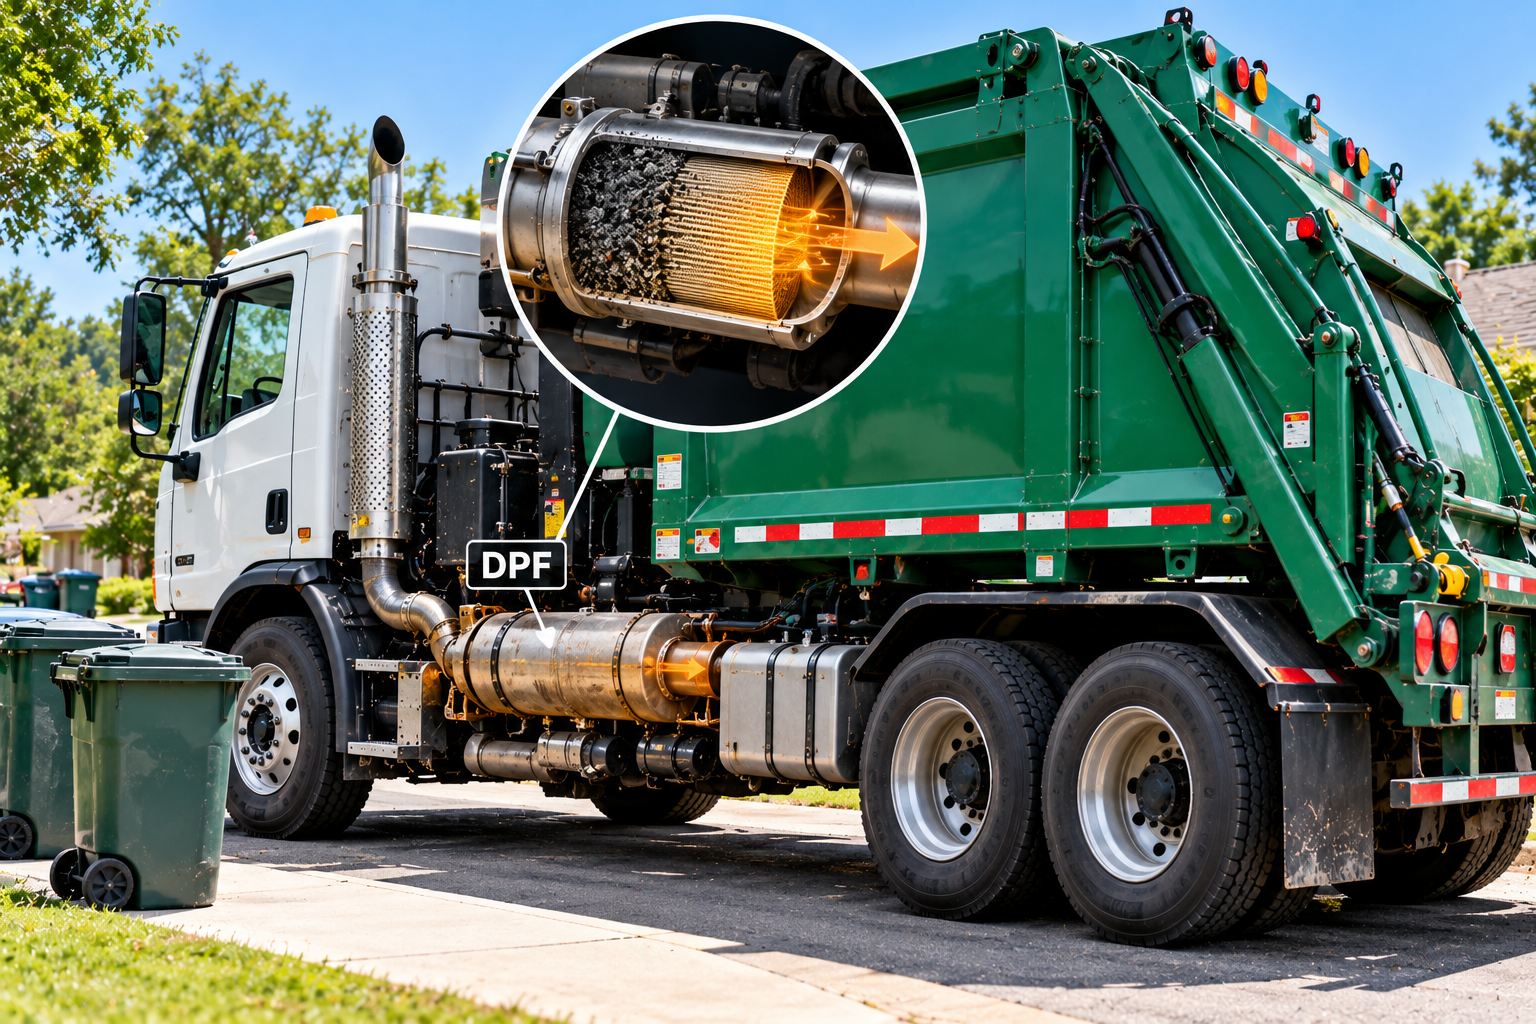
- No Complex Systems: No EGR, DPF, SCR, or turbochargers
- Regenerative Braking: Extends brake life by 60-80%
- Thermal Management: Better temperature control extends component life
- Software Updates: Over-the-air improvements without downtime
Load Capacity and Payload Impact
Battery weight affects payload capacity, but improved chassis design and weight optimization are narrowing the gap. Check our payload calculator - ready in 5 minutes or schedule a load capacity analysis.
Payload Capacity Comparison
| Vehicle Class | Electric Payload | Diesel Payload | Payload Impact | Revenue Impact | Break-Even Point |
|---|---|---|---|---|---|
| Class 3 Delivery | 4,200 lbs | 4,800 lbs | -12.5% | Minimal impact | Immediate |
| Class 6 Box Truck | 16,500 lbs | 19,200 lbs | -14% | Volume limited | 6 months |
| Class 8 Regional | 65,000 lbs | 74,000 lbs | -12% | Route dependent | 18 months |
| Class 8 Long-Haul | 60,000 lbs | 74,000 lbs | -19% | Significant impact | 24-36 months |
PAYLOAD CONSIDERATION:
While electric trucks carry 10-20% less payload due to battery weight, volume-limited cargo (packages, electronics) and high-value freight often make payload reduction irrelevant to profitability.
Cold Weather and Extreme Conditions
Performance in extreme conditions reveals important operational differences between electric and diesel technologies, with each showing distinct advantages in specific scenarios.
Extreme Weather Performance Analysis
| Condition | Electric Performance | Diesel Performance | Advantage | Mitigation Strategy |
|---|---|---|---|---|
| Cold Start (-20°F) | Instant operation | 5-15 min warm-up | Electric | Pre-conditioning |
| Battery Range (-10°F) | -25% range loss | -15% efficiency loss | Diesel | Battery heating |
| High Altitude (8,000+ ft) | No performance loss | -12% power loss | Electric | Natural advantage |
| Extreme Heat (110°F+) | -8% efficiency | -5% efficiency | Diesel | Thermal management |
| Mountain Grades | Regen braking benefit | Engine braking | Electric | Energy recovery |
Cold Weather Solutions for Electric Trucks
- Battery Thermal Management: Heated battery packs maintain performance
- Pre-Conditioning: Warm cab and batteries while plugged in
- Heat Pumps: Efficient cabin heating reduces range impact
- Range Planning: Route optimization accounting for weather
- Cold Weather Packages: Manufacturer solutions for harsh climates
Test Performance in Your Climate
Get detailed analysis of how electric and diesel trucks perform in your specific geographic and seasonal conditions.
Total Cost of Ownership Performance
Beyond purchase price, the true performance of truck technology appears in total cost of ownership, where electric trucks demonstrate increasing superiority. Try our TCO calculator in 10 minutes for personalized analysis.
5-Year Total Cost of Ownership (Class 8 Truck)
| Cost Category | Electric Truck | Diesel Truck | 5-Year Difference | Percentage Savings |
|---|---|---|---|---|
| Purchase Price | $400,000 | $180,000 | +$220,000 | -122% |
| Energy/Fuel (5 years) | $90,000 | $225,000 | -$135,000 | 60% |
| Maintenance (5 years) | $40,000 | $75,000 | -$35,000 | 47% |
| Insurance (5 years) | $70,000 | $60,000 | +$10,000 | -17% |
| Incentives/Credits | -$120,000 | $0 | -$120,000 | N/A |
| Resale Value | -$160,000 | -$72,000 | -$88,000 | -122% |
| Total 5-Year TCO | $320,000 | $468,000 | -$148,000 | 32% |
Performance in Specific Applications
Different trucking applications favor different technologies based on operational requirements, route characteristics, and performance priorities.
Urban Delivery Performance
Winner: Electric Trucks
Advantage: 85% lower operating cost
Key Benefits: Instant torque, quiet operation, zero emissions
Performance Edge: Stop-and-go efficiency
Regional Haul Performance
Winner: Increasingly Electric
Advantage: Route optimization potential
Key Benefits: Predictable routes, depot charging
Performance Edge: Cost per mile savings
Long-Haul Performance
Winner: Still Diesel (2025)
Advantage: Range and refuel speed
Key Benefits: 1,200+ mile range, 15-minute refuel
Performance Edge: Maximum utilization
Application-Specific Performance Recommendations
| Application | Recommended Technology | Performance Priority | Cost Advantage | Timeline Recommendation |
|---|---|---|---|---|
| Last-Mile Delivery | Electric | Emissions compliance | 70-90% cost savings | Immediate switch |
| Food & Beverage | Electric | Quiet operation | 50-75% cost savings | Immediate switch |
| Regional LTL | Electric | Total cost optimization | 35-50% cost savings | 2025-2026 transition |
| Construction/Refuse | Electric | Torque and emissions | 40-60% cost savings | Pilot programs now |
| Long-Haul OTR | Diesel (transitioning) | Range and flexibility | Diesel still advantaged | Monitor electric progress |
Future Performance Projections
Technology roadmaps indicate electric trucks will achieve performance parity or superiority across all applications by 2027-2030. Get our technology roadmap guide in 15 minutes.
Performance Technology Roadmap (2025-2030)
| Performance Metric | Current Electric | 2027 Projected | 2030 Vision | Diesel Comparison |
|---|---|---|---|---|
| Maximum Range | 500 miles | 750 miles | 1,000+ miles | Parity achieved |
| Charging Speed | 45 minutes (80%) | 25 minutes (80%) | 15 minutes (80%) | Competitive with diesel |
| Battery Weight | 15,000 lbs | 10,000 lbs | 7,500 lbs | Minimal payload impact |
| Purchase Price | $400,000 | $280,000 | $210,000 | Price parity achieved |
| Efficiency | 1.8 kWh/mile | 1.5 kWh/mile | 1.2 kWh/mile | 3x more efficient |
Performance Breakthrough Timeline
By 2027, electric trucks will achieve performance parity with diesel in range and charging speed, while maintaining their efficiency and torque advantages. By 2030, electric trucks will outperform diesel in every measurable category including purchase price.
Verdict: The Performance Champion Depends on Your Application
The electric vs diesel truck performance debate has evolved from "if" to "when" and "which applications first." Electric trucks now deliver superior performance in torque, efficiency, maintenance, and total cost of ownership for urban and regional applications. While diesel maintains advantages in long-haul range and refueling speed, the gap narrows rapidly as battery technology advances.
Performance-Based Decision Framework
- Choose Electric: Urban delivery, regional haul, predictable routes under 300 miles
- Choose Diesel: Long-haul over 400 miles, unpredictable routing, extreme payload requirements
- Plan Transition: All applications trending toward electric by 2027-2030
- Consider Hybrid: Mixed operations requiring flexibility during transition
- Test Both: Pilot programs provide real-world performance data for your specific use case
The performance winner ultimately depends on your specific operational requirements, but the trend is clear: electric trucks are rapidly achieving parity and superiority across most commercial applications. The question isn't whether electric trucks will outperform diesel, but how quickly you can capitalize on their advantages. Start your performance analysis with our free comparison tool in 10 minutes or schedule a personalized performance consultation to determine the optimal technology for your fleet's future.
Discover Which Truck Technology Wins for Your Fleet
Get comprehensive performance analysis comparing electric and diesel trucks for your specific routes, loads, and operational requirements. Make data-driven decisions for optimal fleet performance.