Fleet maintenance cost benchmarks give you a reference point for cost per mile and annual spend by vehicle type, but every published table has gaps. This page shows two vendor benchmark sets side by side, flags where they disagree, and explains how to build a benchmark from your own records. Schedule a call to benchmark your fleet's maintenance cost per mile.
MAINTENANCE BENCHMARKS · COST PER MILE BY VEHICLE TYPE
Know Which Quartile Your Trucks Sit In Before You Decide What to Fix
Benchmark ranges for four vehicle types, how much to trust them and how to build your own.
CLASS 8 MAINTENANCE, PER MILE
Top quartile$0.15
AverageAbout $0.22
Bottom quartile$0.34+
Vendor benchmark, 2026. Use your own data too.
Maintenance Cost per Mile by Vehicle Type
The Class 8 average sits near $0.22 a mile, and other types vary widely
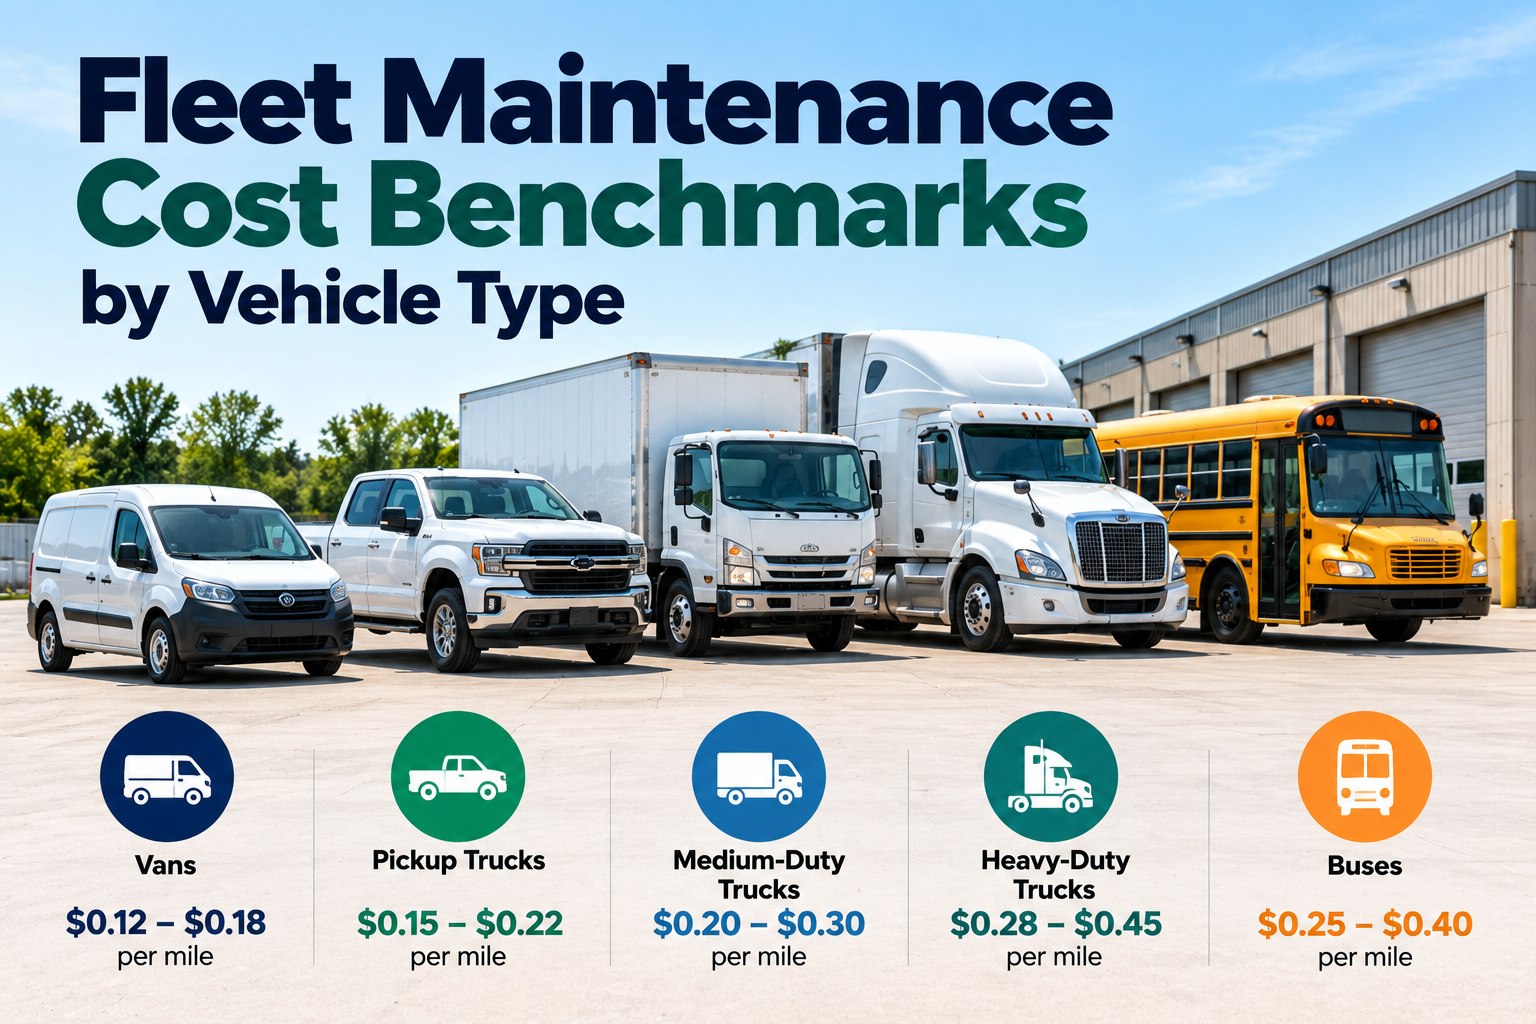
The American Transportation Research Institute reported repair and maintenance of about $0.22 a mile for trucks in 2025, as reported by FleetOwner. One vendor benchmark set for 2026 breaks cost out by vehicle type with top, average and bottom quartiles, shown below. It excludes fuel, insurance and depreciation. The vendor does not publish its sample or method.
| Vehicle type | Top quartile | Average | Bottom quartile | Annual spend |
|---|
| Class 8 OTR tractor | $0.15 | $0.22 | $0.34+ | $18K - $26K |
| Class 8 regional truck | $0.17 | $0.24 | $0.36+ | $16K - $23K |
| Class 6 box truck | $0.19 | $0.26 | $0.38+ | $9K - $14K |
| Class 3-5 van | $0.12 | $0.18 | $0.28+ | $5K - $8K |
TOP-TO-BOTTOM QUARTILE RANGE, MAINTENANCE COST PER MILE, 2026. OXMAINT VENDOR BENCHMARK
Class 8 OTR tractor
$0.15 - $0.34+
Class 8 regional truck
$0.17 - $0.36+
Class 6 box truck
$0.19 - $0.38+
Class 3-5 van
$0.12 - $0.28+
A second vendor gives different numbers, so treat any single table as a rough guide
Another vendor's 2026 table puts the Class 8 average at $0.202 a mile, with smaller ranges for medium-duty trucks and vans. Only its Class 8 row names ATRI as a source, and its other rows are unsourced. Neither table gives a sample size or says how quartiles were calculated.
| Vehicle type | Average | Top quartile | Bottom quartile |
|---|
| Class 8 tractor, OTR | $0.202 a mile | $0.12 - $0.18 | Above $0.30 |
| Medium-duty, Class 4-6 | $0.15 - $0.22 a mile | $0.10 - $0.14 | Above $0.25 |
| Service van or light fleet | $0.08 - $0.12 a mile | $0.05 - $0.08 | Above $0.15 |
Trailers use a different unit. The first vendor's trailer figures are per trailer-mile and not per tractor-mile, so do not compare them with truck rows.
Want your own cost per mile by vehicle type? Schedule a call and we will build it from your records.
Bring a year of invoices and odometer readings.
Where Does Your Fleet Land?
Three bands tell you what to do next
TOP QUARTILE
Ahead of the pack
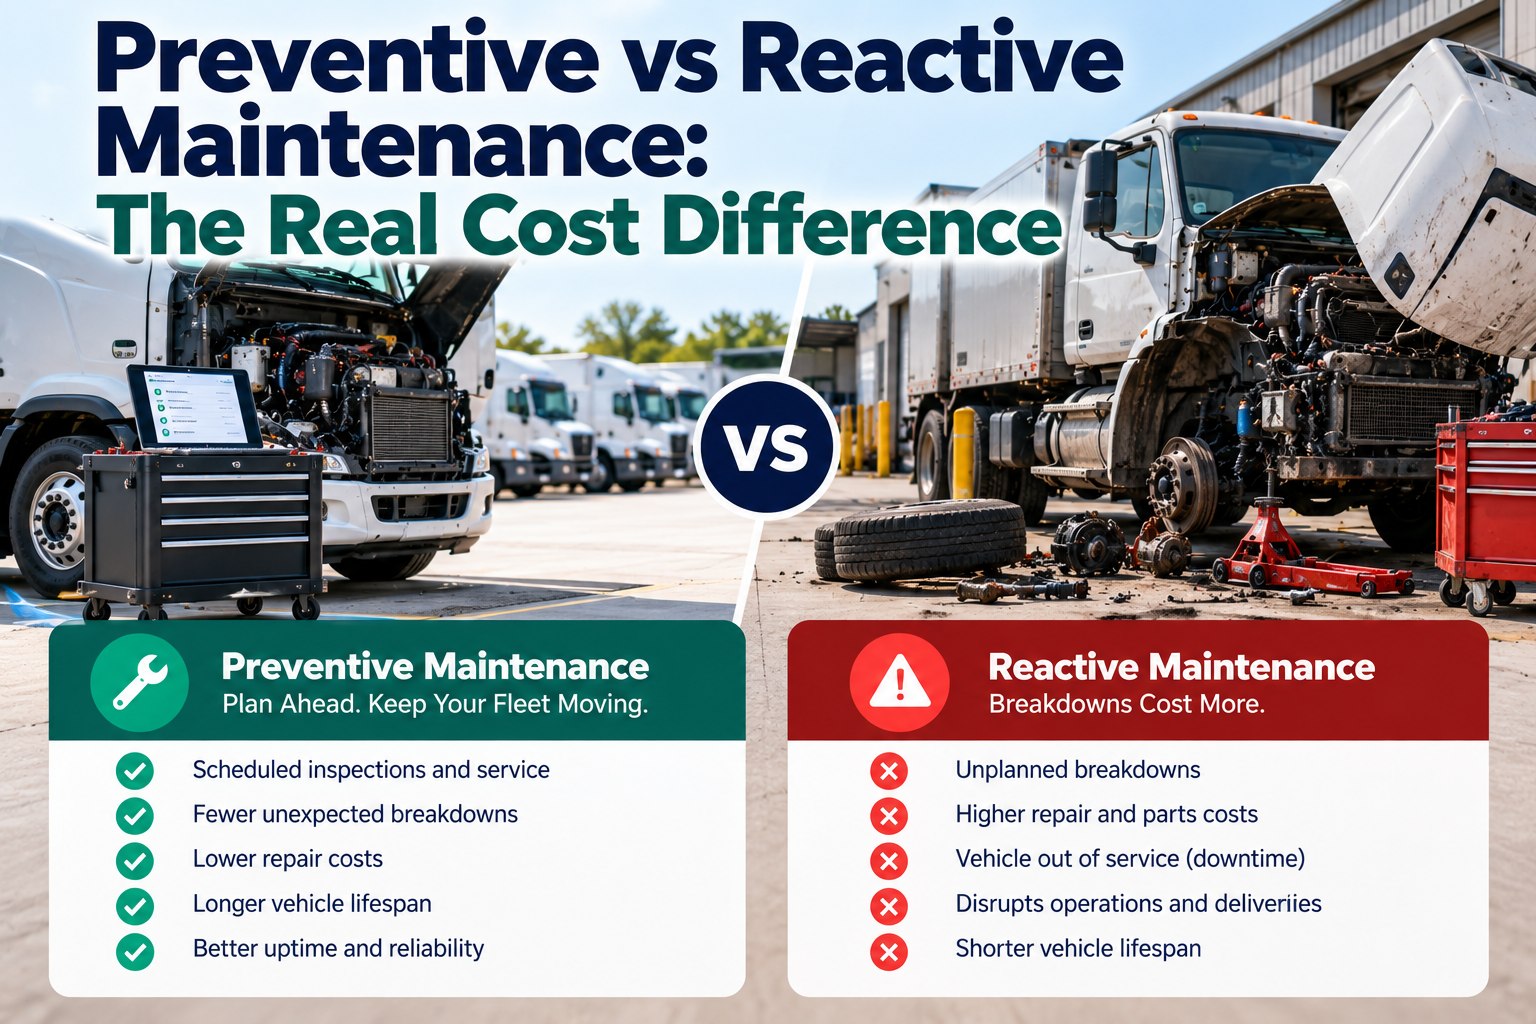
Protect it. Check that low spend is not deferred maintenance.
AROUND AVERAGE
Normal, with room to improve
Look at repeat repairs and missed services before anything else.
BOTTOM QUARTILE
Investigate now
Look for aging units, unplanned work and units that cost far more than peers.
How to Build a Benchmark From Your Own Records
Your own year-over-year trend is more reliable than any published table
One vendor says maintenance cost per mile typically doubles after year six, but gives no data, so check it against your own age bands before you use it for replacement decisions.
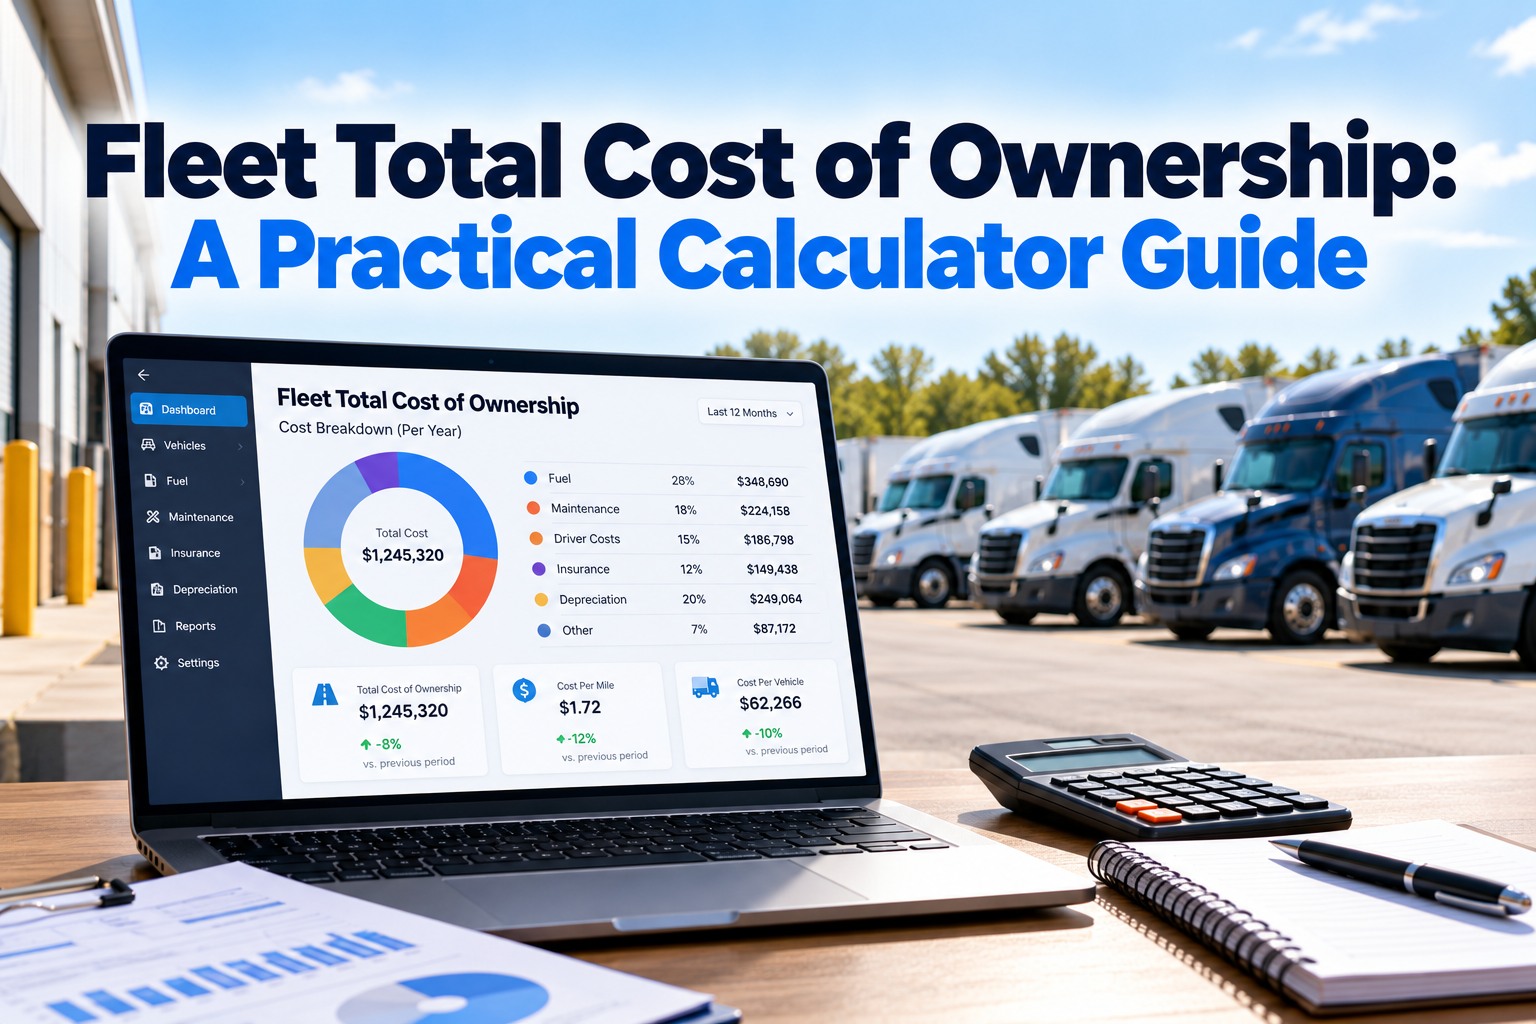
See Cost per Mile and Cost per Vehicle in One Dashboard: Track Maintenance Spend by Vehicle Type in FleetRabbit
FleetRabbit puts labor, parts and invoices for every vehicle in one record, so you can compare cost per mile by unit and vehicle type against your own history. Free for up to 3 vehicles, then $5 per vehicle per month.
Cost by unit and type
Work orders and parts
Service history per vehicle
Free for 3 vehicles
Frequently Asked Questions
Quick answers on fleet maintenance cost benchmarks
What is a normal maintenance cost per mile?
For Class 8 trucks, about $0.20 to $0.22 a mile in 2025 and 2026 sources. Other vehicle types differ, and published tables vary.
What does cost per mile include?
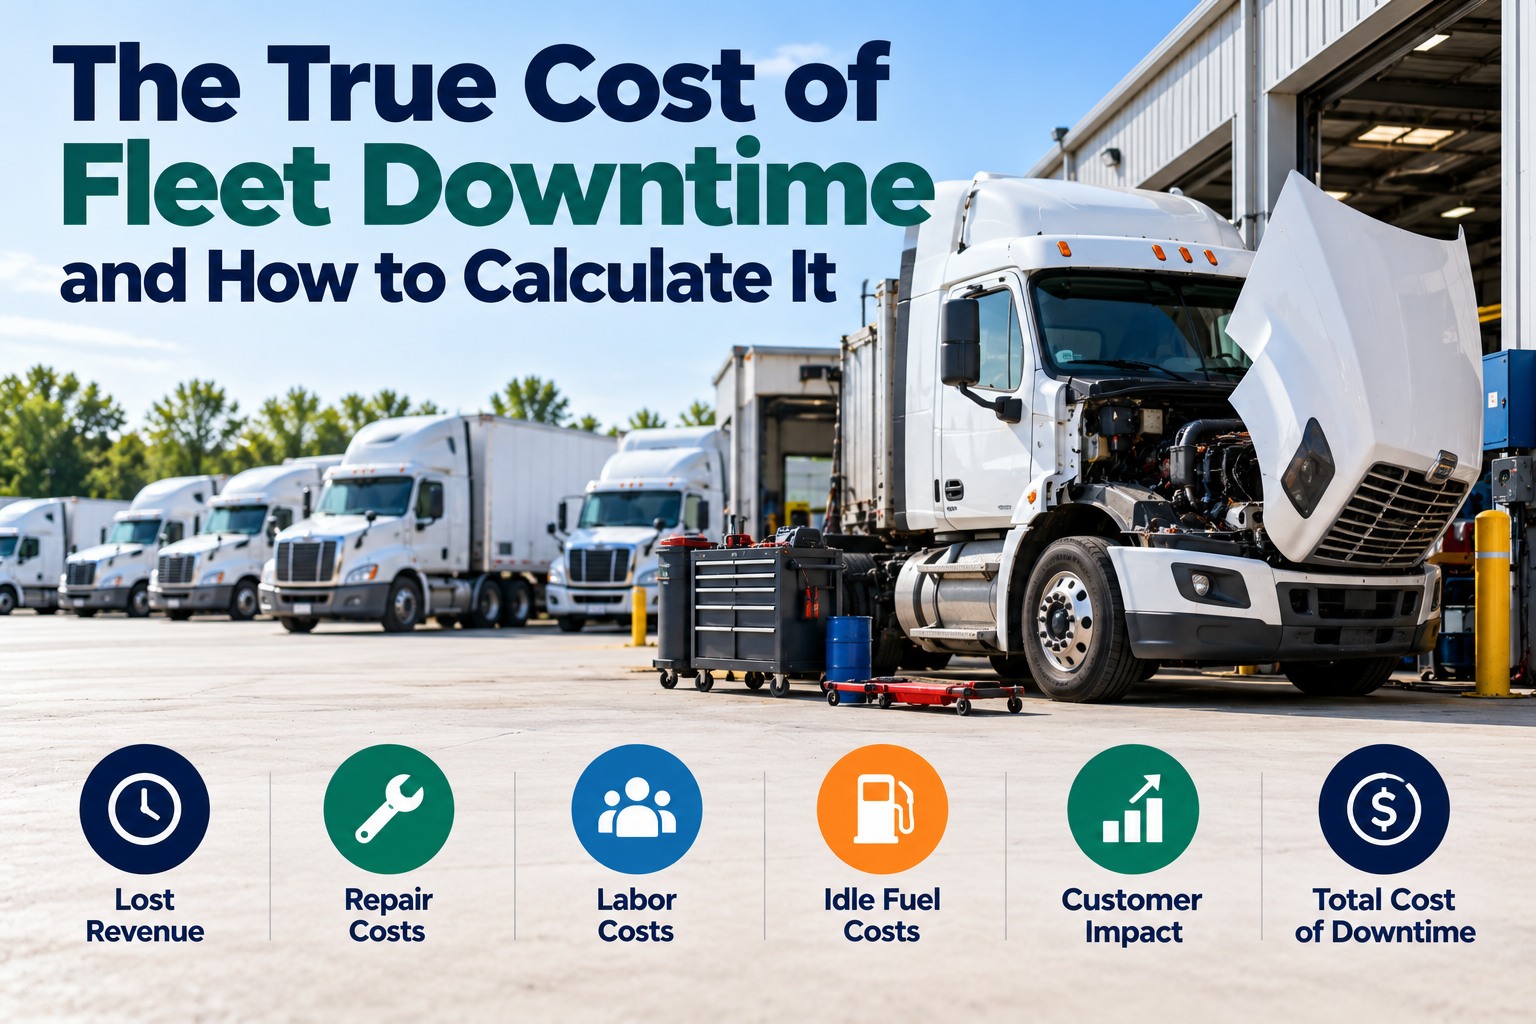
In these benchmarks, labor, parts, vendor invoices and tires. Fuel, insurance, depreciation and downtime are not included.
Why do benchmark tables disagree?
They use different samples and methods, and neither vendor publishes theirs. Compare against your own prior year first.
What is top quartile?
The best-performing quarter of fleets, meaning the lowest cost per mile. Low cost can also mean deferred maintenance, so check repair trends.
Do older trucks cost more?
Usually, but one vendor claim that cost doubles after year six has no data behind it. Check your own age bands.
How often should I benchmark?
Quarterly for cost per mile by type, and annually against published figures.
What does FleetRabbit cost?
FleetRabbit is free for up to three vehicles and $5 per vehicle per month after that.
Track 3 vehicles free.
Build Your Own Maintenance Benchmark and Watch It Every Quarter
Published tables give you a range. Your own cost per mile by unit shows what to fix first.
Free tier for up to 3 vehicles · No credit card required · Costs tracked per vehicle
October 16, 2026
By Sam Parker
All Articles