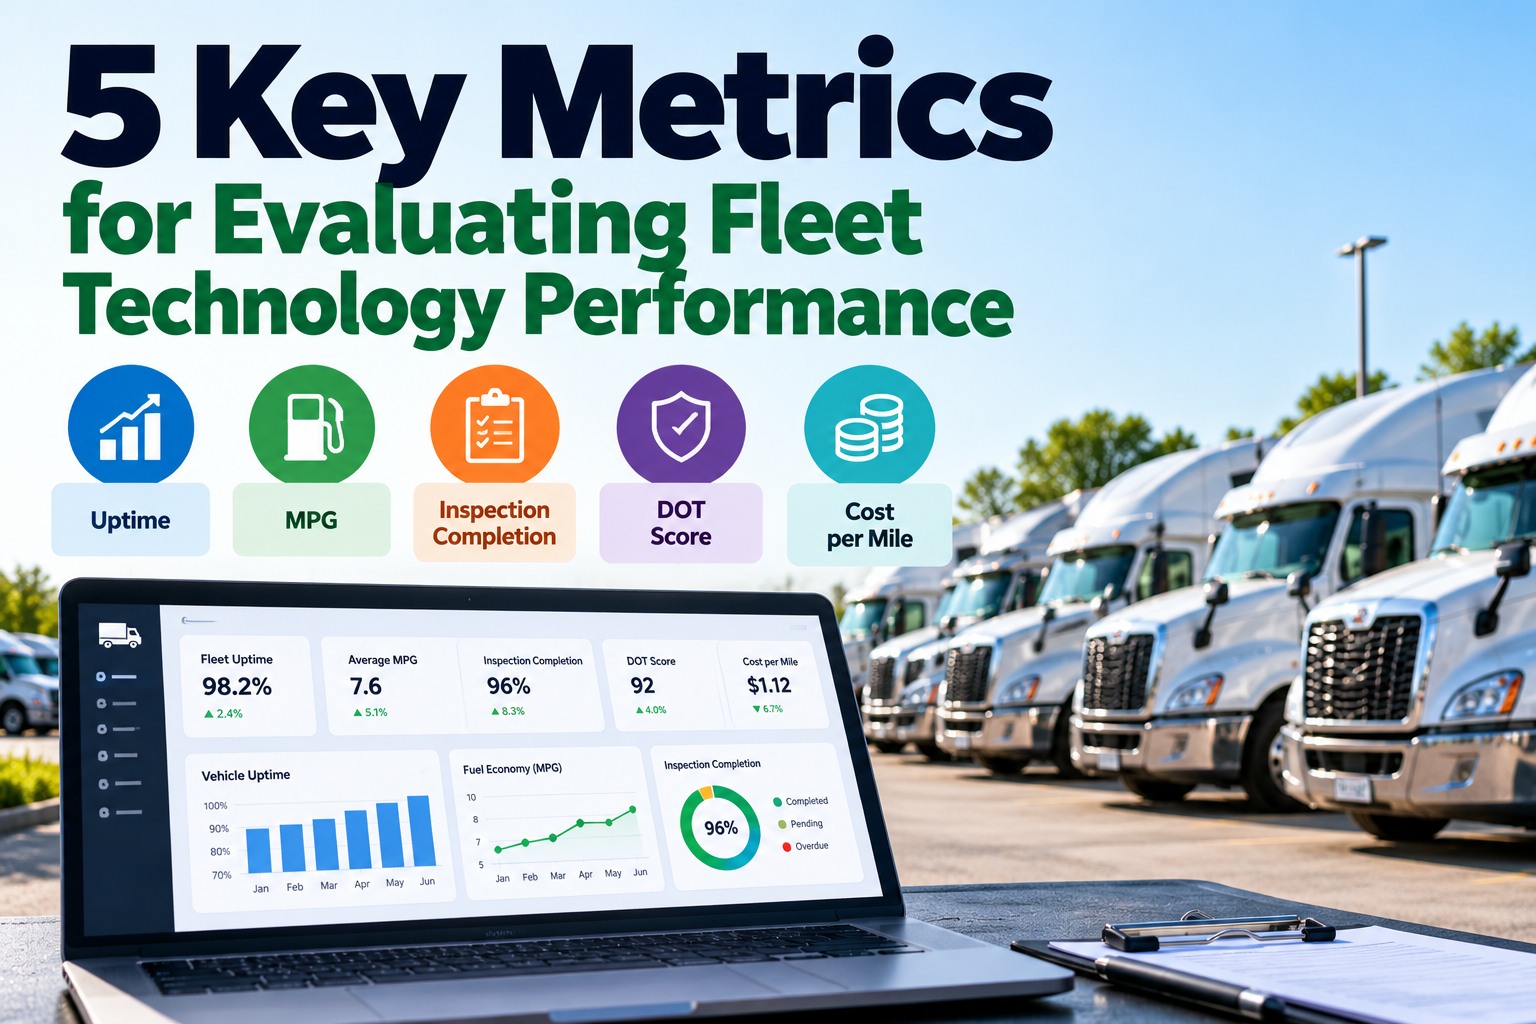
Fleet software produces more numbers than any manager can use, and most dashboards show all of them at once. The fleets that improve fastest tend to pick a short list and review it the same way every month. Five metrics cover nearly every question an owner, operations lead or safety manager asks: how often the trucks are available, how efficiently they burn fuel, whether inspections are actually happening, how the fleet looks to FMCSA, and what each mile costs. This guide defines each one, gives the formula, shows where your software should be pulling the data from, and names the trap that makes each metric look better than it is. To see these five metrics on your own fleet's data, book a short walkthrough with our team.
Fleet management software · KPIs
Five numbers tell you whether your fleet technology is working, and one of them predicts the other four
Measure availability, fuel, inspections, compliance and cost the same way every month, and the software pays for itself in the decisions it changes.
Uptime
Can we dispatch it?
MPG
Is it burning more than it should?
Inspections
Are we finding problems early?
DOT score
How do we look to FMCSA?
Cost per mile
What does it all cost?
How the five metrics connect: one leading indicator, four results
These metrics aren't independent. Inspection completion is the one you control directly, and it moves first. When inspections and repairs happen on time, unplanned downtime falls, fuel economy holds because problems like dragging brakes or underinflated tires get fixed, roadside violations drop, and cost per mile follows. When inspections slip, all four get worse a few weeks later.
Inspection completion
The input you manage every day
→
Uptime rises
MPG holds
DOT score improves
→
Cost per mile
Where every result lands
That chain is the practical case for fleet software. Paper systems can record what happened; software can show inspections slipping at one terminal before the cost shows up in next quarter's numbers. A digital DVIR and DOT inspection workflow is usually the first piece to put in place for that reason.
Metric 1 · Availability
Uptime: the share of scheduled time each truck is actually ready to run
Uptime tells you whether the fleet you pay for is the fleet you can dispatch. A truck in the shop for three days earns nothing and often forces a rental or a missed load. It is the metric operations feels first and finance feels hardest.
Formula
Hours or days a unit was available
Hours or days it was scheduled to work
What good looks like
A rising trend, with planned downtime (PM, inspections) separated from unplanned downtime (breakdowns, road calls). Most of the improvement comes from moving downtime from the second bucket into the first.
Where the data comes from
Work order open and close times, road-call records and DVIR defects that took a unit out of service.
The trap
Counting a two-hour PM the same as a two-day breakdown. Track the split, or a fleet that skips PM will look like it has better uptime right up until it doesn't.
Metric 2 · Fuel
Miles per gallon, tracked per unit and per duty cycle, not as one fleet average
Fuel is the largest single line most fleets can influence week to week. Small differences matter: across thousands of miles per truck per month, a tenth of an mpg is real money, and a sudden drop on one unit is often the first sign of a mechanical problem.
Formula
Miles driven
Gallons purchased or consumed
From NACFE's 2024 Fleet Fuel Study of 14 fleets, published January 2025, as reported by FleetOwner. Scale 0–10 mpg and 0–100%. These are leading fleets, not an industry average.
What good looks like
Each unit compared with others on the same duty cycle, with idle time tracked alongside it. Leading fleets in NACFE's studies average well above the typical tractor because they combine equipment, specification and driver behaviour.
Where the data comes from
Fuel card transactions for gallons; odometer, ECM or telematics data for miles; idle hours from the engine.
The trap
Comparing a regional box truck with a long-haul sleeper. A fleet-wide average hides both the best and worst units, and the worst ones are usually the ones with a maintenance problem.
Three of these five metrics come straight from inspection and maintenance records
FleetRabbit captures inspections, defects and work orders as they happen, so uptime, inspection completion and repair cost per mile are calculated, not compiled.
Metric 3 · Inspections
Inspection completion: DVIRs and PM inspections done on time, and defects closed before dispatch
Inspection completion is the leading indicator on this list. Uptime, fuel economy, safety scores and cost all get worse when inspections slip, but the slip shows up here first. It also matters more for safety ratings than it used to: FMCSA's approved scoring changes split out a "Driver Observed" maintenance category for defects a walk-around could have caught.
Formula
Inspections completed on time, and defects closed before the next trip
Inspections required, and defects reported
What good looks like
Completion close to every required inspection, plus a defect find rate that isn't zero. A fleet that never reports defects isn't perfect; it usually isn't looking.
Where the data comes from
DVIR submissions with timestamps, PM due dates and completion dates, and defect-to-repair certification times.
The trap
Measuring completion alone. Pencil-whipped inspections score 100% and catch nothing, so track how many defects each driver and terminal finds as well.
Metric 4 · Compliance
DOT score: your Safety Measurement System percentiles and roadside inspection results
Shippers, brokers and insurers all look at a carrier's safety record, and FMCSA uses its Safety Measurement System percentiles to decide whom to investigate. For property carriers the percentiles aren't shown publicly, but the carrier can see its own, and the underlying inspection and violation data is what customers and insurers check.
Formula
Roadside inspections with no violations, and with no out-of-service orders
All roadside inspections in the period
SMS intervention thresholds for general property carriers
Unsafe Driving, Hours of Service, Crash Indicator
Vehicle Maintenance, Driver Fitness, Controlled Substances
Above the threshold, a carrier is prioritized for FMCSA intervention. Passenger and hazmat carriers have lower thresholds. FMCSA has approved, but not yet launched, revised categories and thresholds.
What good looks like
Every category well below its intervention threshold and trending down, with each roadside violation traced to a fix. Clean inspections matter as much as avoiding bad ones, because they dilute the measure over time.
Where the data comes from
FMCSA SMS and roadside inspection reports, matched to the unit, driver and the defect or repair records behind each violation.
The trap
Treating the score as a monthly report rather than a list of causes. Each violation points to a specific unit, driver or process that can be fixed.
Metric 5 · Cost
Cost per mile: the number every other metric eventually shows up in
Cost per mile turns the other four metrics into money. Downtime, poor fuel economy, missed inspections and violations all raise it, and it is the figure owners, lenders and customers understand. ATRI's latest industry analysis put the average at $2.336 per mile in 2025, up 3.4%, with non-fuel costs at a record $1.854.
Formula
Total operating cost for the unit or fleet
Miles driven in the same period
Where a 2025 trucking mile went: $2.336 per mile (ATRI)
Wages, benefits, tires, tolls and other · ~$1.13
Fuel · ~48¢
Truck and trailer payments · 40.4¢
R&M · 21.5¢
Insurance · 10.6¢
Fuel is the difference between ATRI's $2.336 total and its $1.854 non-fuel figure. "Other" is the remainder after the named categories. Source: ATRI Operational Costs of Trucking, 2025 data, as reported by FreightWaves.
What good looks like
Cost per mile tracked by unit and by age, with repair and maintenance broken out on its own line. ATRI reported repair and maintenance at 21.5 cents a mile in 2025, up from 19.8 cents.
Where the data comes from
Fuel card data, work orders with parts and labour, tire records, and finance data for payments, insurance and wages.
The trap
Looking only at the fleet average. The units that cost the most per mile are usually a handful of older trucks, and finding them is how replacement decisions get made on evidence.
The five metrics side by side
Use this as the one-page reference for your monthly fleet review. Review cadence matters as much as the formula: daily numbers are noise for cost per mile, and monthly numbers are too late for inspection completion.
| Metric | Formula | Data source | Review | Early warning sign |
|---|
| Uptime | Available time ÷ scheduled time | Work orders, road calls | Weekly | Unplanned share of downtime rising |
| MPG | Miles ÷ gallons | Fuel cards, ECM, telematics | Weekly per unit | One unit falling against its peers |
| Inspection completion | Completed on time ÷ required | DVIRs, PM schedule | Daily | Defects closed late, or none reported at all |
| DOT score | Clean inspections ÷ all inspections; SMS percentiles | FMCSA SMS, roadside reports | Monthly | Repeat violations on the same unit or driver |
| Cost per mile | Operating cost ÷ miles | Fuel, work orders, finance | Monthly per unit | R&M per mile climbing on older trucks |
Setting targets: benchmark against your own fleet before the industry
Industry figures like ATRI's cost per mile or NACFE's fuel economy results are useful for context, but they mix segments, regions and equipment ages that may look nothing like your fleet. The more useful first target is your own baseline. Take the last six to twelve months for each metric, find the median unit, and set the first target as moving the worst quarter of units toward it. That turns a vague goal like "improve fuel economy" into a short list of trucks and drivers to work on. Once the internal spread narrows, external benchmarks become meaningful, because you are comparing a consistent fleet with an industry average rather than a handful of outliers with everything else.
Why most fleet dashboards fail to change anything
The problem is rarely missing data. It's that the numbers arrive without an owner, a target or a cadence. A metric changes decisions only when one person is responsible for it, it is compared with a target and with last month, and it can be broken down to the unit, driver or terminal causing the change. Without that, a dashboard becomes something people look at once, agree is interesting and never use. A short list reviewed every month beats a long list nobody reads. If you add a metric, take one away.
Data quality is the second failure. Cost per mile is only as good as the work orders behind it, and uptime is only as good as the open and close times on those work orders. That's why connecting inspections to preventive maintenance and repairs in one system matters more than any chart.
FleetRabbit fleet management software
FleetRabbit builds these five metrics from the records your team already creates
Drivers file inspections on their phones, technicians close work orders, and fuel and mileage come in from your existing systems. The metrics fall out of the work instead of being assembled at month-end.
Uptime
Downtime split into planned and unplanned from work order timestamps
Inspections
DVIR and PM completion by driver, unit and terminal, with defect close times
Cost
Parts, labour and repair cost per mile by unit and age
Compliance
Roadside defects traced to the inspection and repair records behind them
What the 20-minute demo covers
- Where each of the five metrics comes from in your data
- Finding the units with the worst cost per mile
- Spotting inspection gaps by terminal
- Separating planned from unplanned downtime
- Building a monthly fleet review in one screen
Good metrics only matter if they lead to action, and most of that action happens in the shop. FleetRabbit's fleet maintenance tools keep the repairs behind each metric on the unit record, so the next review starts with what changed and why.
Fleet technology metrics: common questions
What is a good cost per mile for a trucking fleet?
It depends on segment, equipment age and region, but ATRI's industry average for 2025 was $2.336 per mile including fuel and $1.854 excluding it. Compare your own trend and your units against each other first, then against the industry figure.
How is fleet uptime calculated?
Divide the time a unit was available by the time it was scheduled to work. Track planned and unplanned downtime separately so preventive maintenance doesn't look like failure.
What MPG should a Class 8 truck get?
It varies with duty cycle, load and specification. Fleets in NACFE's 2024 study averaged 7.77 mpg, a record for that group of leading fleets, so treat it as a strong benchmark rather than a typical figure.
Can I see my own CSA percentiles?
Yes. Property carriers' percentiles aren't shown publicly, but a carrier can log in to FMCSA's Safety Measurement System to see its own, along with the inspection and violation data behind them.
Which metric should a small fleet start with?
Inspection completion. It needs no extra hardware, it is the input that moves the other four, and it creates the defect and repair records that uptime and cost per mile are calculated from.
How many fleet KPIs should I track?
Fewer than you think. Five reviewed monthly, each with an owner and a target, will change more decisions than twenty on a dashboard nobody opens.
Measure what matters and see it change month by month
Put uptime, fuel, inspections, compliance and cost per mile in one place, built from the work your team already does.
Uptime
MPG
Inspections
DOT score
Cost per mile
October 14, 2026
By Derek Goes
All Articles