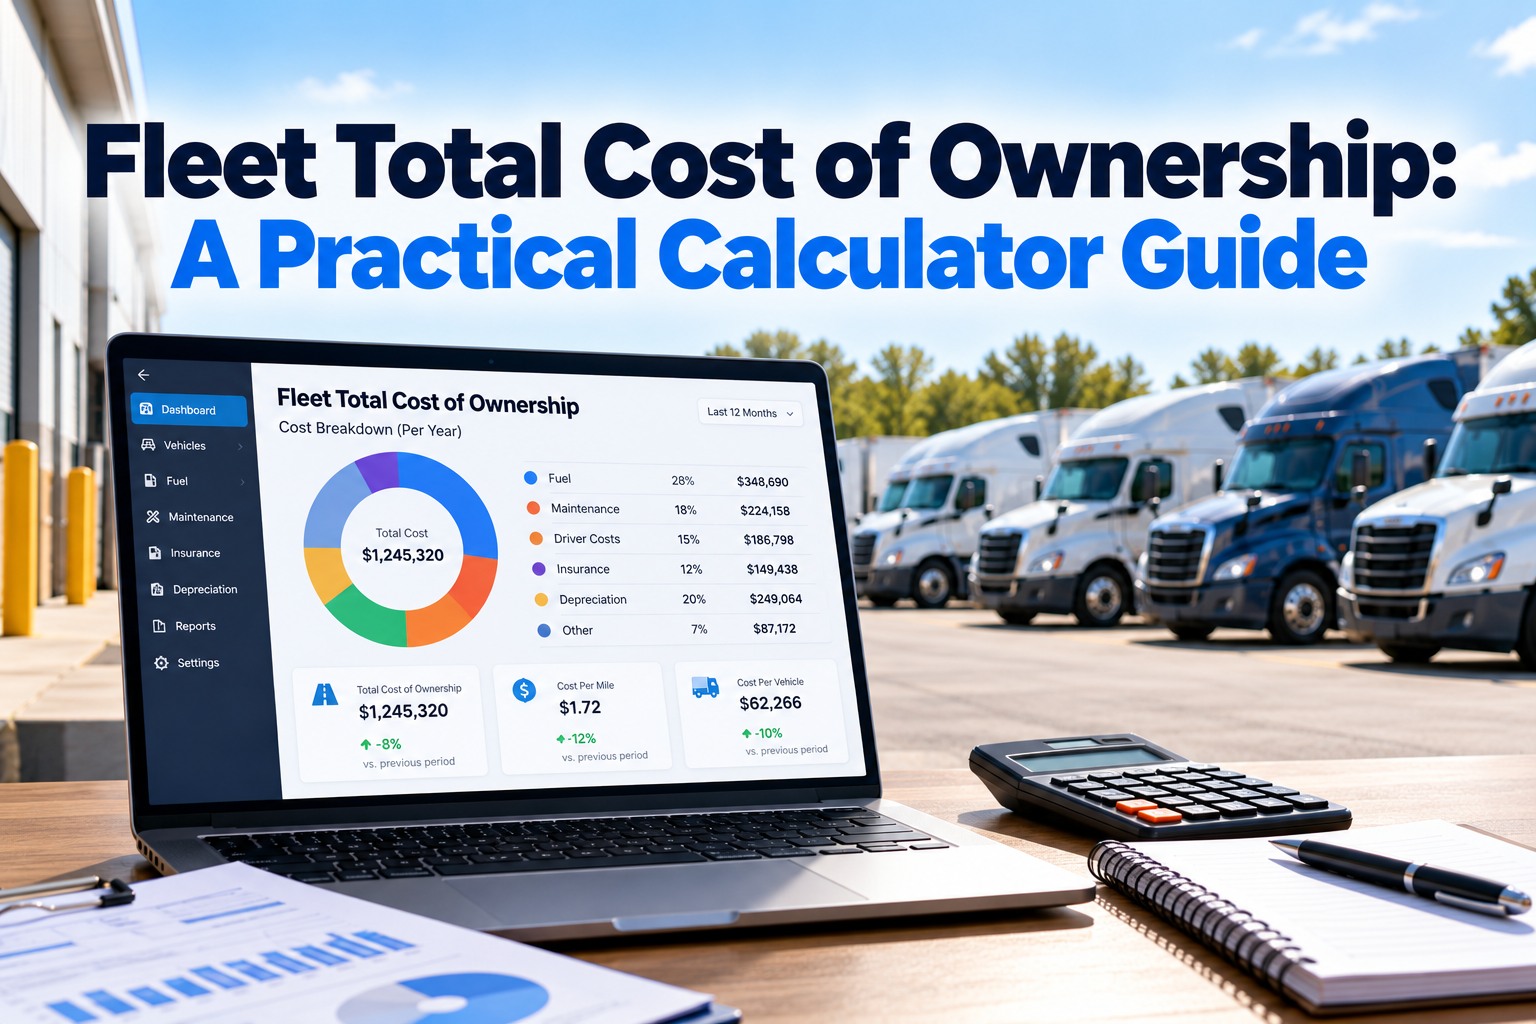
Total cost of ownership is the one calculation that answers the hardest fleet question: when should this truck be replaced? The purchase price is only the start. Over its life a tractor also costs fuel, repairs, tires, insurance and the days it spends in the shop, and it gives some value back when it is sold. Most fleets have every one of these numbers somewhere, but rarely together. This guide sets out a practical TCO model for a Class 8 truck, the inputs it needs and where to find them, a worked example for keeping a truck three, five or seven years, and how to spot the year a truck starts costing more to keep than to replace. To see lifetime costs for your own trucks, book a short demo with our team.
The TCO formula, in one line
Dividing by miles turns TCO into a cost per mile, which lets you compare a truck kept three years with one kept seven, and a new truck with a used one. Driver pay is usually left out of vehicle TCO because it doesn’t change with the truck’s age; include it when you compare total operating cost instead.
The eight inputs, and where each one comes from
Use your own data wherever you have it. The example values come from published 2025–2026 sources and are only a starting point.
Depreciation: the largest cost in the early years
A new Class 8 sleeper tractor costs about $190,000 to $225,000, according to a September 2026 FleetOwner market guide, which also notes that the 12% federal excise tax adds about $22,800 to $27,000 to the price. The same guide puts typical depreciation at 1.5–2% a month, or roughly 18–24% a year, and cites ACT Research that used trucks have historically sold for about 30–35% of the new price. In our model, a $224,000 truck losing 24% of its value each year is worth about $98,000 after three years, $57,000 after five and $33,000 after seven.
Resale values move with the market. The same FleetOwner guide notes that in early 2022, late-model used sleepers sold for about 125% of new truck benchmark prices, before values fell back. A replacement plan that assumes a fixed resale price can be badly wrong in either direction, so check current used values before selling.
A worked example: keeping a truck three, five or seven years
The table applies the formula to one new sleeper at the example inputs, with repair costs rising from about 12 cents a mile in year one to 38 cents in year seven and downtime rising from two to seven days a year. Those repair and downtime curves are assumptions for illustration; your own records are what make the model real.
| Cost over the period | Keep 3 years | Keep 5 years | Keep 7 years |
|---|---|---|---|
| Miles | 258,000 | 430,000 | 602,000 |
| Depreciation | $125,700 | $167,200 | $191,200 |
| Repair and maintenance | $37,800 | $80,800 | $141,000 |
| Fuel, insurance, tires, permits | $167,700 | $279,500 | $391,300 |
| Downtime | $3,600 | $8,400 | $16,800 |
| TCO per mile | $1.30 | $1.25 | $1.23 |
Two things stand out. First, the cost per mile is close across all three, so the decision turns on details: your actual repair curve, your downtime, the resale market and the price of the replacement truck. Second, the year-by-year view in the chart above tells a different story from the lifetime average. Year five is the cheapest single year to run; by year seven each additional year costs more, even though the lifetime average is still falling. That is why fleets should watch the marginal cost of keeping a truck one more year, not just the lifetime figure.
Which inputs move TCO most: a quick sensitivity check
Before trusting any TCO answer, change one input at a time and see how far the result moves. In the five-year example, three inputs dominate.
Fuel moves TCO most, but it moves for every truck at once and doesn’t change which truck to replace. Repairs, resale value and downtime are different: they vary truck by truck, which is why they decide the replacement order. That is also where better records pay off most, because they turn guesses on those three lines into measured numbers.
New or used: the same formula, a different curve
A used truck starts lower on the depreciation line, so its early years are cheaper to own, but it starts higher on the repair curve. The same FleetOwner guide notes that the old rule of thumb of a four-year-old truck with 400,000 miles selling for about $40,000 no longer holds, and cites an example four-year-old sleeper at around $70,000–$75,000. Run the model with the used truck’s price and its expected repair curve, and compare its cost per mile over the years you would keep it with a new truck over the same period. The answer often depends on how well the used truck’s history is documented. A truck with complete maintenance records is a known risk; one without is a guess.
EPA 2027 and the price of the replacement truck
The replacement truck’s price is part of the decision. FleetOwner’s September 2026 guide estimates that EPA’s 2027 heavy-duty low-NOx rule will add about $8,000 to $12,000 to the base price of Model Year 2027 Class 8 trucks, and reports that 2026 pre-buy build slots were exhausted by Labor Day 2026, according to ACT Research and FTR. A higher purchase price raises the depreciation line for the new truck, which can make keeping an existing truck another year the cheaper choice. Run the model for both options, keep and replace, with the replacement priced at today’s quotes.
Buy, finance or lease: where the money cost goes in the model
The worked example leaves financing out to keep the numbers clear, but most fleets don’t pay cash. If you finance, add the interest paid over the period to the ownership line; it is a real cost of keeping capital in the truck. If you lease, the lease payments replace both depreciation and interest, and the residual risk sits with the lessor instead of you. A full-service lease may also cover maintenance, which moves part of the repair line into the payment. Compare options on the same basis: total cost over the same period and miles, divided by miles. A lease that looks expensive per month can be cheaper per mile once the repair curve and resale risk are counted, and the reverse is just as possible.
Five signs a truck has passed its cheapest year
None of these alone means replace. Together, and confirmed by the year-by-year model, they show a truck moving up the right side of the curve.
Fleet-level TCO: the average hides the trucks that cost most
A fleet average TCO is useful for budgeting but misleading for decisions. Two trucks of the same model and age can differ widely in repair cost and downtime, depending on the routes they run, the drivers who run them and their early maintenance history. Rank every truck by its marginal cost per mile over the last twelve months, not by its age. The trucks at the top of that list are the replacement candidates, even if they are younger than some trucks further down. Replacing by cost rather than by model year usually means fewer trucks replaced for the same savings, and the capital goes where it does most good.
Building a TCO calculator in a spreadsheet
A working TCO calculator needs only one row per truck per year. Columns for purchase price, opening value, depreciation, miles, fuel, repair and maintenance, tires, insurance, permits, downtime days and downtime cost. Add a column for marginal cost per mile, the sum of that year’s depreciation, repairs and downtime divided by miles, and a column for lifetime cost per mile to date. The hard part is not the formulas; it is filling the columns with real numbers every month. That is where most TCO models fail: they are built once with estimates and never updated with what each truck actually cost.
The running costs behind TCO, recorded per truck as they happen
The repair curve is the input you can most influence. Planned preventive maintenance keeps it flatter for longer, and keeping every job in fleet maintenance records is what gives the TCO model real numbers instead of estimates.