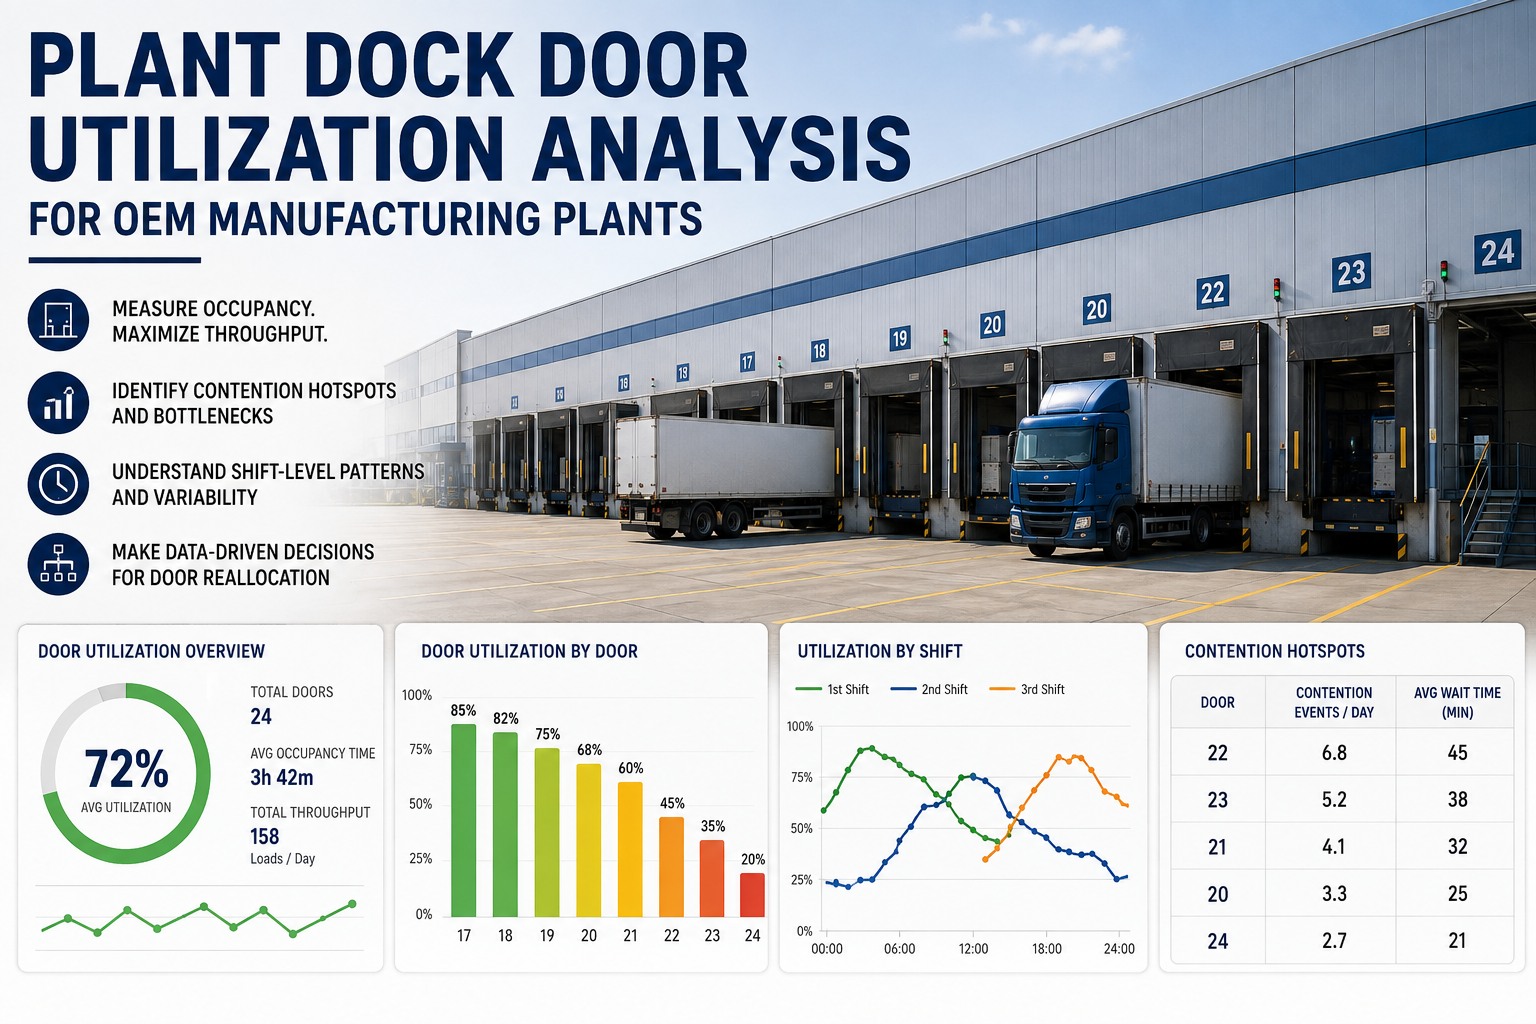
Almost every plant that believes it needs more dock doors is wrong, and the number that proves it is already in their data. Door utilisation is trivially easy to calculate and almost universally calculated in a way that hides the answer: one figure, averaged across every door and every hour, which lands somewhere in the sixties and gets read as spare capacity. It is not spare capacity. It is four doors saturated between six and ten in the morning and eight doors idle after two in the afternoon, averaged into a number that describes no moment that ever actually occurred. The useful analysis is the opposite of an average — utilisation per door, per hour, cross-referenced with dwell, because the pairing of those two signals is what tells you whether you have a capacity problem or an assignment problem. They demand completely different investments. This covers how to measure occupancy properly, how to find contention hotspots, how to read shift-level patterns, and how to build the reallocation case before anyone signs off on construction. Ask for the deployment brief to see the measurement model applied to your own door list.
ANALYSIS GUIDE · OEM PLANT DOCKS
Dock Door Utilisation Analysis for Plant Logistics
Occupancy measured per door and per hour, contention hotspots made visible, shift-level arrival patterns read correctly, and a reallocation case built on evidence rather than on the feeling that the dock is busy.
Measuring Occupancy Without Fooling Yourself
Two formulas are in common use and they answer different questions. Pick both, deliberately, and know which one you are quoting in any given meeting — because they can point in opposite directions on the same dock.
Time-based — the primary measure
Active door hoursTotal available door hours
Answers: how much of the available door time was actually productive. This is the number to plan capacity against.
Point-in-time — the operational measure
Doors in use right nowTotal doors
Answers: how much headroom exists at this instant. Useful for release throttling, useless for capacity planning.
Decide what counts as "active" before you measure anything
CountsTrailer spotted and secured at the door
CountsUnload or load physically in progress
CountsVerification and count at the door face
CountsInterior clear-away blocking the next spot
Does notDoor reserved but empty awaiting a held trailer
Does notTrailer parked at door with no work assigned
That fifth line is where most measurement programmes quietly break. Counting a reserved-but-empty door as active inflates utilisation and conceals precisely the waste you are trying to find — and it is the default behaviour of several scheduling tools unless you configure otherwise.
What the Number Should Be
There is a correct band, and it is nowhere near the top of the range. High utilisation is not a goal — it is a warning that recovery capacity has been consumed.
← Swipe to see all columns →
The Diagnostic That Decides Where the Money Goes
Utilisation on its own tells you almost nothing. Paired with dwell, it tells you everything. This is the single most useful analysis on the page, because the two low-utilisation quadrants lead to opposite conclusions and only one of them costs capital.
High utilisation · Dwell rising
Genuinely capacity-constrained
The dock is doing the work and cannot do more. Legitimate options: add doors, extend operating hours, or spread arrivals harder with appointment discipline. This is the only quadrant where construction is a defensible answer, and even here appointments are usually the cheaper first move.
High utilisation · Dwell stable
Running well, close to the edge
Healthy but without slack. Protect it rather than push it — the next volume increase lands directly on recovery capacity. Watch for the first sign of dwell drift; that is the transition into the quadrant above, and it arrives faster than the volume curve suggests.
Low utilisation · Dwell rising
Assignment failure, not capacity
The most misdiagnosed quadrant in plant logistics. Doors sit idle while trucks wait, which means eligibility rules, door assignment logic or arrival clustering are wrong. Adding doors here spends capital to make an idle asset idler. Fix assignment first.
Low utilisation · Dwell stable
Genuine spare capacity
Rare, and worth confirming before you believe it. Check that the average is not concealing a saturated peak. If it holds up hour by hour, doors can be reallocated to other flows or consolidated to reduce operating cost.
The reason this matters commercially
A dock reading 58% utilisation with climbing dwell will be presented internally as evidence that volumes have outgrown the building. It is almost always the opposite — trucks clustering into a two-hour band against doors that are only partly eligible for the freight arriving. Same symptom, opposite prescription, and roughly two orders of magnitude difference in cost.
Before anyone costs a dock extension, run the four-quadrant test.
The deployment brief sets out how door occupancy and dwell are captured, how the per-door hourly view is built, and what the reallocation analysis looks like when it comes back.
Finding Contention Hotspots
Contention is not a dock-wide condition. It is specific doors, in specific hours, usually driven by eligibility rather than volume. Plot occupancy as a grid — door down the side, hour across the top — and the pattern becomes obvious in a way no summary statistic ever delivers.
Illustrative occupancy grid — a shift that reads 64% on average
06
07
08
09
10
11
12
13
D1 · T4
D2 · T4
D3 · T3
D4 · T2
D5 · T1
D6 · T1
Idle
Light
Moderate
Busy
Near capacity
Saturated
Three doors are saturated for four consecutive hours while three sit near-idle all shift — and the dock-wide average still reads in the mid-sixties. Note that the saturated doors are the T3 and T4 tiers. That is the signature of an eligibility hotspot, not a volume problem: the freight can only go where the capability exists, so adding T1 doors would change nothing at all.
Reading Shift-Level Patterns
Dock utilisation reads low at most sites for one structural reason: trucks cluster at the start and end of the day. That clustering is a carrier behaviour, a slot-design artefact, or both — and it is entirely invisible in a daily average. Cross-reference occupancy against time slot and day of week before drawing any conclusion. Our analytics and reporting layer is where these views get built.
Pattern 1
Bookend clusteringArrivals concentrated at shift open and close. Peak doors saturate while midday capacity is wasted. Fix is slot redistribution, not doors.
Pattern 2
Day-of-week skewMonday and Thursday carrying disproportionate volume from weekly supplier despatch cycles. Fix sits with the supply base, not the dock.
Pattern 3
Tier concentrationCapability-restricted doors saturated while general doors idle. Fix is either re-tiering a door or re-routing the freight that needs it.
Pattern 4
Shift-handover troughA reproducible dip where nothing gets spotted for twenty minutes twice a day. Costs more annual door hours than most people believe.
Pattern 5
Sequence-window shadowDoors held empty ahead of a frozen window. Legitimate, but it must be measured as reserved rather than counted as active occupancy.
Pattern 6
Checkout tailDock-out to gate-out exceeding twenty to thirty minutes points at paperwork handoff, seal application or gate queue — not at the door itself.
What the VDA and Odette Layer Contributes
Message quality is not usually filed under utilisation, but it belongs there — because verification and count sit inside active door hours, and that component collapses when the arriving load is already described accurately in a validated message.
VDA 4987 despatch adviceContents known before the trailer is spotted, so verification becomes confirmation rather than discovery. Replaced legacy VDA 4913 and derives from EDIFACT DESADV.
VDA 4937 acknowledgementAPERAK receipt confirming the message validated. Without it you do not know whether the data you are planning against is trustworthy.
VDA 4902 Odette transport labelScanned rather than keyed at receipt. Directly reduces the verify component of active door hours on every single load.
VDA 4945 transport statusIn-transit events that let a door be released rather than reserved when a load is running late. Reserved-but-empty is pure lost occupancy.
Practical consequence: segment your utilisation data by whether the load arrived with a validated despatch advice. The gap between the two populations is usually large enough to fund the EDI compliance work on its own, and it reframes a supplier data project as a dock capacity project.
Building the Reallocation Case
Reallocation is nearly always cheaper than construction and nearly always harder to get approved, because the case has to be made from data rather than from the visible fact that the dock looks busy. Match the signal to the move, then verify the stated precondition before committing.
← Swipe to see all columns →
Get the Deployment Brief
Sets out how door occupancy and dwell are captured, how the per-door hourly grid is constructed, how the four-quadrant diagnostic is applied, and what integration is required with your existing gate, yard, WMS and EDI landscape. Written for plant logistics and industrial engineering teams, not as a product overview.
Per-door hourly occupancy
Contention hotspot mapping
Reallocation modelling
VDA / Odette segmentation
Frequently Asked Questions
What is a good dock door utilisation figure?
For a plant dock, 60–75% is the healthy operating band, and a well-scheduled site running appointment discipline can hold 75–85%. Above 85% you are in congestion territory — trucks queue, detention accrues and receiving teams start compromising on accuracy to keep doors moving. The common error is treating 100% as the target. Full utilisation means no recovery capacity, so a single delay slips the entire schedule, and on a plant dock that slip reaches a sequence window rather than just a shipping cut-off.
Our utilisation is 60% but trucks still wait. How is that possible?
That combination is diagnostic, and it is the most misread signal on a dock. Low utilisation alongside rising dwell points at scheduling or assignment problems rather than capacity — doors sitting idle while trucks wait means the freight cannot go to the empty doors, or the arrivals are clustered into a band the schedule never spread. Building additional doors in this state spends capital to add idle assets. Fix eligibility rules, door assignment logic and slot distribution first, then re-measure.
Why is a per-hour view worth the effort?
Because an average daily occupancy rate conceals the peaks entirely, and the peaks are the only part that constrains you. A dock averaging in the mid-sixties can be fully saturated for four consecutive hours and near-idle for the rest of the shift; the average describes a state that never occurred and prescribes nothing useful. Occupancy history cross-referenced against time slots and days of week is what converts the number from a statistic into a decision, and it usually takes a fortnight of data to become obvious.
Should a reserved but empty door count as utilised?
No, and configuring it correctly matters more than it sounds. Counting reservation as occupancy inflates the headline figure and hides the exact waste you are hunting — a door held for forty minutes against a trailer that arrives late is lost capacity, not productive time. Measure reserved time as its own category. High reserved-but-empty totals are usually the fastest available capacity recovery, because they are solved with a maximum hold rule rather than with any capital spend.
How does EDI message quality affect door utilisation?
Through the verify component of active door hours. Where a load arrives with a validated despatch advice and a scannable Odette transport label, verification is a confirmation step measured in minutes; where it arrives with paperwork, it becomes a data-entry exercise at the door face. Segment your occupancy data by whether the load had a validated message and compare the two populations — the difference is usually substantial enough to justify chasing the non-compliant suppliers on capacity grounds alone. Our
integrations overview covers the message surface.
When is adding doors actually the right answer?
When utilisation is genuinely high, dwell is rising with it, and slot redistribution, tier reallocation, hold-duration limits and inbound-outbound separation have all been tried and measured. That is a short list and most plants have not completed it. The reason the discipline matters is that a dock extension is a multi-year capital item that also consumes yard apron and changes traffic flow, while the alternatives above are configuration changes measured in weeks. Exhaust the cheap levers, document that you did, then the construction case defends itself.
How long does it take to get a usable baseline?
Two to four weeks of per-door, per-hour data covering a full weekly cycle, since day-of-week skew from supplier despatch patterns will not appear in a shorter sample. You need door occupancy start and end, dwell per trailer, and the door tier — that is enough to build the grid and run the four-quadrant test. Anything longer is refinement rather than discovery; the hotspots are almost always visible in the first complete week. A
deployment brief review covers exactly what has to be captured.
Measure the Peaks, Not the Average
Per-door hourly occupancy, contention hotspots mapped against door capability, shift and day-of-week patterns read correctly, and a reallocation case that stands up before any capital is committed.
Works alongside existing WMS and EWM · No dock hardware required · Site-level configuration
August 11, 2026
By Jam Henderson
All Articles